DESCRIPTIVE EPIDEMIOLOGY Dr Navya N Assistant Professor Department

 Descriptive studies a) Randomised controlled trials")


 Higher Prevalence in Urban Areas • • •")


 Case reports: • Documents unusual medical occurrence • Represent the first")
 � Advantages �Useful for hypothesis generation �Informative for very rare disease")

- Slides: 32
DESCRIPTIVE EPIDEMIOLOGY Dr Navya N Assistant Professor Department of Community Medicine Yenepoya Medical College
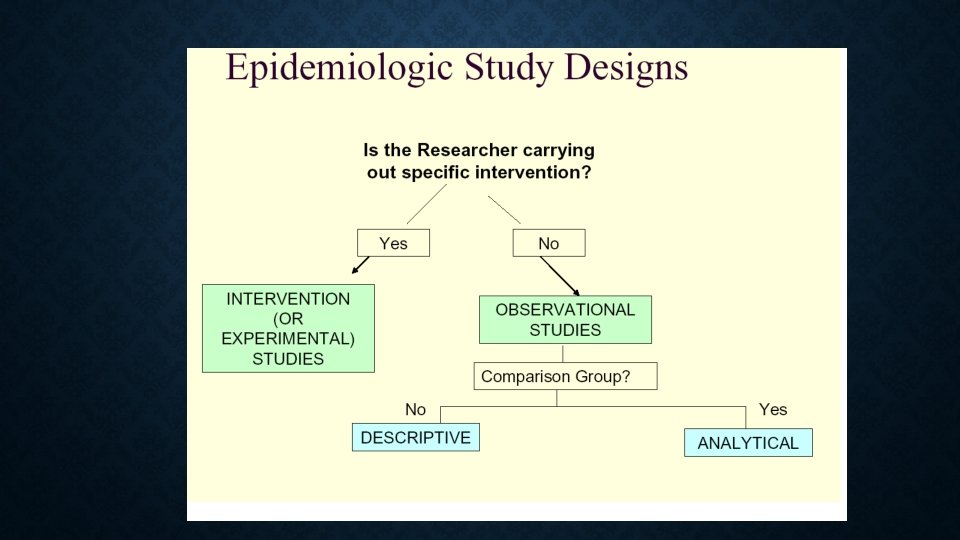
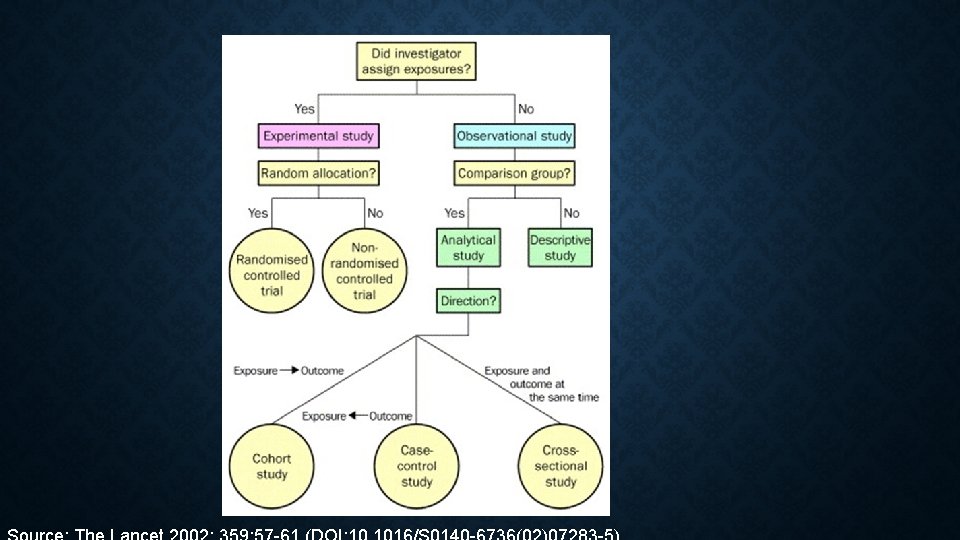
CLASSIFICATION 1. OBSERVATIONAL STUDIES 2. EXPERIMENTAL STUDIES a) Descriptive studies a) Randomised controlled trials / clinical trials – unit of study – patients b) Field trials/ community intervention studiesunit of study – healthy people c) Community trials – unit of study – community b) Analytical studies • Ecological studies/ correlational – unit of studypopulation • Cross sectional/ prevalence – unit of study – individuals • Case control/ case reference – unit of study – individuals • Cohort / follow up – unit of study – individuals
OBSERVATIONAL VS EXPERIMENTAL STUDIES Observational studies Allow nature to take its course - investigator measures but does not intervene • Descriptive study: focuses - description of the occurrence of a disease in a population • Analytical study: analyses relationships between health status and other variables Experimental or interventional studies: involve an active attempt to change a disease determinant(e. g an exposure or a behaviour) or the progress of a disaese (through treatment) • Studies- based- group- had the experience compared -control group- not had the experience.
DESCRIPTIVE EPIDEMIOLOGY • 1 st phase – epidemiological investigations • Concerned – observing – distribution of disease / health related characteristics - Identifying characteristics- disease in question – associated • Such studies – ask questions a) When is disease occurring ? – time distribution b) Where is it occurring ? – place distribution c) Who is getting the disease – person distribution
PROCEDURES IN DESCRIPTIVE STUDIES • Defining the population to be studied • Defining the disease under study • Describing the disease by – time place person • Measurement of the disease • Comparing with known indices • Formulation of an aetiological hypothesis
DEFINING THE POPULATION • Define - Size and composition • Whole population or representative sample or specially selected group • Health facility should be close enough to provide relatively easy access for patients requiring medical services • Provides the denominator
DEFINING THE DISEASE UNDER STUDY • Definition – Precise & valid • To identify those who have the disease from those who do not • Operational definition- it is defined as the disease or condition which can be identified and measured in the defined population with degree of accuracy. • Operational definition- spells out clearly- criteria - disease can be measured. • Eg: Tonsillitis- presence of enlarged, red tonsils with white exudate which on throat swab culture grow predominantly S. pyogenes • Once established the case definition must be adhered- throughout the study
TIME DISTRIBUTION • Pattern of disease- described- time of its occurrence - hour of onset, day of the week, month, year • Disease is seasonal in occurrence or not • Periodic increase or decrease • Important clues- source or etiology of the disease • Helps in taking preventive measures
TIME DISTRIBUTION • SHORT TERM FLUCTUATIONS • PERIODIC FLUCTUATIONS • LONG TERM OR SECULAR TRENDS
TIME DISTRIBUTION – SHORT TERM FLUCTUATIONS • “The occurrence in a community region of cases of an illness or other health-related events clearly in excess of normal expectancy” • Types of epidemics A. Common - source epidemics • Single exposure or "point source" epidemics- exposure brief and simultaneous, all cases – 1 incubation period ( food poisoning ) , epidemic curve – rises and falls rapidly- no secondary waves • Continuous or multiple exposure epidemics- well – contaminated water , Sex worker with gonorrhoea B. Propagated epidemics- infectious origin • Person-to-person- hepatitis A, polio • Arthropod vector- dengue • Animal reservoir C. Slow (modern) epidemics
TIME DISTRIBUTION – PERIODIC FLUCTUATIONS • SEASONAL TREND – measles, varicella, upper respiratory tract infections, malaria etc • CYCLIC TREND – occur-cycles over a period of days, weeks, months/ years -measles- pre-vaccination era- appeared in cycles-major peaks every 2 -3 years and rubella every 6 -9 years. -Non-infectious conditions: automobile accidents in US- week-ends • LONG TERM / SECULAR TREND – changes – occurrence of disease – long period- time - diabetes, coronary heart disease
PLACE DISTRIBUTION 1. International variations 2. National variations 3. Rural - urban differences 4. Local distributions
PLACE DISTRIBUTION International variations • Variation in the pattern of disease in different parts of the world Eg: Cancer, CHD • Helps to identify factors which are crucial in the cause & prevention of disease
PLACE DISTRIBUTION National variation: • Variation in occurrence of disease within the country • Eg: Endemic goitre, lathyrism, flurosis, malaria It helps • To demarcate the affected areas • For providing appropriate health care services
PLACE DISTRIBUTION (RURAL /URBAN VARIATION ) Higher Prevalence in Urban Areas • • • Chronic bronchitis, lung cancer, accidents, cardiovascular diseases, mental illness and drug Higher Prevalence in Rural Areas • Skin, zoonotic diseases and soil transmitted helminthes • Death rates - infant and maternal mortality rates- higher • Variations- due to population density, social class, medical care deficiencies, education & environmental factors 17
PLACE DISTRIBUTION Local distribution: • Inner & outer city variations Spot or shaded maps: • Areas of high & low frequency • Boundaries • Pattern of disease distribution • If the map shows “clustering” of cases, it may suggest a common source of infection or common risk factor shared by all cases.
19
MIGRATION STUDIES • Migration of human population from one country to another - provides unique opportunity – evaluate- role - genetic & environmental factors - occurrence of disease in a population • 2 types (a) Comparison of disease and death rates for migrants with those of their kin who have stayed at home. (b) Comparison of migrants with local population of the host country provides information on genetically different groups living in a similar environment.
PERSON DISTRIBUTION 1. Age 2. Sex 3. Ethnicity 4. Marital Status 5. Occupation 6. Social class 7. Behaviour 8. Stress 9. Migration
PERSON DISTRIBUTION • Age- Certain diseases are more frequent in certain age groups Eg; Measles in childhood Cancer in middle age Atherosclerosis in old age • Bimodality Sometimes there may be two separate peaks in the age incidence curve of a disease Eg; Hodgkin’s disease, leukaemia, and female breast cancer. 22
PERSON DISTRIBUTION Sex • Eg; Diabetes, hyperthyrodism, obesity, are more common in women, and diseases such as lung cancer, CHD, are less frequent in women Ethnicity • Eg; tuberculosis, essential hypertension, cancer, sickle cell anaemia Marital status • Mortality rates were always lower for married males and females than for the unmarried, of the same age and sex 23
PERSON DISTRIBUTION Occupation • Workers in coal mines - silicosis, sedentary occupation face the risk of heart disease. Social class • Health and disease are not equally distributed in social classes Eg; coronary heart disease, hypertension, diabetes- higher prevalence in higher class 24
PERSON DISTRIBUTION Behaviour • Human behavior- risk factor in coronary heart disease, cancer, obesity. • The behaviour factors which have attracted the greatest attention are cigarette smoking, sedentary life, over-eating and drug abuse. Stress • Stress has been shown to affect a variety of variables related to patients response, eg; susceptibility to disease, exacerbation of symptoms. 25
4. MEASUREMENT OF DISEASES • To obtain estimates of magnitude of health & disease problem in a population • Mortality • Morbidity • Incidence • Longitudinal studies • Prevalence • Cross sectional studies 26
5. COMPARING WITH KNOWN INDICES • Comparison • Different population • Different sub groups • Helps to identify groups who are at increased risk • Gives clues about disease etiology 27
6. FORMULATION OF HYPOTHESIS A hypothesis- supposition, arrived at from observations or reflections An epidemiological hypothesis should specify the following • The population –the Characteristics of the persons to whom the hypothesis applies. • Specific cause being considered • Expected outcome-the disease • Dose- response relationship- the amount of the cause needed to lead to a stated incidence of the effect 28 • Time- response relationship- the time period that will elapse between exposure to the cause and observation of the effect
USES OF DESCRIPTIVE EPIDEMIOLOGY • To generate hypothesis • To permit evaluation of trends in health & disease and comparisons among countries and subgroups within countries. • To provide a basis for planning, provision and evaluation of health services • To identify problems to be studied by analytical methods and to suggest areas that may be fruitful for investigation
CASE STUDIES(CASE SERIES) Case reports: • Documents unusual medical occurrence • Represent the first clues- formulation of hypothesis, • Generally report- new or unique findings and previous undescribed disease. Case series: • collection of individual case reports- occur within a fairly short time, and experience of a group of patients with similar diagnosis.
CASE STUDIES(CASE SERIES) � Advantages �Useful for hypothesis generation �Informative for very rare disease with few established risk factors �Usually of short duration. � Disadvantages �Cannot study cause and effect relationships �Cannot assess disease frequency
THANK YOU