DEMOGRAPHY Population Pyramids Dr Salwa Tayel Prof Ashry

- Slides: 35
DEMOGRAPHY: Population Pyramids Dr. Salwa Tayel & Prof. Ashry Gad KSU Department of Family & Community Medicine (December, 2013) 9/25/2020 1
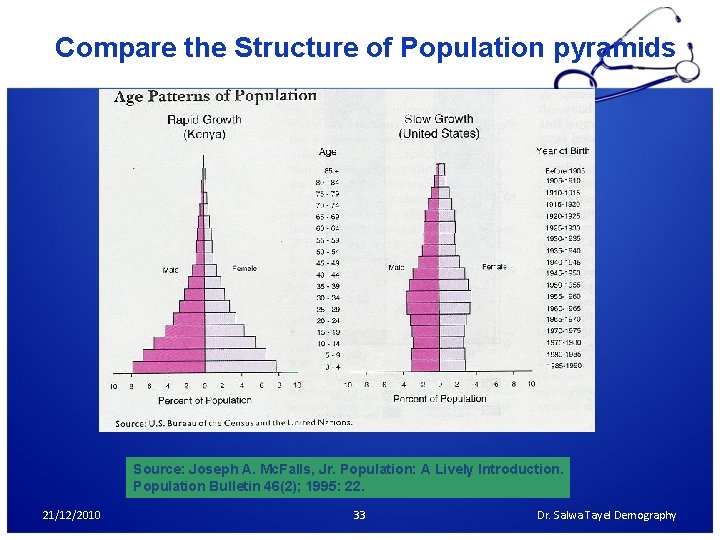
OBJECTIVES OF THE LECTURE By the end of this lecture students will be able to: • Define demography • List elements of demography • Describe population pyramids • Compare between population pyramids of developed and developing countries. 9/25/2020 2
Definition of Demography v Demography is the science that studies human population. v Demography: The study of populations, especially with reference to size and density, fertility, mortality, growth, age distribution, migration, and vital statistics, and the interaction of all these with social and economic conditions. (Oxford Dictionary) 9/25/2020 3
Elements of Demography: Three main elements of demography: 1 - Size of population (census) 2 - Composition 3 - Distribution 9/25/2020 4
Population Census • The population size is determined by counting the inhabitants and their characteristics periodically. • Census enumeration of a population usually records identity of all persons in every place of residence, with age or birth date, sex, occupation, national origin, language, religion, marital status, income, educational level (or literacy). 9/25/2020 5
Population Census • Census data is of importance for every country for planning purposes and is usually done every 10 years. • The population size in inter-censal years (years between each census) is estimated from births, deaths and net migration. 9/25/2020 6
Types of Census: A. De Facto Enumeration: Counting all people in the locality according to their location at the time of enumeration irrespective of the person’s usual residence. De Facto census is: economic procedure and simple But, moving people can be counted twice areas with high migration or high seasonal mobility It is adopted in the majority of countries. 9/25/2020 7
Types of Census: B. De Jure Enumeration: A de jure census assigns persons according to their usual place of residence at the time of enumeration. Gives a factual figure Expensive More difficult and takes time adopted in U. S. A. 9/25/2020 8
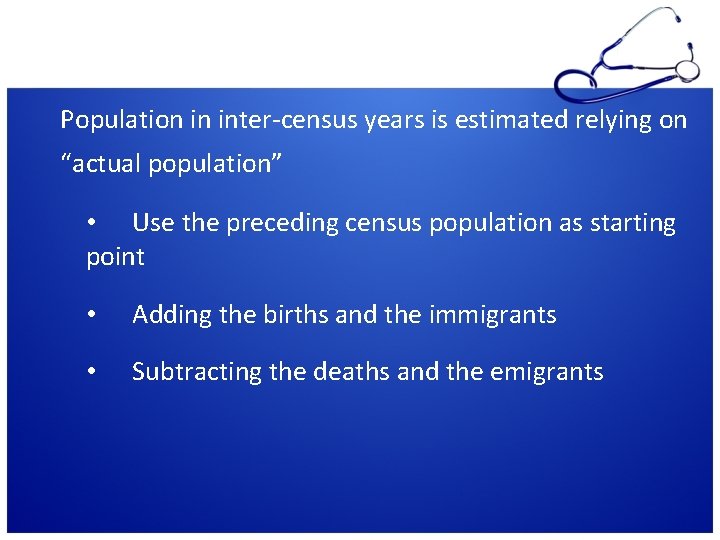
Inter-census estimate Population in inter-census years is estimated relying on “actual population” • Use the preceding census population as starting point • Adding the births and the immigrants • Subtracting the deaths and the emigrants
Mid Year Population • The population count is adjusted to represent the population as of July the 1 st of the year • The mid year population is used to compute indicators related to population
Uses of population census • Provides information on the changes of population size • Population size is needed to compute morbidity, mortality and fertility rate • Related to “health status” of the population as it depends on the dynamic relationship between number of people, their characteristics and the space they occupy • Planning of health services is guided by demographic
Population Pyramids 9/25/2020 12
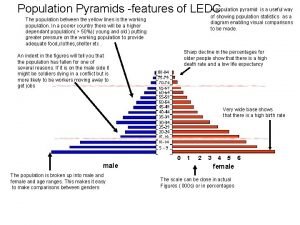
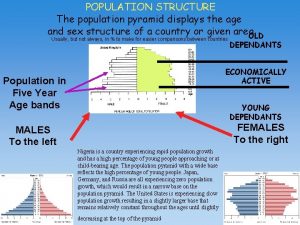
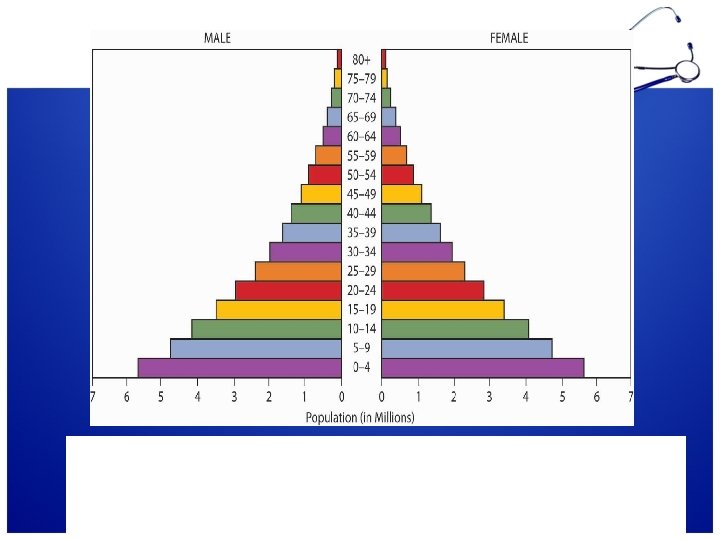
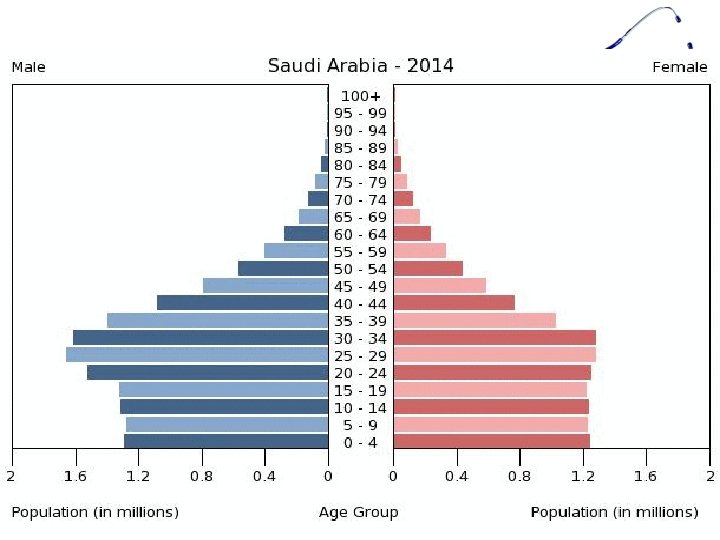
POPULATION PYRAMIDS: THE AGE-SEX COMPOSTION OF POPULATIONS Population pyramid is the graphical presentation of the age and sex composition of a population of an area or country at a certain point in time. The shape of the pyramid reflects the major influences of births and deaths, in addition to any changes due to migration. 9/25/2020 13
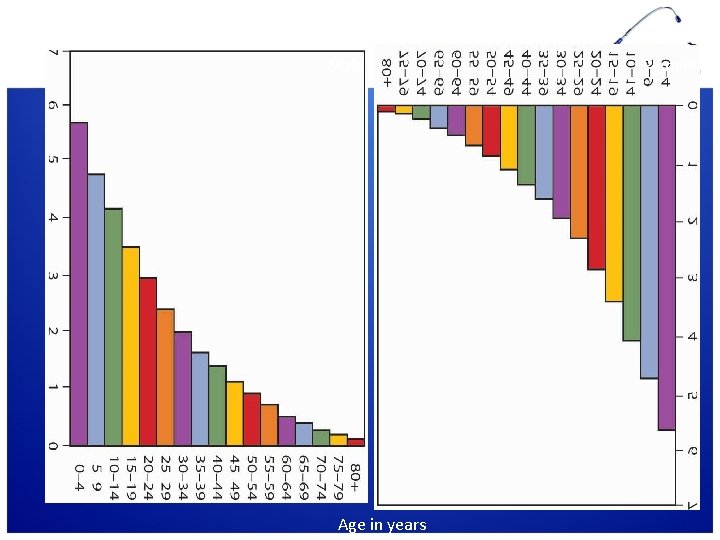
Population (in millions) Male Age in years Female
Population pyramid is a graphical presentation of the age and sex composition of the population represented by two histograms (one for male and the second for female) of the age distribution of the population set at 5 -year interval and placed back to back
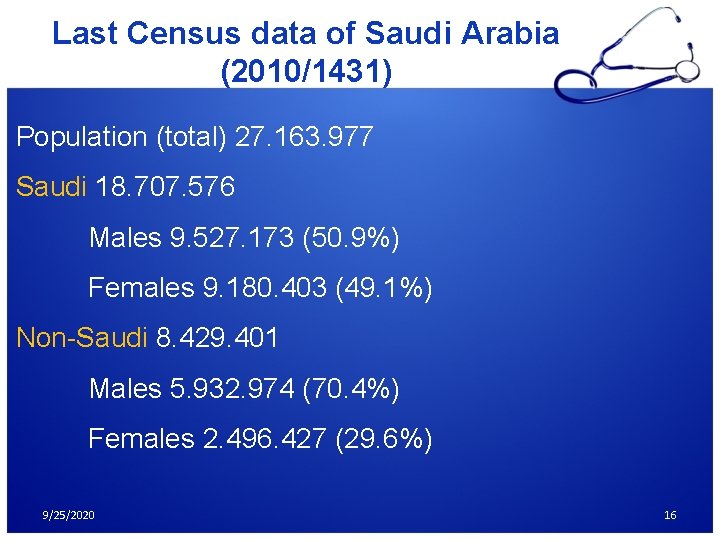
Last Census data of Saudi Arabia (2010/1431) Population (total) 27. 163. 977 Saudi 18. 707. 576 Males 9. 527. 173 (50. 9%) Females 9. 180. 403 (49. 1%) Non-Saudi 8. 429. 401 Males 5. 932. 974 (70. 4%) Females 2. 496. 427 (29. 6%) 9/25/2020 16
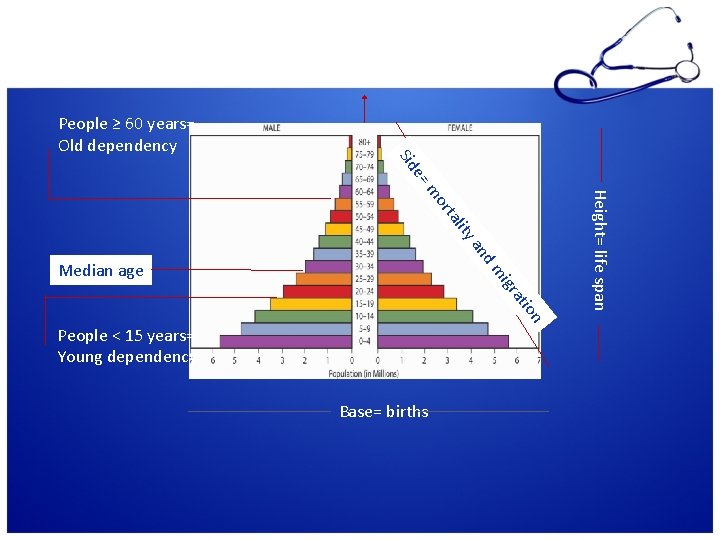
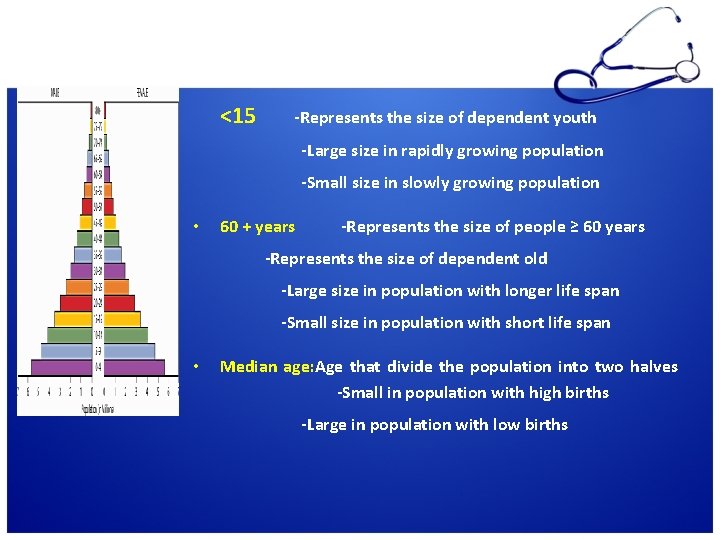
Apex= People living to old age ion at igr Median age People < 15 years= Young dependency Base= births Height= life span d m an lity ta or m e= Sid People ≥ 60 years= Old dependency
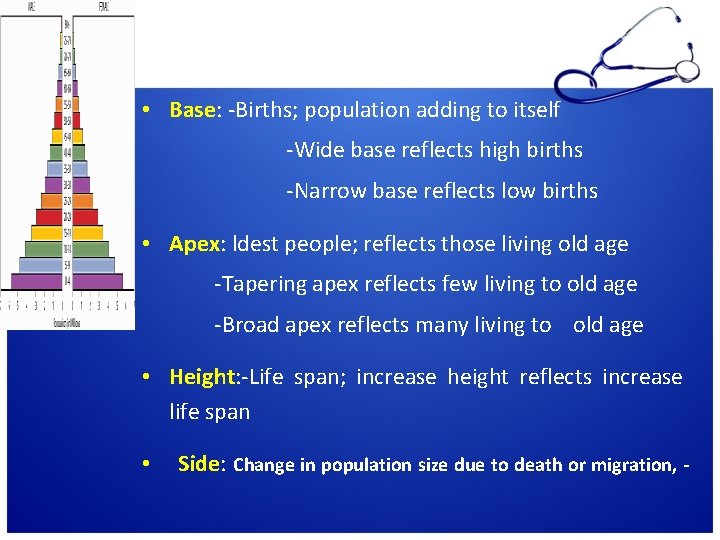
• tion of males and females • Base: -Births; population adding to itself -Wide base reflects high births -Narrow base reflects low births • Apex: ldest people; reflects those living old age -Tapering apex reflects few living to old age -Broad apex reflects many living to old age • Height: -Life span; increase height reflects increase life span • Side: Change in population size due to death or migration, -
• Less than 15 -Represents the size of people below 15 years <15 -Represents the size of dependent youth -Large size in rapidly growing population -Small size in slowly growing population • 60 + years -Represents the size of people ≥ 60 years -Represents the size of dependent old -Large size in population with longer life span -Small size in population with short life span • Median age: Age that divide the population into two halves -Small in population with high births -Large in population with low births
SAUDI POPULATION
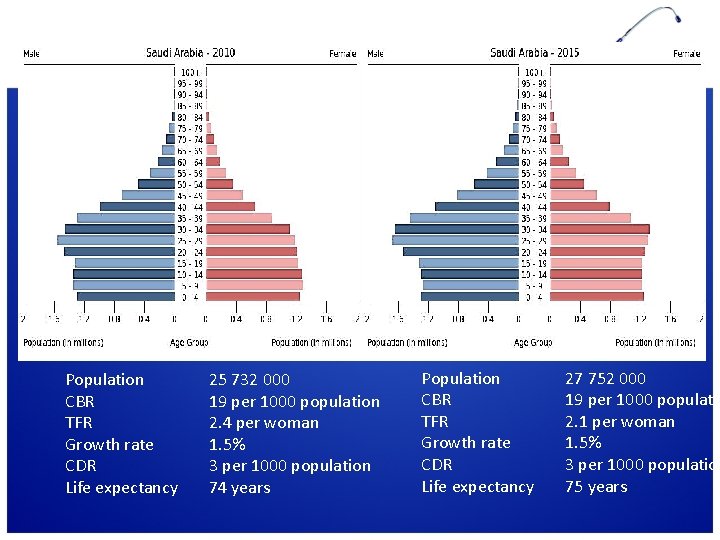
Population CBR TFR Growth rate CDR Life expectancy 25 732 000 19 per 1000 population 2. 4 per woman 1. 5% 3 per 1000 population 74 years Population CBR TFR Growth rate CDR Life expectancy 27 752 000 19 per 1000 populatio 2. 1 per woman 1. 5% 3 per 1000 population 75 years
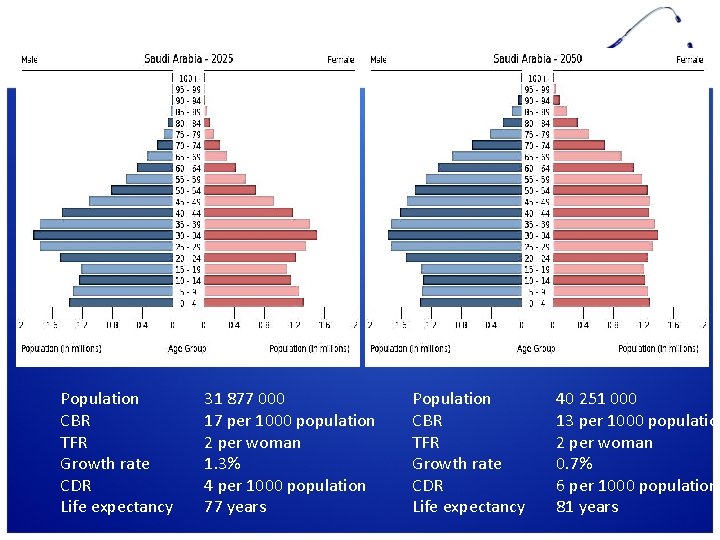
Population CBR TFR Growth rate CDR Life expectancy 31 877 000 17 per 1000 population 2 per woman 1. 3% 4 per 1000 population 77 years Population CBR TFR Growth rate CDR Life expectancy 40 251 000 13 per 1000 population 2 per woman 0. 7% 6 per 1000 population 81 years
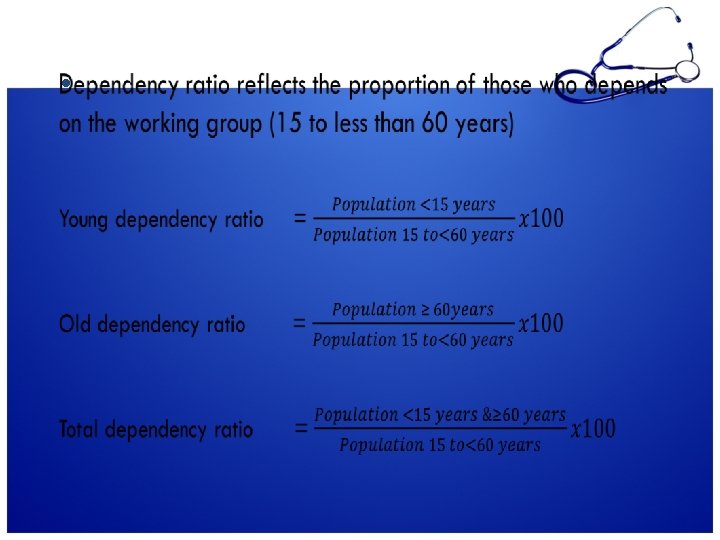
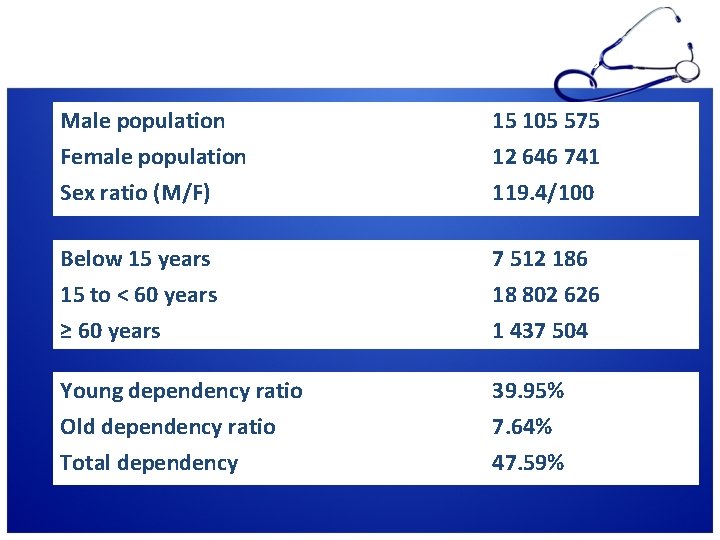
Total population 27 752 316 Male population Female population Sex ratio (M/F) 15 105 575 12 646 741 119. 4/100 Below 15 years 15 to < 60 years ≥ 60 years 7 512 186 18 802 626 1 437 504 Young dependency ratio Old dependency ratio Total dependency 39. 95% 7. 64% 47. 59%
9/25/2020 25
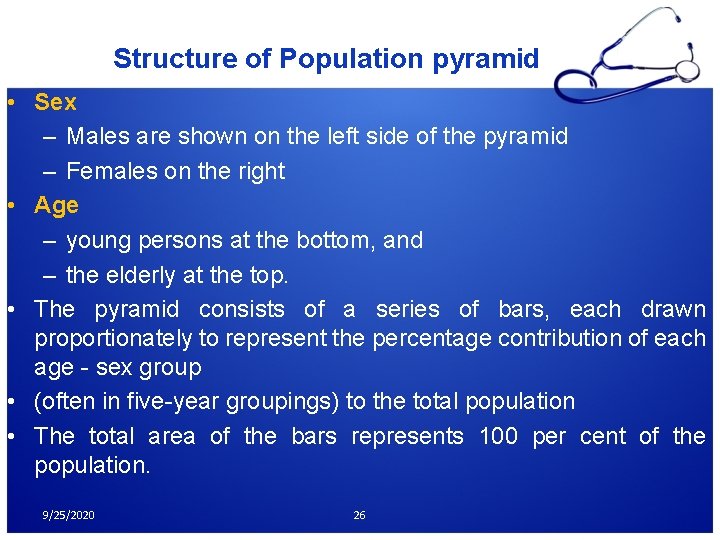
Structure of Population pyramid • Sex – Males are shown on the left side of the pyramid – Females on the right • Age – young persons at the bottom, and – the elderly at the top. • The pyramid consists of a series of bars, each drawn proportionately to represent the percentage contribution of each age - sex group • (often in five-year groupings) to the total population • The total area of the bars represents 100 per cent of the population. 9/25/2020 26
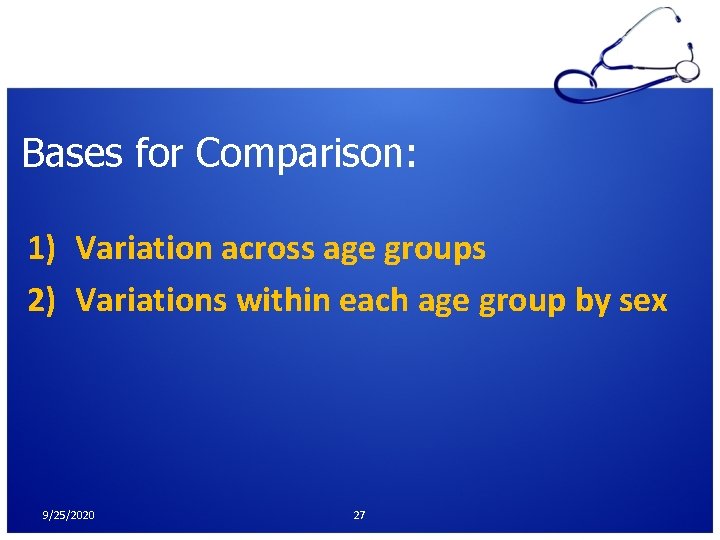
Bases for Comparison: 1) Variation across age groups 2) Variations within each age group by sex 9/25/2020 27
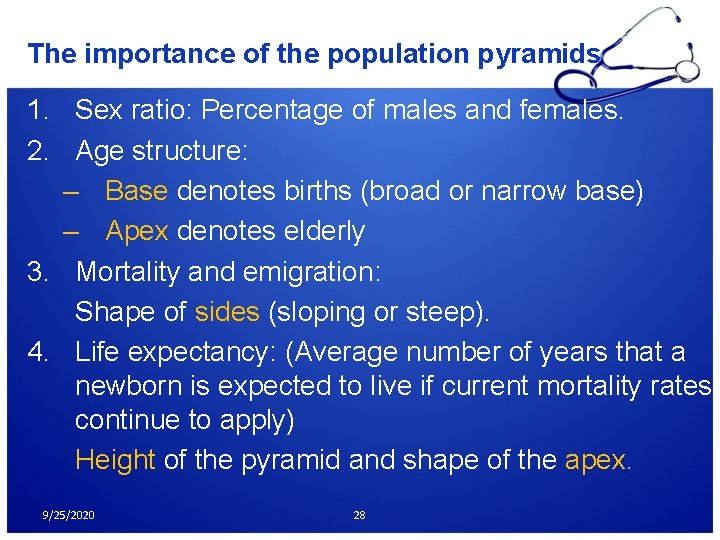
The importance of the population pyramids 1. Sex ratio: Percentage of males and females. 2. Age structure: – Base denotes births (broad or narrow base) – Apex denotes elderly 3. Mortality and emigration: Shape of sides (sloping or steep). 4. Life expectancy: (Average number of years that a newborn is expected to live if current mortality rates continue to apply) Height of the pyramid and shape of the apex. 9/25/2020 28
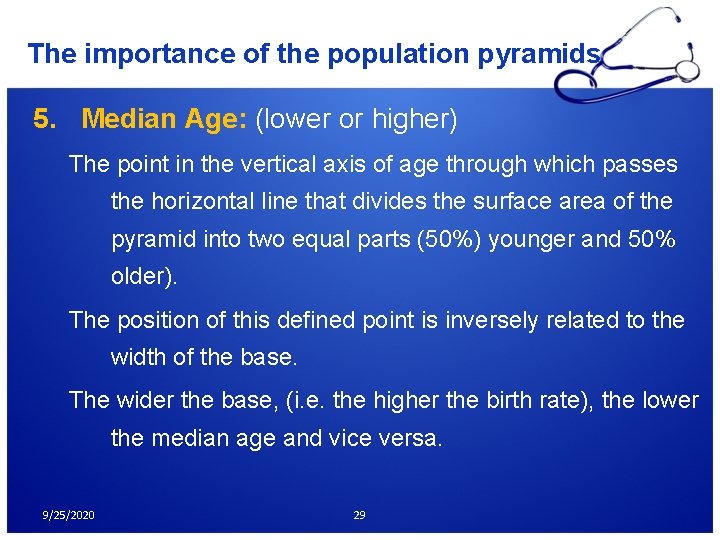
The importance of the population pyramids 5. Median Age: (lower or higher) The point in the vertical axis of age through which passes the horizontal line that divides the surface area of the pyramid into two equal parts (50%) younger and 50% older). The position of this defined point is inversely related to the width of the base. The wider the base, (i. e. the higher the birth rate), the lower the median age and vice versa. 9/25/2020 29
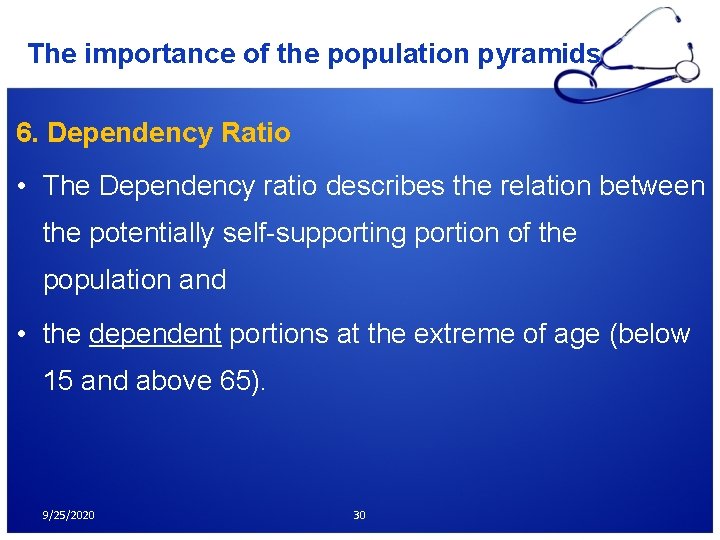
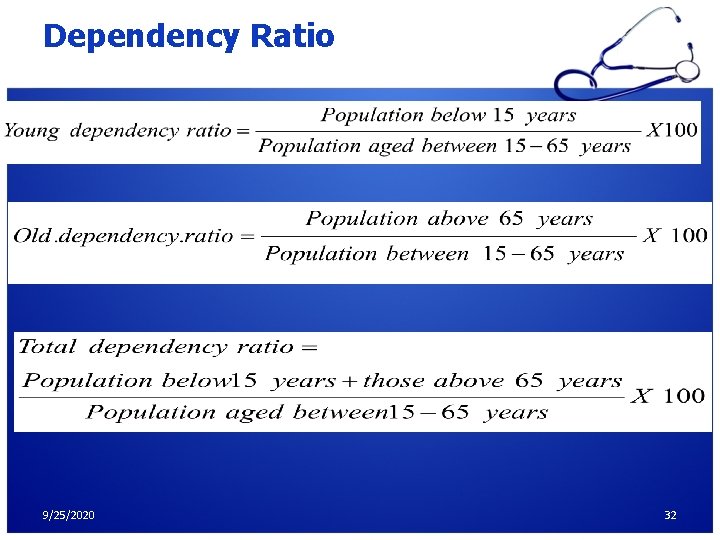
The importance of the population pyramids 6. Dependency Ratio • The Dependency ratio describes the relation between the potentially self-supporting portion of the population and • the dependent portions at the extreme of age (below 15 and above 65). 9/25/2020 30
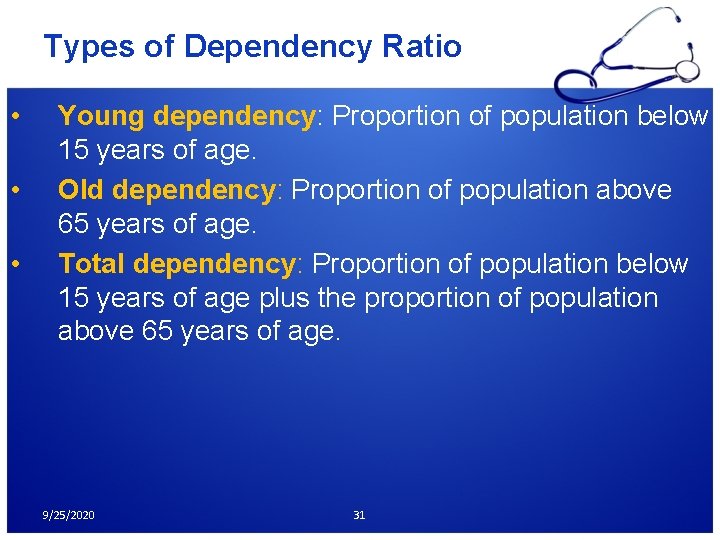
Types of Dependency Ratio • • • Young dependency: Proportion of population below 15 years of age. Old dependency: Proportion of population above 65 years of age. Total dependency: Proportion of population below 15 years of age plus the proportion of population above 65 years of age. 9/25/2020 31
Dependency Ratio 9/25/2020 32
Compare the Structure of Population pyramids Source: Joseph A. Mc. Falls, Jr. Population: A Lively Introduction. Population Bulletin 46(2); 1995: 22. 21/12/2010 33 Dr. Salwa Tayel Demography
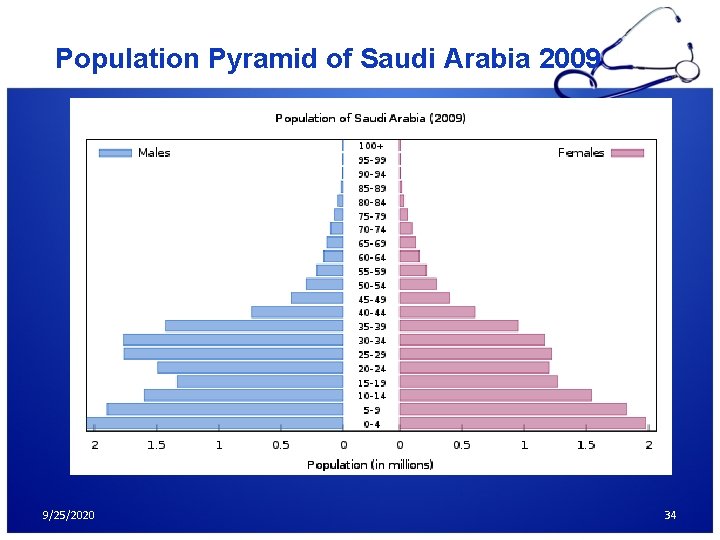
Population Pyramid of Saudi Arabia 2009 9/25/2020 34
References • Last JM, editor. Dictionary of epidemiology. 4 th ed. New York: Oxford University Press; 2001 • World Health Statistics 2011. Indicator compendium. Indicator Code Book. World Health Statistics - World Health Statistics indicators • Core Health Indicators, Health indicators WHO. Available at: http: //apps. who. int/whosis/database/core_sel ect. cfm? str. ISO 3 9/25/2020 35