Consider these two websites Your observations Why do

Consider these two websites:

Your observations • Why do these sites exist? • What actions do the site owners want site visitors to take?

Web Analytics Overview Mitchell Teixeira teixeim@yahoo. com
 • Web Developer since late")
Background about me • mainframe computer operations roots (1988) • Web Developer since late 1996 • B 2 B - Launched first website for Overnite Transportation (now UPS Freight) in 1997 • B 2 C – moved to multi-channel ecommerce in 2000 began ‘serious’ Webtrends implementations in 2005 • 2007 – present: freelance web development and web analytics implementation
 • This presentation is from a Web Analytics implementation viewpoint and")
Perspective (disclaimer? ) • This presentation is from a Web Analytics implementation viewpoint and will touch upon some marketing terms • Web analytics topics can get into the weeds on technical details really fast – this presentation is an attempt to offer a highlevel view about web analytics concepts, data gathering, reporting and usage

Objectives • • • What is Web Analytics Concepts and Sample reports How to get started Live analytics tool walkthrough (time permitting) Questions
… Web Analytics is")
What is Web Analytics? According to the Digital Analytics Association (DAA)… Web Analytics is the measurement, collection, analysis and reporting of Internet data for the purposes of understanding and optimizing Web usage.

Web Analytics Cycle

Great News: You have a Web Site! So what! Site owners have questions… • Is anyone using the site? • Is it running? • Is it effective? (effective at what!? ) • ? ? ? (What else can you think of? ) Web analytics can answer these questions and more!

Define Metrics for your web venture • • Business website? Government agency site? Non-profit ? Hobby / leisure ? What actions do you want your visitors to take on your site? Define measurable goals for your website The metrics most important to your business become your Key Performance Indicators (KPIs)
")
Defining Metrics (getting started)

Defining Goals we can measure

Select a tool • • Free tools Paid tools Hosted tools Self Hosted tools (if privacy or data sharing is an issue)
 • Omniture (Adobe) • Webtrends (the")
Paid tools Big 3 vendors • Coremetrics (IBM) • Omniture (Adobe) • Webtrends (the pioneer!) • Unica (IBM) (high end) • Click. Tracks • dozens of other hosted products
 • Piwik (open source")
Free Tools • Google Analytics (the game changer since 2005) • Piwik (open source alternative, but self-hosted) • Pinterest Analytics (new since March 2013!) • Many others (see wikipedia)
 • Google Analytics, Yahoo")
Self-Hosted vs. Hosted = software as a service (Saa. S) • Google Analytics, Yahoo Analytics and all ‘paid’ services • No hardware investment (cap. exp. ) Self-hosted • Run the W. A. software in your data center • Logfiles or data collection setup

Initial Implementation • Register for Google Analytics • Create a web “property” for the site • Download simple “tag” • Install tag on every page of the site
![Google Analytics Java. Script “tag” <script type="text/javascript"> var _gaq = _gaq || []; _gaq.](http://slidetodoc.com/presentation_image_h/1db4c32cb75fdeb4a1a640def26d4c15/image-18.jpg "Google Analytics Java. Script “tag” <script type=\"text/javascript\"> var _gaq = _gaq || []; _gaq.")
Google Analytics Java. Script “tag” <script type="text/javascript"> var _gaq = _gaq || []; _gaq. push(['_set. Account', 'UA-999999 -99']); _gaq. push(['_track. Pageview']); (function() { var ga = document. create. Element('script'); ga. src = ('http: //www. google-analytics. com/ga. js'); ga. set. Attribute('async', 'true'); document. Element. first. Child. append. Child(ga); })(); </script>
")
Web Analytics Reports “Big 3” (building blocks)

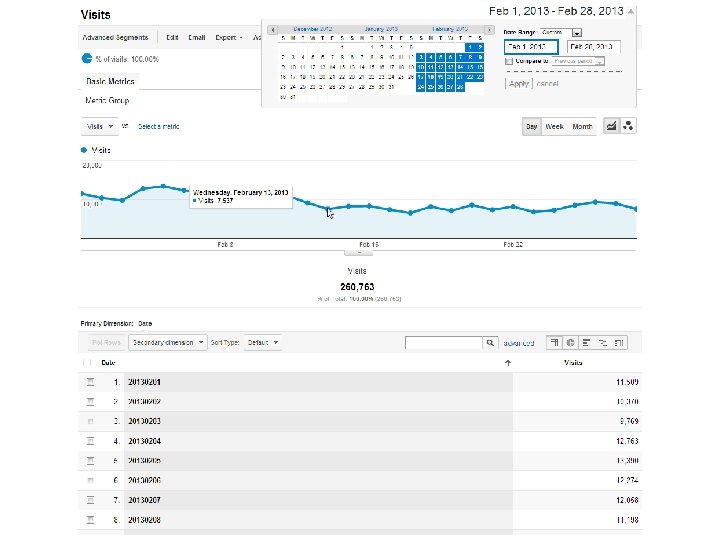
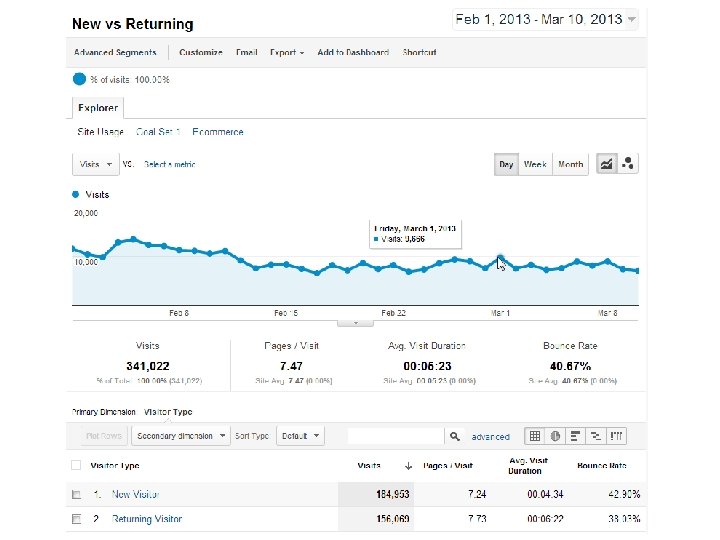
Visits • Basically, a count of how many times the site was viewed by visitors • Another term for a visit is session. A session includes all the pages a visitor views at one sitting. • Total visits is a count of all the sessions during a given time period • Considered by many to be the most accurate measure of site utilization
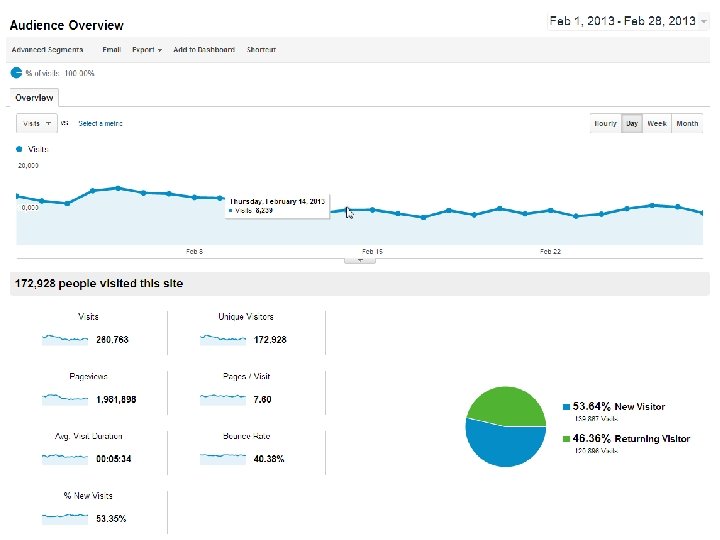

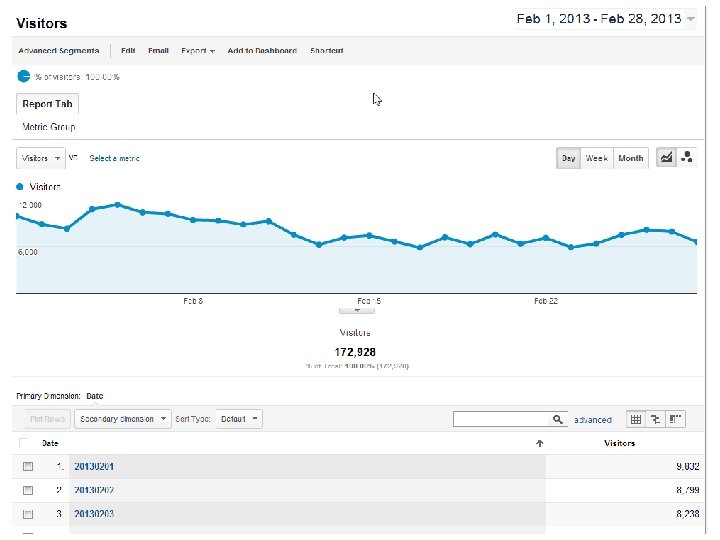
Visitors / Unique Visitors • Sometimes simply called uniques • An attempt to quantify site visitors as individual warm bodies or pairs of eyeballs • Caveats – Technical issues may distort this count – Same person can view site from multiple computers and is counted each time – etc.

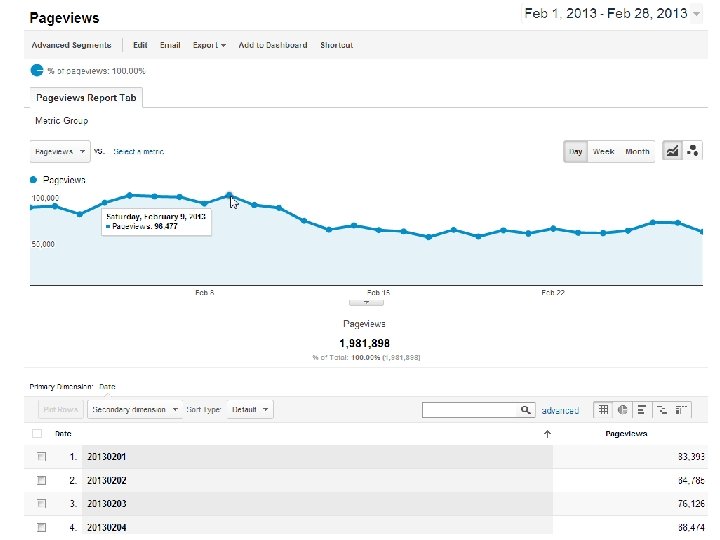
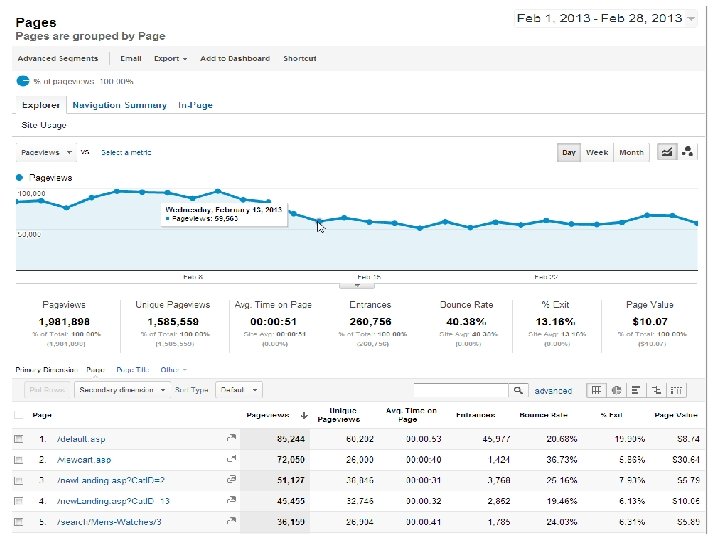
Page Views • Count of how many times a page was accessed on your site • Aggregate count of how many times all site pages were viewed Basically: what did visitors look at, and how many times did they look?

Sample Pages Report

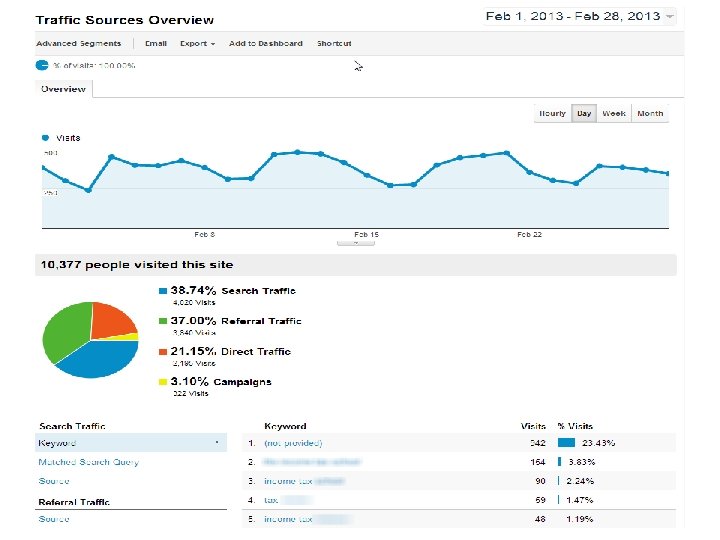
More reports: Traffic Where is my site’s traffic coming from? – Direct (typed or bookmarked) – Organic search – Paid search (pay-per-click) – Links – Social networks – Other paid campaigns
 Report")
Technology (Browsers) Report

Mobile Browsers Report

Mobile Browsers Visits Report
")
Mobile Usage year-over-year (Custom Report)

Other uses for web analytics data • Website availability and usability tracking • Track inbound links for reputation management and to prevent content theft • Determine the words and phrases visitors use to find your site

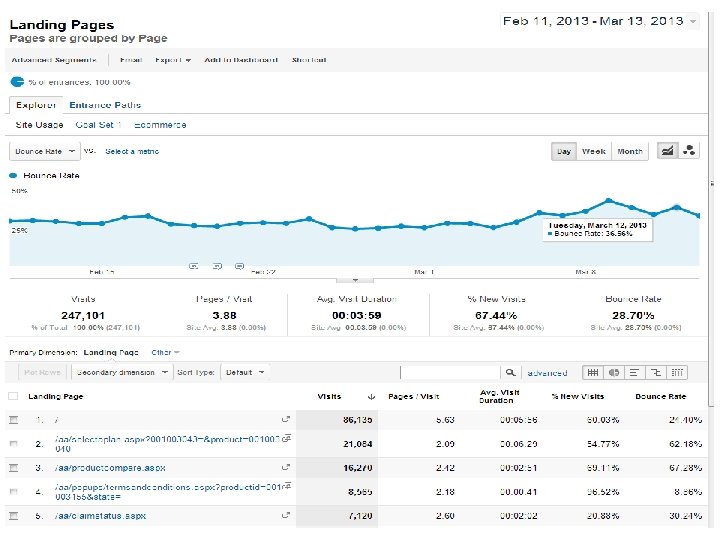
Engagement Are visitors to my site interested in the content? Indicators: • Visit Length (time on site) • Bounces / Bounce Rate • Return Visits • Content reports (page views) • Click Map data: (overlays, heat maps)

Engagement Metrics: visit duration bucketed by visits and pageviews
 Click Density report provide a visual display of clicks / link")
Click Maps (overlays) Click Density report provide a visual display of clicks / link popularity

Bounces / Bounce Rate Wikipedia defines Bounces: A bounce occurs when a web site visitor only views a single page on a website, that is, the visitor leaves a site without visiting any other pages before a specified session-timeout occurs.
")
Bounce Rate “rules of thumb” (no industry standards here!)

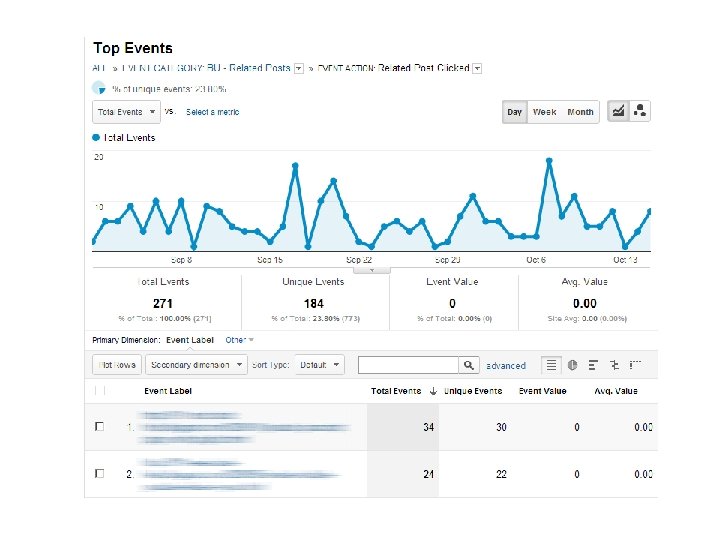
Events

Track Page Events for insights Clicks which occur on the same page • Downloads • Image Zoom • Content tabs

Conversion • A site visitor completes a ‘goal’ on your site (completes a sale, registers, subscribes, finds an article, self-support, etc. ) • Sales aren’t the only conversions in the web analytics world

Tracking Conversion • Trends and factors which affect sales, registration, lead generation, subscription, • Many conversions are a multi-step sequence of events • Some analysts label each event, or step, in the conversion process a ‘micro conversion’

One way to do it…. • Count the page views for each step in the conversion process and enter the data onto a worksheet or spreadsheet • With each step closer to the goal, you may notice the number of page views for each step decreasing • The ‘funnel’ shape emerges….
 Homepage 122683 Product 78394 Add to Cart 9923 Checkout")
Rudimentary Conversion Funnel (Page views) Homepage 122683 Product 78394 Add to Cart 9923 Checkout 768 Confirmation 99 (notice the funnel appearance of the numbers above)

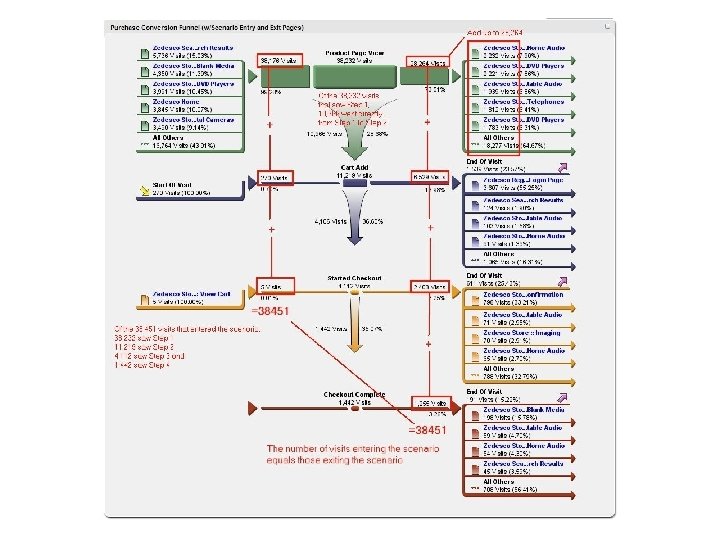
Graphic Conversion Funnel

Digging Deeper • Scenario Analysis reports may contain surprise insights into visitor behavior – monitor unexpected entry and exit pages • “Path” Reports provide insight when visitor behavior isn’t recorded in a Scenario Analysis/funnel report
")
Scenario Analysis • Webtrends Scenario Analysis (butterfly report)
 Conversions > Multi-Channel Funnels > Top Conversion Paths")
Multi-Channel Funnels (path to conversion) Conversions > Multi-Channel Funnels > Top Conversion Paths
 reports Visualize planned and unexpected paths taken by visitors from selected pages")
Path (Flow) reports Visualize planned and unexpected paths taken by visitors from selected pages In Google Analytics, use Pages >Navigation Summary

Orange denotes Fallout

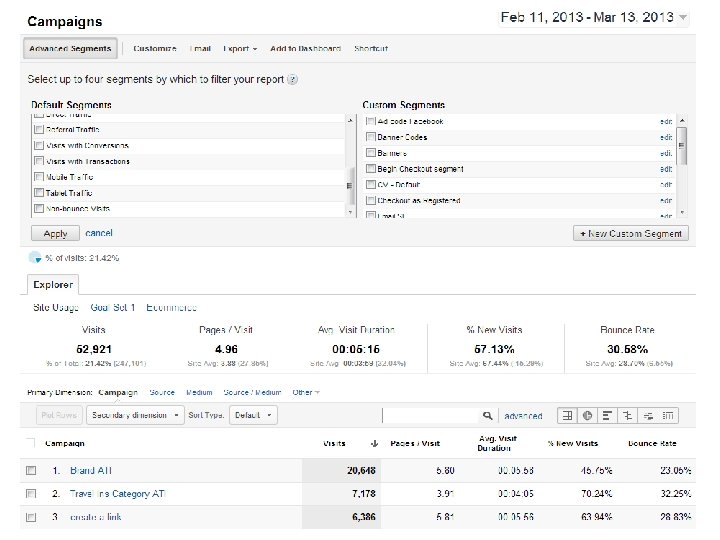
Campaigns • Marketing campaigns include print ads, web banner advertisements, paid search ads, email ‘blasts’, social media activities, etc. • Tracking code usage and proper tagging appropriate to the tools in use is essential
 visitor data to find insight")
Campaign info availability leads to segmenting • Segment (filter) visitor data to find insight in the groups of visitors passing through your site • Possible to segment on many other parameters

Combine Dimensions & Metrics to find insights So far we’ve only used ‘standalone’ building block metrics Next we’ll combine these building block metrics to get insight into visitor behavior

Custom Reports • Google Analytics allows users to create Custom Reports using dimensions and metrics to create useful non-standard reports • Previously this capability was available only in enterprise-level (paid) web analytics products

Creating new Custom Reports

Dashboards summarize your most important reports on a single sheet
 email delivery of dashboards, alerts,")
Report Delivery • • web browser access (standard method) email delivery of dashboards, alerts, SMS text messages (usually alerts) mobile browser access (smartphones, i. Pad, etc. ) • Plugins to client software such as Excel • APIs allow integration with other applications

Data Export • All web analytics tools offer a way to get data out of the system in one format or another, which will allow you to manipulate the data as needed.

Data Validation If available, attempt to validate and augment your web analytics data with internal systems data • Accounting and fulfillment system (ERP) • CRM systems data • Data warehouse

Augment Web Analytics Reports • Customer Flow – Can you join web analytics visitor data with data from a downstream system to determine new or existing customers? • Are online visitor actions cost-effective or money saving? • Web self-service vs. phone center costs

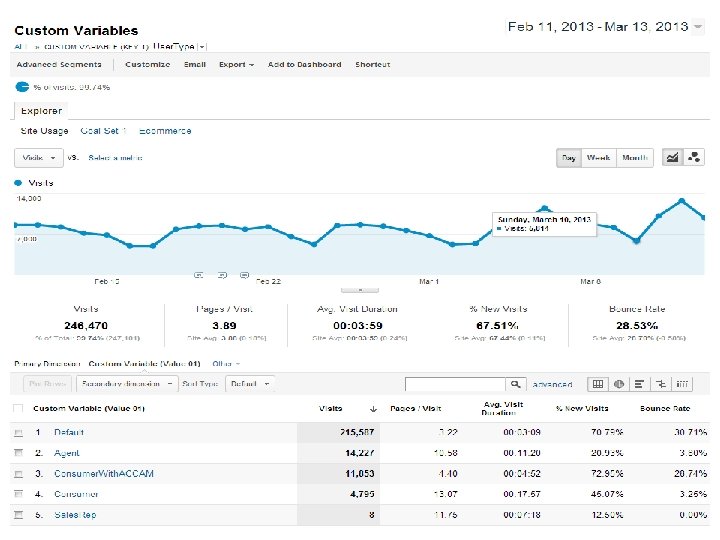
Custom tagging • Depending on the web analytics tool in use, special tags (small blocks of code or extra link parameters) are installed on each page of the site • Tags may also be installed on inbound links • These tags provide additional segment and event tracking input for the web analytics tool
 Your web analytics tool is not generally")
Pitfalls (where did I go wrong? ) Your web analytics tool is not generally a ‘system of record’ such as your CRM or ERP systems, but reports should be reasonable… Reasons why your reports aren’t accurate: • • all pages of the site not tagged (use WASP tool) tool not implemented properly (used wrong/outdated tags) lack of understanding and cooperation between marketing and IT non-qualified or incompletely qualified consultants data and reports not validated needs and requirements not correctly specified Remember that web analytics won’t capture offline sales data (but many systems allow data and event import)

Conclusion • Question and Answer • Clarifications • Google Analytics quick walkthrough

References • Web Analytics 2. 0 by A. Kaushik • Web Analytics Demystified • anything by Eric Peterson, Jim Sterne, Jim Novo • Blogs and whitepapers

Thank you! mitchell@onceinaweb. com
- Slides: 73