Circular Dichroism Part I Introduction Circular Dichroism Circular

 spectroscopy measures differences in the absorption of left-handed polarized")


")


![Optical Rotation • Usually reported as a specific rotation [ ], measured at a](https://slidetodoc.com/presentation_image_h/b41488d0da2996321057267bb3ec8a9f/image-11.jpg "Optical Rotation • Usually reported as a specific rotation [ ], measured at a")


![Optical rotary dispersion • ORD curve is a plot of molar rotation [ ]](https://slidetodoc.com/presentation_image_h/b41488d0da2996321057267bb3ec8a9f/image-14.jpg "Optical rotary dispersion • ORD curve is a plot of molar rotation [ ]")


 whereas circular")


, anything that adds")


 were")


 330 C P-DNA (47. 5% methanol/5%")
 poly(d. T) as a function")
 260 210 250 280")


 negative at 195 nm (n->p*) b")

 Induced Helix")


- Slides: 78
Circular Dichroism Part I. Introduction
Circular Dichroism Circular dichroism (CD) spectroscopy measures differences in the absorption of left-handed polarized light versus righthanded polarized light which arise due to structural asymmetry. The absence of regular structure results in zero CD intensity, while an ordered structure results in a spectrum which can contain both positive and negative signals. Jasco J-810 Circular Dichroism System
Chiral structure can be distinguished and characterized by polarized light Optical rotation: rotation the rotation of linearly polarized light by the sample Optical rotary dispersion: dispersion the variation of optical rotation as a function of wavelength. The spectrum of optical rotation. Circular Dichroism: Dichroism the difference in absorption of left and right circularly light.
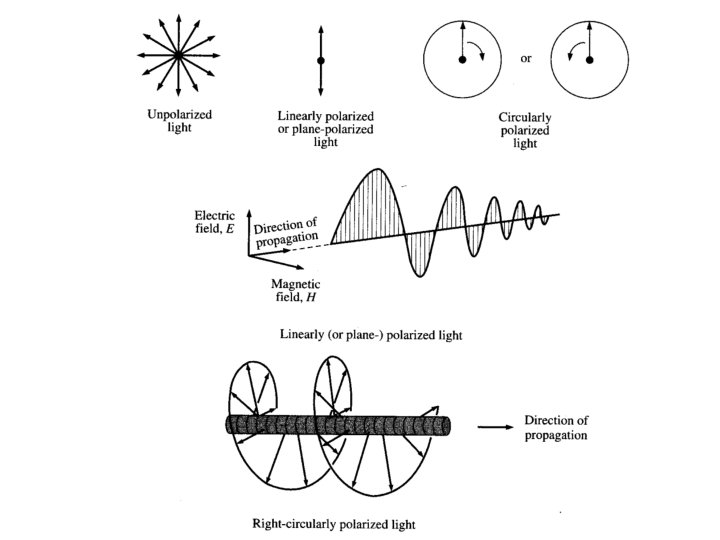
Types of polarized light • Plane polarized light consists two circularly polarized components of equal intensity • Two circularly polarized components are like left- and right-handed springs • As observed by looking at the source, right-handed circularly polarized light rotates clockwise • Frequency of rotation is related to the frequency of the light • Can be resolved into its two circularly polarized components • When added together after passing through an optically isotropic medium, plane polarized light results
Polarized Light Linear Polarized Light
Circular Polarized Light Passing plane polarized light through a birefringent plate (in the z-direction) which splits the light into two plane-polarized beams oscillating along different axes (e. g. , fast along x and slow along y). When one of the beams is retarded by 90º (using a quarter-wave retarder) then the two beams which are now 90º out of phase are added together, the result is circularly polarized light of one direction. By inverting the two axes such that the alternate beam is retarded than circularly polarized light of the other direction is generated. The result of adding the right and left circularly polarized that passes through the optically active sample is elliptically polarized light, thus circular dichroism is equivalent to ellipticity
Polarized Light Circularly Polarized Light Left-handed right-handed
Optical rotary dispersion • If the refractive indices of the sample for the left and right handed polarized light are different, when the components are recombined, the planepolarized radiation will be rotated through an angle • nl, nr are the indices of the refraction for lefthanded and right-handed polarized light • is in radians per unit length (from )
Optical Rotation n refractive index wavelength of light f angle of rotation
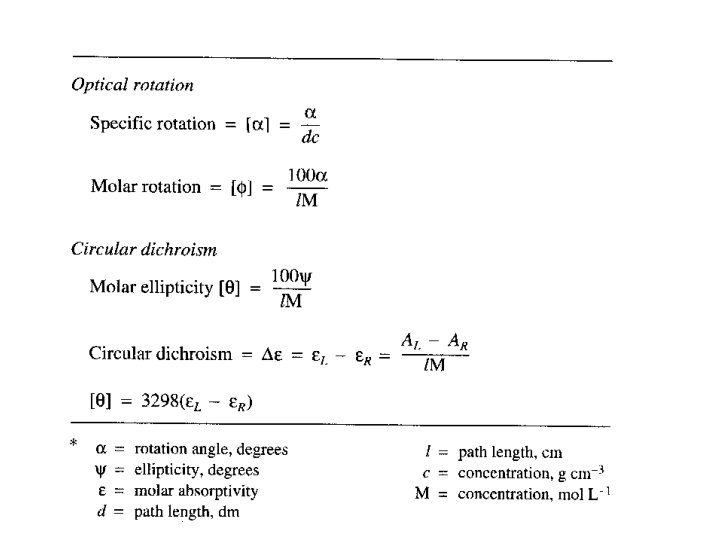
Optical Rotation • Usually reported as a specific rotation [ ], measured at a particular T, concentration and (normally 589; the Na D line) • Molar rotation [ ] = [ ] MW 10 -2
Optical rotary dispersion • Concentration of an optically active substance, c’, expressed in g cm-1 (as density of a pure substance) • d’ = thickness of the sample in decimeters • M = molecular weight of the optically active component • the 10 -2 factor is subject to convention and is not always included in [M]
Optical rotary dispersion • M = molecular weight of the optically active component • n. b. the 10 -2 factor is subject to convention and is not always included in [M]
Optical rotary dispersion • ORD curve is a plot of molar rotation [ ] or [M] vs • Clockwise rotation is plotted positively; counterclockwise rotation is plotted negatively • ORD is based solely on the index of refraction • So-called plain curve is the ORD for a chiral compound that lacks a chromophore • Chiral compounds containing a chromophore can give anomalous, or Cotton effect, curves
Cotton Effect • Positive Cotton effect is where the peak is at a higher wavelength than the trough • Negative Cotton effect is the opposite • Optically pure enantiomers always display opposite Cotton effect ORD curves of identical magnitude • Zero crossover point between the peak and the trough closely corresponds to the normal UV max
Circular Polarized Light
Circular Polarized Light
Circular dichroism • Measurement of how an optically active compound absorbs right- and left-handed circularly polarized light • All optically active compounds ex-hibit CD in the region of the appropriate absorption band • CD is plotted as l- r vs • For CD, the resulting transmitted radiation is not planepolarized but elliptically polarized
Circular Dichroism ellipticity l path length through the sample A absorption
Circular dichroism • is therefore the angle between the initial plane of polarization and the major axis of the ellipse of the resultant transmitted light • A quantity is defined such that tan is the ratio of the major and minor axis of the ellipse of the transmitted light • ’ approximates the ellipticity • When expressed in degrees, ’ can be converted to a specific ellipticity [ ] or a molar ellipticity [ ] • CD is usually plotted as [ ]
Linear polarized light can be viewed as a superposition of opposite circular polarized light of equal amplitude and phase different absorption of the left- and right hand polarized component leads to ellipticity (CD) and optical rotation (OR).
Circular Dichroism The difference between the absorption of left and right handed circularly-polarised light and is measured as a function of wavelength. CD is measured as a quantity called mean residue ellipticity, whose units are degrees-cm 2/dmol.
ORD and CD • CD plots are Gaussian rather than S-shaped. • Positive or negative deflections depend on the sign of or [ ] and corresponds to the sign of the Cotton effect • ORD spectra are dispersive (called a Cotton effect for a single band) whereas circular dichroism spectra are absorptive. The two phenomena are related by the socalled König-Kramers transforms. • Maximum of the CD occurs at the absorption max • Where more than one overlapping Cotton effect, the CD may be easier to interpret than the ORD with overlapping S-shaped bands
ORD spectra are dispersive (called a Cotton effect for a single band) whereas circular dichroism spectra are absorptive. The two phenomena are related by the so-called König-Kramers transforms.
Sample Preparation • Additives, buffers and stabilizing compounds: Any compound which absorbs in the region of interest (250 - 190 nm) should be avoided. • A buffer or detergent or other chemical should not be used unless it can be shown that the compound in question will not mask the protein signal.
Sample Preparation • Protein solution: From the above follows that the protein solution should contain only those chemicals necessary to maintain protein stability, and at the lowest concentrations possible. Avoid any chemical that is unnecessary for protein stability/solubility. The protein itself should be as pure as possible, any additional protein or peptide will contribute to the CD signal.
Sample Preparation • Contaminants: Unfolded protein, peptides, particulate matter (scattering particles), anything that adds significant noise (or artifical signal contributions) to the CD spectrum must be avoided. Filtering of the solutions (0. 02 um syringe filters) may improve signal to noise ratio. • Data collection: Initial experiments are useful to establish the best conditions for the "real" experiment. Cells of 0. 5 mm path length offer a good starting point.
Typical Initial Concentrations Protein Concentration: 0. 5 mg/ml Cell Path Length: 0. 5 mm Stabilizers (Metal ions, etc. ): minimum Buffer Concentration : 5 m. M or as low as possible while maintaining protein stability
Circular Dichroism Part II. CD spectra of Nucleocide
Electron Molecular Energy
Chromophores of Nucleic Acid • p p* transitions begin about 300 nm • n p* buried under p p* transitions The intensity of the CD is low because it is a secondary effect of the asymmetric sugar inducing a CD in the chomophoric, but symmetric base.
Chromophores of Nucleic Acid Absorption Spectra CD Spectra
Base Stacking & CD spectra of Nucleic Acid • The benzene-like p-electron systems of the bases make them hydrophobic, so the bases tend to stack in hydrogen bonding solvents to minimize the p-electron surface area exposed to the solvent. • The NH, NH 2 and CO groups are hydrophilic, so the edges of the bases will interact well with hydrogen bonding solvents • For nucleic acids the hydrophobic planes, the hydrophilic edges and charge-charge interactions cause the bases to stack and the polymers to assume a helical structure. • The electronic transitions of the chromophoric bases are in close proximity, and can interact to give CD spectra of high intensity.
Polymorphic properties of Nucleic Acid Polymorphism of nucleic acid in secondary structure Polymorphism • Number of base pairs per turn • Inclination of the base with respect to the helix axis • The distance of the bases from the helix axis • The rise per base-pair • Handedness of the helix CD can measure the change in secondary structure as a function of solvent conditions.
From monomer to polymer Formation of helical structure is a super asymmetry that gives rise to degenerate interactions between chromophoric bases and results in intense CD spectra CD of single stranded oilgo(r. A) in aqueous solution at p. H 7 Polymer dimer monomer
Base-stacked helices in aqueous solution Spectra is Composition dependent CD of single stranded poly(r. A) CD of single stranded poly(r. C)
CD of double-stranded DNA and RNA
CD vs. Absorption Native DNA Denatured Native DNA • CD occurs only where normal absorption occurs • CD is more complicated revealing bands that not separated in the normal absorption spectrum Average spectrum for the four component deoxynucleotides
Structure of DNA A-DNA B-DNA Z-DNA
Discovery of Z-form DNA Pohl and Jovin (1972 JMB, 67, p 375 ) were the first to observe the left-handed Z-form of poly(d. GC)-poly(d. GC), and they did this by using circular dichroism spectroscopy. The Z-form DNA • negative band at 290 • positive band at 260 nm. • crossover about 185 nm Z-form is not the mirror image of the B-form, the blue shift of the 200 nm of the B-form to 185 nm in the Z-form appears to be the trademark of the B to Z transition. A-DNA B-DNA Z-DNA
DNA Secondary Structure & CD Spectra A DNA 260 nm positive 210 nm intense negative 190 nm intense positive A-DNA B DNA 275 nm positive 240 nm negative 258 nm crossover B-DNA
The CD of E. coli DNA in various structure A-DNA 10. 4 B-DNA 10. 2 B-DNA Sprecher et. al. Biopolymer 17, 1009
Solvent Effect on DNA Structure I Calf thymus DNA 10. 4 base pair B-form 0% methanol 25% methanol 50% methanol 65% methanol 75% methanol 95% methanol 10. 2 base pair B-form
Solvent Effect on DNA Structure II 90% methanol Titration with ethanol causes the same changes as with methanol in CD up to 65%. Adding more ethanol causes a change to A form 75% methanol 70% methanol 65% methanol
P Form DNA P-DNA (95% methanol/5 % buffer) 330 C P-DNA (47. 5% methanol/5% buffer/4. 5% ethanol) 80 C B-DNA P-DNA 10. 2 B-DNA (95% methanol/5% 80 C)
Temperature Effect on DNA The CD of poly(d. A) poly(d. T) as a function of temperature 58. 30 C 48. 20 C 44. 70 C 38. 80 C CD is sensitive to the change in conformation when DNA melts with increasing temperature 10 C
Triplex Nucleic Acid 177 Triplex 190 Poly(d. A d. T) 260 210 250 280 Duplex Poly(d. A d. T)
With Mg+2 Intra-molecular triplex Without Mg+2 With Mg+2 Intra-molecular triplex
Influence of the temperature on the parallel triplex 30 C triplex 260 nm 280 nm 660 C duplex 930 C denature
Circular Dichroism Part III. CD spectra of Protein
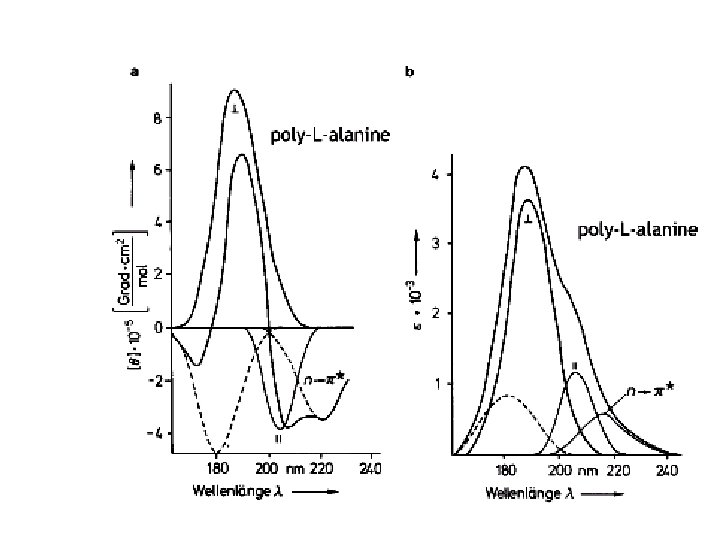
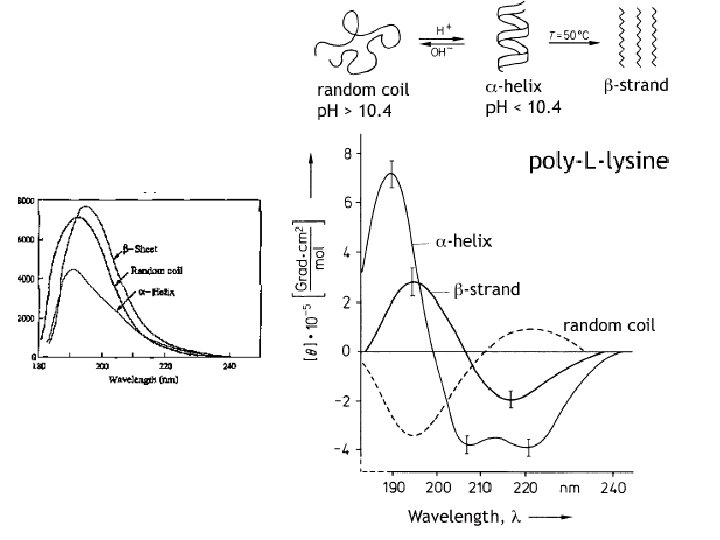
Amide Chromphore • n p* centered around 220 nm • p p* centered around 190 nm n -> p* involves non-bonding electrons of O of the carbonyl; p -> p* involves the p-electrons of the carbonyl
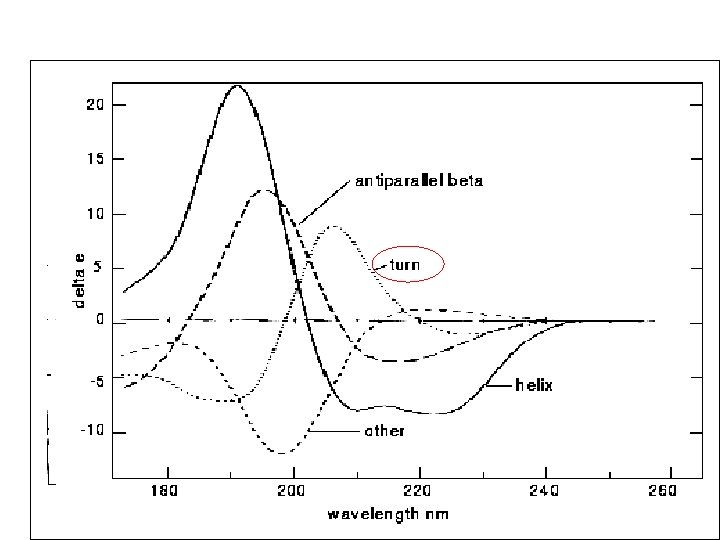
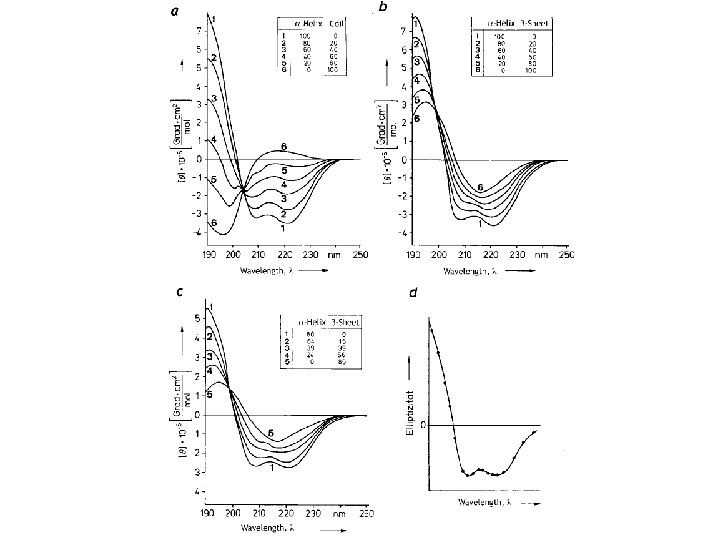
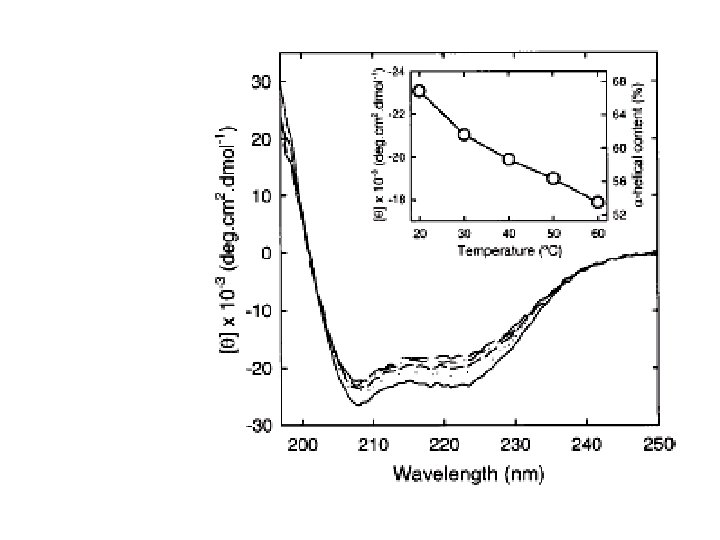
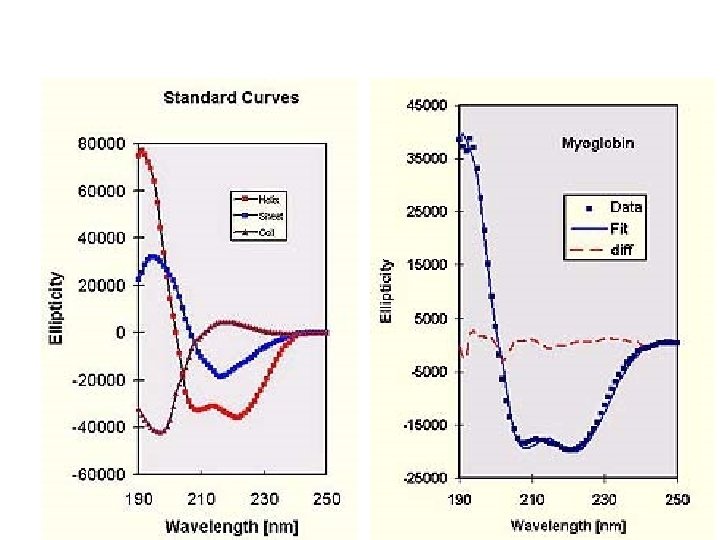
Random coil positive at 212 nm (p->p*) negative at 195 nm (n->p*) b -Sheet negative at 218 nm (p->p*) positive at 196 nm (n->p*) -helix positive (p->p*)perpendicular at 192 nm negative (p->p*)parallel at 209 nm negative at 222 nm is red shifted (n->p*)
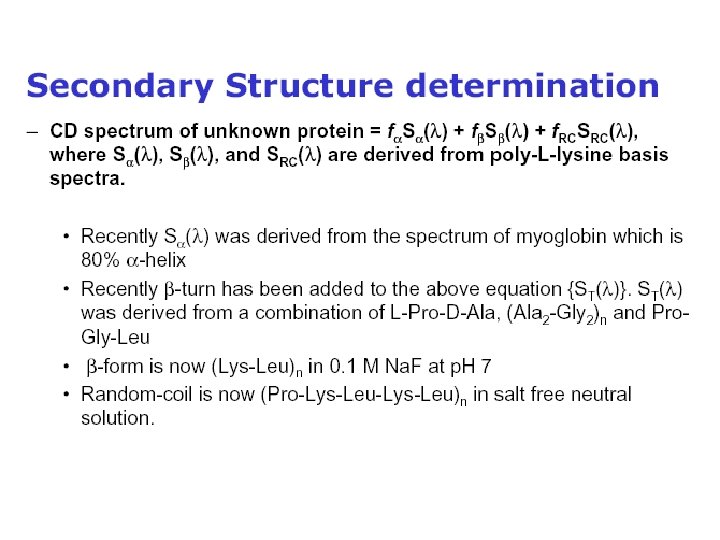
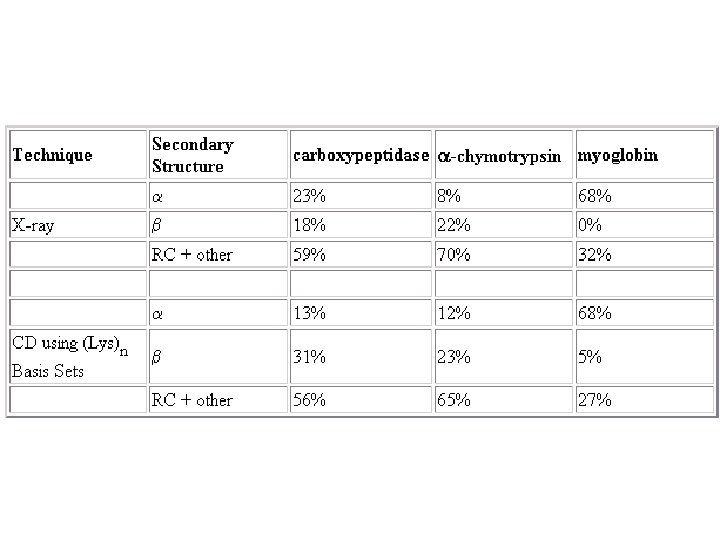
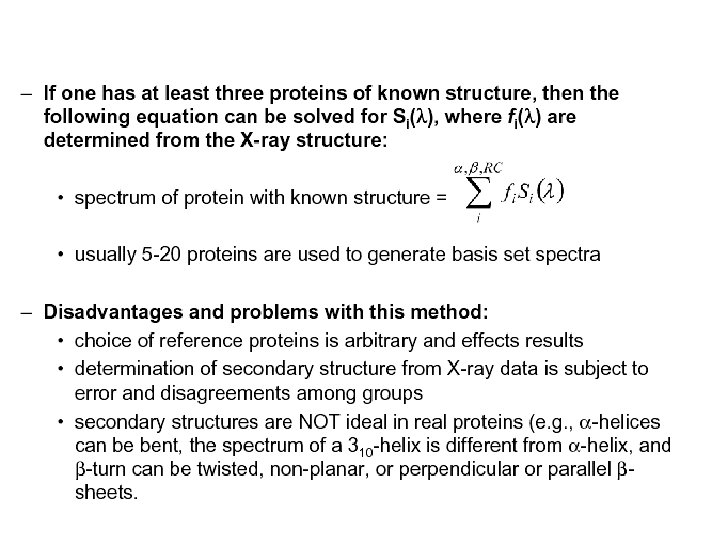
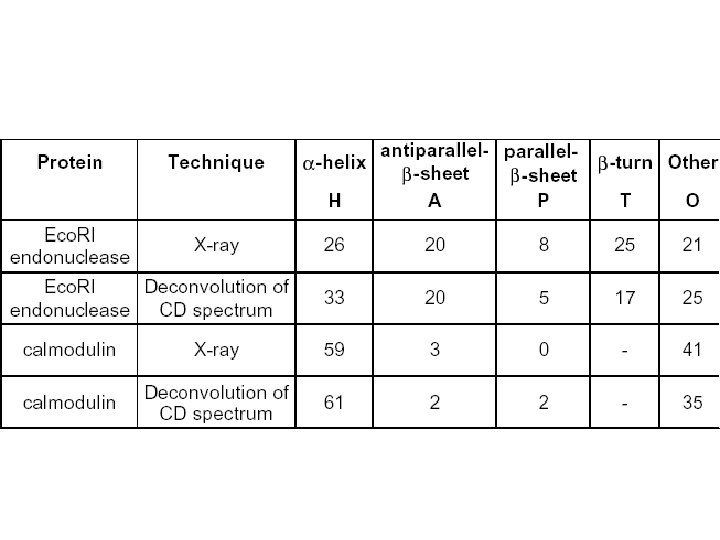
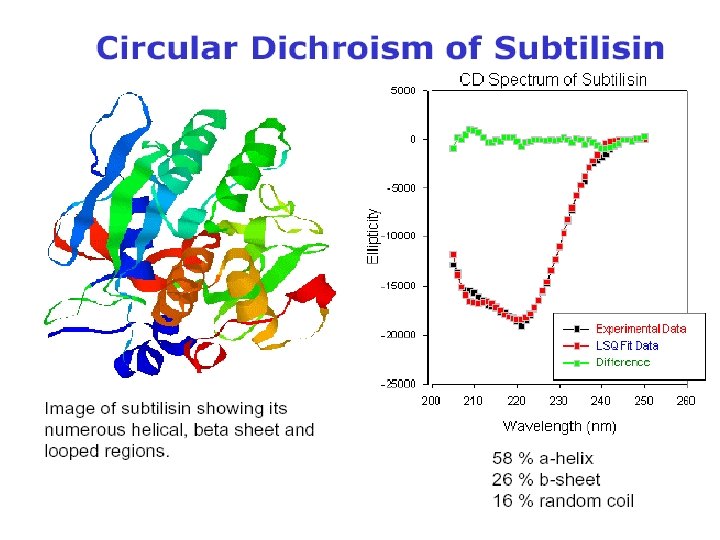
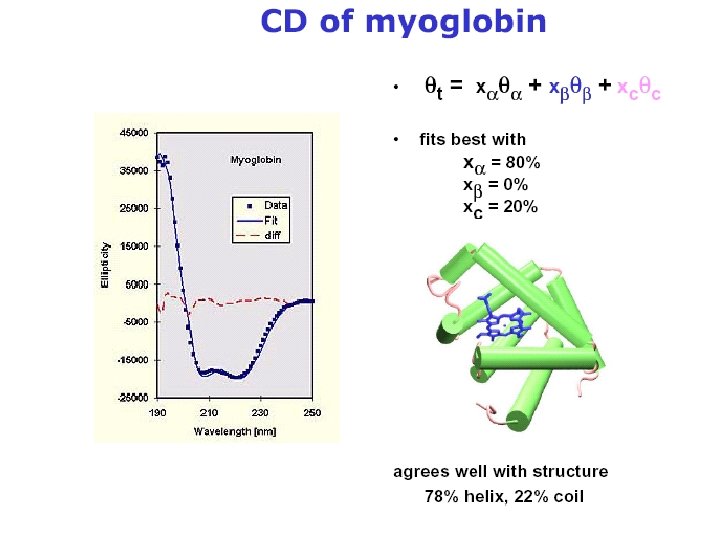
Secondary Structure Determination
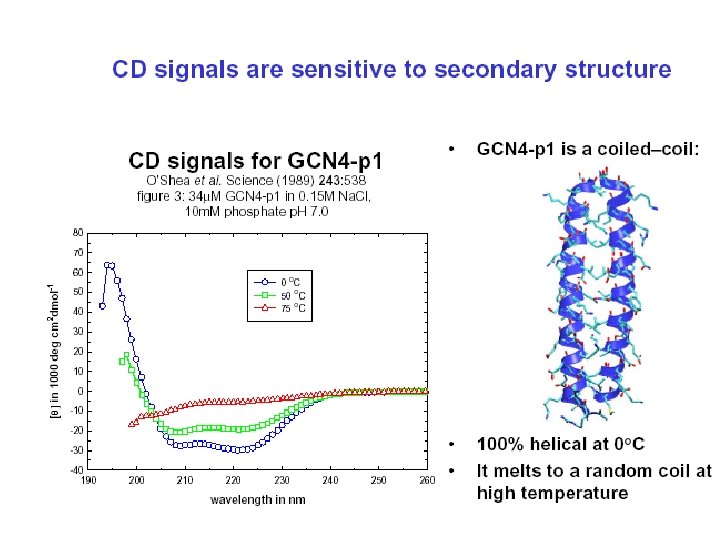
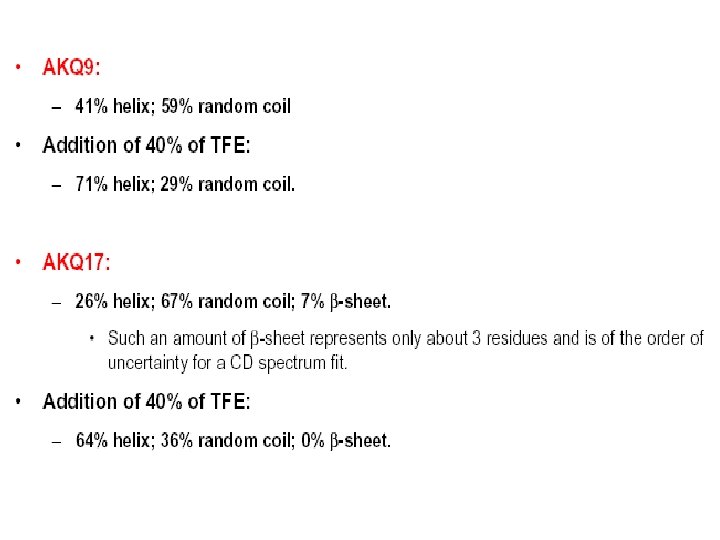
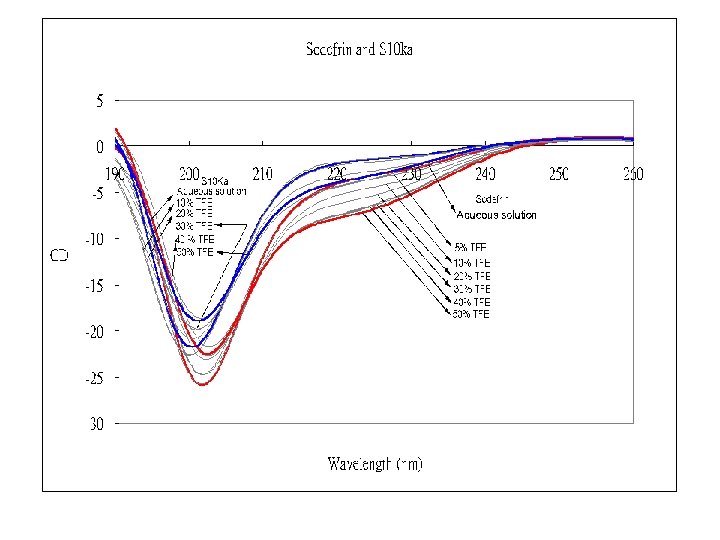
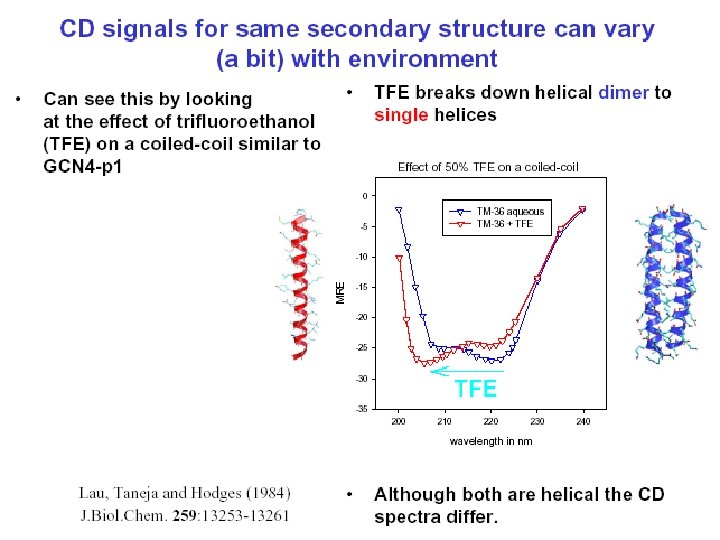
TFE( Trifluroethnol) Induced Helix
Applications of CD in Structural Biology • Determination of secondary structure of proteins that cannot be crystallised • Investigation of the effect of e. g. drug binding on protein secondary structure • Dynamic processes, e. g. protein folding • Studies of the effects of environment on protein structure • Secondary structure and super-secondary structure of membrane proteins • Study of ligand-induced conformational changes • Carbohydrate conformation • Investigations of protein-protein and protein-nucleic acid interactions
Software for the Analysis of Circular Dichroism Data Tools for analyzing circular dichroism data : • LINCOMB and MLR( The method of least squares) LINCOMB • CONTIN (The ridge regression procedure of Provencher and Glöckner) • VARSLC (The Variable Selection Method of Johnson and Coworkers ) • SELCON (The Self-Consistent Method of Sreerama and Woody ) • • • K 2 D. (A neural net analysis program of Andrade et al) CCA (The convex constraint algorithm of Fasman and coworkers ) SVD (Singular Value Decomposition ).
http: //lamar. colostate. edu/~sreeram/CDPro/