Chapter 21 Measuring Vital Signs Copyright 2014 2009
- Slides: 67
Chapter 21 Measuring Vital Signs Copyright © 2014, 2009 by Saunders, an imprint of Elsevier Inc. All rights reserved.
Chapter 21 Lesson 21. 1 Copyright © 2014, 2009 by Saunders, an imprint of Elsevier Inc. All rights reserved.
Lesson Objectives Theory 1) Review the anatomic structures involved in the regulation of the vital signs and describe their functions. 2) Identify the physiologic mechanisms that regulate temperature, heart rate, blood pressure, and respiration. 3) List the factors that affect body temperature. Clinical Practice 1) Measure and record the body temperature of an adult and a child at the oral, rectal, axillary, and tympanic (eardrum) sites using a glass, electronic, or tympanic thermometer. Copyright © 2014, 2009 by Saunders, an imprint of Elsevier Inc. All rights reserved. Slide 3
Five Vital Signs Temperature, pulse, respiration, blood pressure, and pain Vital signs give indications as to the health status of the patient and clues to changes in conditions Ø Knowing age-variable normal values and physiologic regulators is part of the assessment process Ø Accurate measurements are required Ø Copyright © 2014, 2009 by Saunders, an imprint of Elsevier Inc. All rights reserved. Slide 4
Production of Body Heat is a by-product of normal body metabolism As metabolism increases, heat increases When body is invaded by pathogens, the body raises the temperature to elevate the basal metabolic rate (BMR) in an effort to destroy pathogens Copyright © 2014, 2009 by Saunders, an imprint of Elsevier Inc. All rights reserved. Slide 5
Factors Affecting Body Heat Production BMR is affected by thyroid hormone Increased thyroid hormone causes an increase in metabolic rate and increased temperature Decreased levels of thyroid hormone result in a deceased metabolic rate and a decreased body temperature Copyright © 2014, 2009 by Saunders, an imprint of Elsevier Inc. All rights reserved. Slide 6
Factors Affecting Body Heat Production (cont’d) Other hormones affecting metabolic rate Epinephrine Ø Norepinephrine Ø Testosterone Ø Men have a higher BMR than women because of testosterone Voluntary muscle movement causes increased heat production Shivering can increase heat production up to five times normal Copyright © 2014, 2009 by Saunders, an imprint of Elsevier Inc. All rights reserved. Slide 7
Body Temperature Regulation Hypothalamus acts as thermostat to control body temperature Pyrogens may increase thermostat’s set point (pyrexia) Decrease in body temperature results in peripheral vasoconstriction and shivering Increase in body temperature results in peripheral vasodilatation and diaphoresis Copyright © 2014, 2009 by Saunders, an imprint of Elsevier Inc. All rights reserved. Slide 8
Body Temperature Regulation Heat loss occurs with skin’s exposure to the environment through: Radiation Ø Conduction Ø Convection Ø Evaporation • Heat being lost by evaporation results in 800 -m. L loss of Ø water each day Copyright © 2014, 2009 by Saunders, an imprint of Elsevier Inc. All rights reserved. Slide 9
Problems of Temperature Regulation Hyperthermia Temperature is above the normal range Ø Called a fever, a febrile state, or pyrexia Ø Hypothermia Ø Lowering of the temperature of the entire body Copyright © 2014, 2009 by Saunders, an imprint of Elsevier Inc. All rights reserved. Slide 10
Body Temperature Measurements Normal body temperature Ø 97. 5° to 99. 5° F (36. 4° to 37. 5° C) Important to know patient’s usual temperature, then compare changes Temperature measurements vary depending on site used Rectal temperatures about 1° F higher than oral Axillary temperatures about 1° F lower than oral Tympanic membrane measurement approximates core body temperature Copyright © 2014, 2009 by Saunders, an imprint of Elsevier Inc. All rights reserved. Slide 11
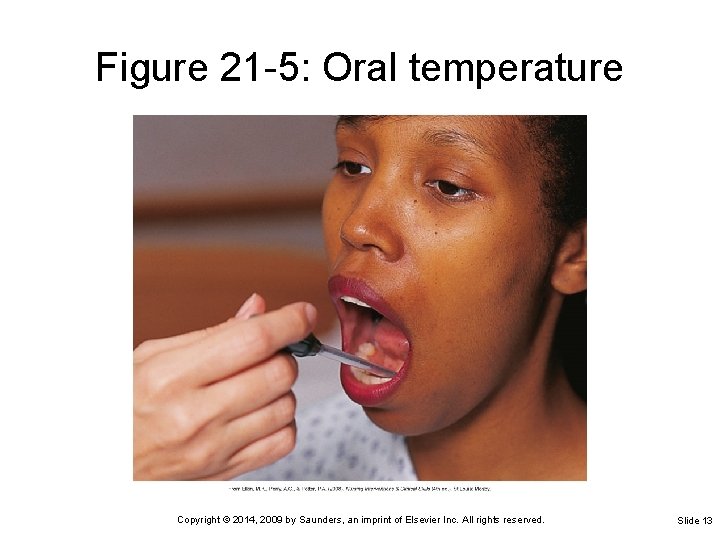
Measuring Body Temperature Taking an oral temperature Place the tip of thermometer or probe in the sublingual pocket Ø Patient should keep the tongue down, close the mouth, and keep the lips closed Ø A plastic sleeve or probe cover is used—remove the plastic sleeve before reading a glass thermometer Ø Copyright © 2014, 2009 by Saunders, an imprint of Elsevier Inc. All rights reserved. Slide 12
Figure 21 -5: Oral temperature Copyright © 2014, 2009 by Saunders, an imprint of Elsevier Inc. All rights reserved. Slide 13
Measuring Body Temperature Taking a rectal temperature Ø Ø Ø Ø Ø Provide privacy Drape the patient to reveal only the anal area Don gloves Lubricate tip of thermometer or probe Hold thermometer in place for 3 to 5 minutes or until the correct temperature is indicated Wipe thermometer or probe from the stem toward the bulb or probe tip Wipe the buttocks to remove lubricant or stool Correctly dispose of tissues and gloves Wash hands Copyright © 2014, 2009 by Saunders, an imprint of Elsevier Inc. All rights reserved. Slide 14
Measuring Body Temperature (cont’d) Taking an axillary temperature Place thermometer in the center of the patient’s dry axilla (armpit) Ø Ask the patient to hold the arm tightly against the chest Ø Leave thermometer in place for 3 to 8 minutes or until thermometer indicates the reading is complete Ø Remove and wipe thermometer clean from the stem to the tip Ø Copyright © 2014, 2009 by Saunders, an imprint of Elsevier Inc. All rights reserved. Slide 15
Types of Thermometers Glass thermometers Ø Should not be used orally in unconscious, confused, or agitated patients Electronic thermometers Tympanic thermometer Ø Temporal artery skin thermometer Ø Disposable thermometers Ø Single-use Copyright © 2014, 2009 by Saunders, an imprint of Elsevier Inc. All rights reserved. Slide 16
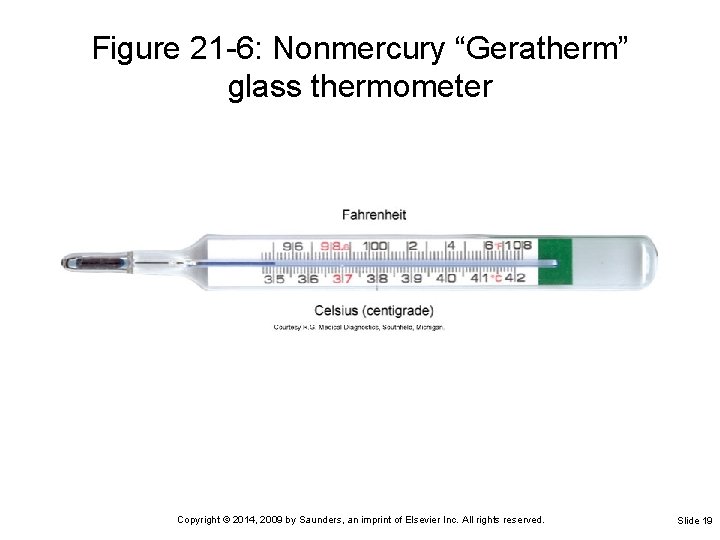
Glass Thermometers Bulb contains an alloy of elements called Galinstan Stem through which the substance can rise Ø Graduated scale representing degrees of temperature from 95° to 107° F Must have the alloy below the normal range before using Ø Accomplished by shaking down the alloy Copyright © 2014, 2009 by Saunders, an imprint of Elsevier Inc. All rights reserved. Slide 17
Reading a Glass Thermometer Hold thermometer horizontally at eye level Rotate it toward you until you can clearly see the column of alloy Note where the end of the alloy is on the lined scale Long lines on the scale represent each degree Short lines between the degree lines represent two-tenths of a degree Copyright © 2014, 2009 by Saunders, an imprint of Elsevier Inc. All rights reserved. Slide 18
Figure 21 -6: Nonmercury “Geratherm” glass thermometer Copyright © 2014, 2009 by Saunders, an imprint of Elsevier Inc. All rights reserved. Slide 19
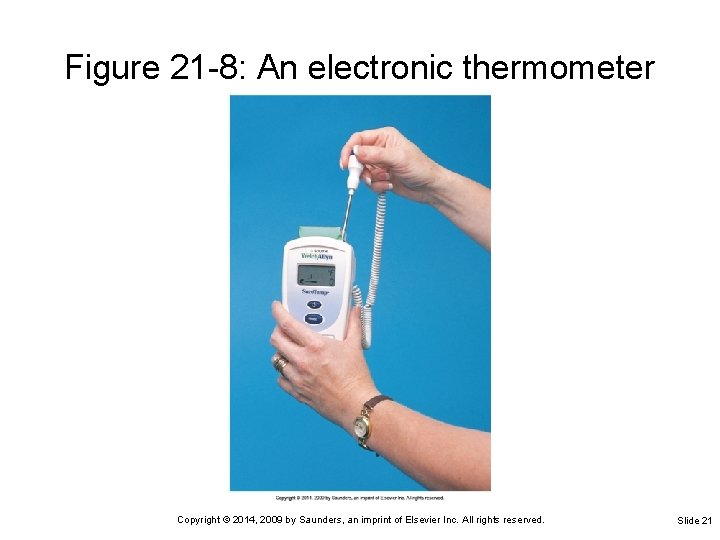
Electronic Thermometer Registers body temperature in 5 seconds to 1 minute Oral probe is placed in a plastic cover or sheath that is used one time and then discarded Temperature is displayed digitally on a small screen Copyright © 2014, 2009 by Saunders, an imprint of Elsevier Inc. All rights reserved. Slide 20
Figure 21 -8: An electronic thermometer Copyright © 2014, 2009 by Saunders, an imprint of Elsevier Inc. All rights reserved. Slide 21
Tympanic Thermometer May be set for infant and toddler or child and adult The auditory canal probe is placed in a plastic cover that is used one time, then discarded Temperature is displayed digitally on a small screen on the handheld unit Reading is in tenths of a degree and can be displayed in degrees Fahrenheit or Celsius Copyright © 2014, 2009 by Saunders, an imprint of Elsevier Inc. All rights reserved. Slide 22
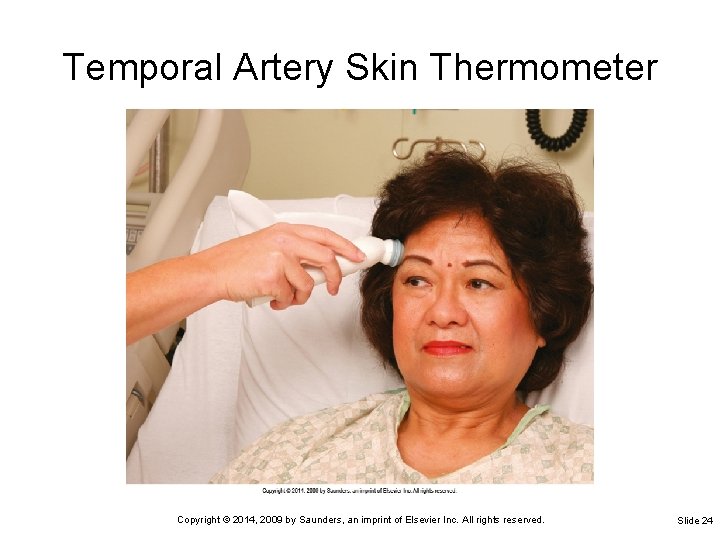
Temporal Artery Skin Thermometer Placed on the skin of the forehead over the temporal artery An electronic thermometer that is fast and accurate Less invasive than the tympanic thermometer and more reliable when used correctly Copyright © 2014, 2009 by Saunders, an imprint of Elsevier Inc. All rights reserved. Slide 23
Temporal Artery Skin Thermometer Copyright © 2014, 2009 by Saunders, an imprint of Elsevier Inc. All rights reserved. Slide 24
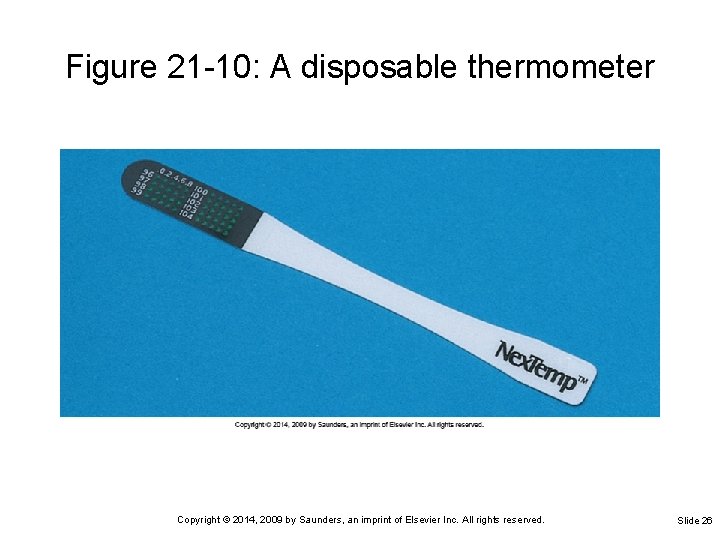
Disposable Thermometer Temperature-sensitive tapes placed on the forehead or abdomen to record heat of the body Tempa-DOT thermometers Most will register the temperature within 2 minutes Provide the least accurate readings of temperature Copyright © 2014, 2009 by Saunders, an imprint of Elsevier Inc. All rights reserved. Slide 25
Figure 21 -10: A disposable thermometer Copyright © 2014, 2009 by Saunders, an imprint of Elsevier Inc. All rights reserved. Slide 26
Body Temperature Measurements Factors affecting temperature measurements Time of day (circadian rhythm) Ø Environmental temperature Ø Age of the patient Ø Physical exercise Ø Menstrual cycle and pregnancy Ø Emotional stress Ø Disease conditions Ø Drugs Ø Eating, drinking, mouth-breathing Ø Copyright © 2014, 2009 by Saunders, an imprint of Elsevier Inc. All rights reserved. Slide 27
Pyrexia Temperature higher than 100. 2° F Pyrexia (fever) occurs when normal regulation mechanisms cannot keep up with heat produced by the body Pyrogens such as bacteria cause increased body temperature Diaphoresis: excessive sweat produced to cool the body Copyright © 2014, 2009 by Saunders, an imprint of Elsevier Inc. All rights reserved. Slide 28
Nursing Interventions to Reduce Fever Increase patient’s fluid intake Lower room temperature Increase the rate of circulating air Remove excessive clothing or bed covers Control or reduce the amount of body activity Provide sponge bath or cooling blanket Antipyretics (ASA, acetaminophen) Copyright © 2014, 2009 by Saunders, an imprint of Elsevier Inc. All rights reserved. Slide 29
Hypothermia Body temperature lower than 94° F People at risk for hypothermia: Infants Ø Surgical patients in the operating room Ø Elderly exposed to cold for prolonged periods Ø People exposed to extreme cold weather Ø People exposed to cold water immersion Ø Copyright © 2014, 2009 by Saunders, an imprint of Elsevier Inc. All rights reserved. Slide 30
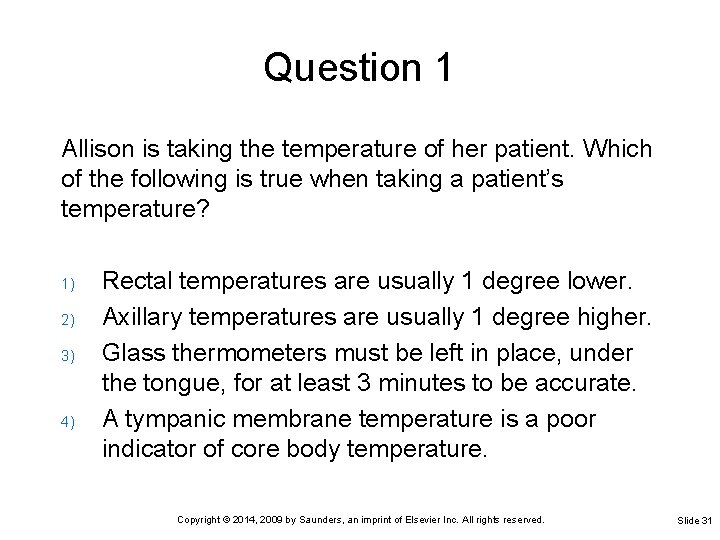
Question 1 Allison is taking the temperature of her patient. Which of the following is true when taking a patient’s temperature? 1) 2) 3) 4) Rectal temperatures are usually 1 degree lower. Axillary temperatures are usually 1 degree higher. Glass thermometers must be left in place, under the tongue, for at least 3 minutes to be accurate. A tympanic membrane temperature is a poor indicator of core body temperature. Copyright © 2014, 2009 by Saunders, an imprint of Elsevier Inc. All rights reserved. Slide 31
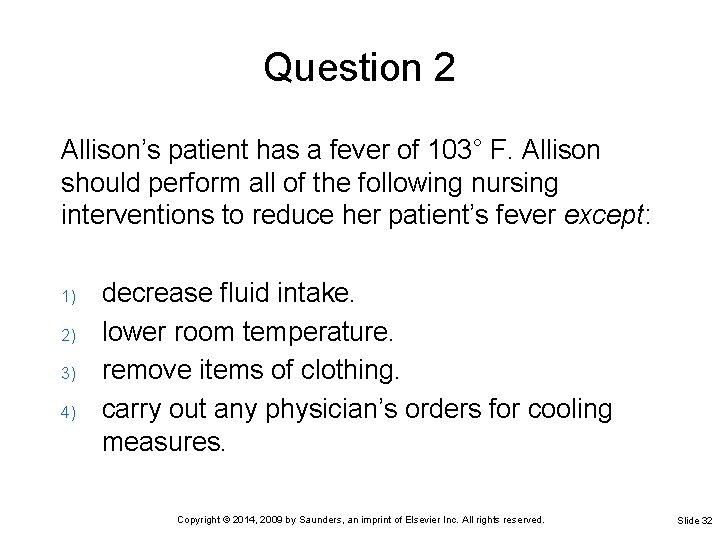
Question 2 Allison’s patient has a fever of 103° F. Allison should perform all of the following nursing interventions to reduce her patient’s fever except: 1) 2) 3) 4) decrease fluid intake. lower room temperature. remove items of clothing. carry out any physician’s orders for cooling measures. Copyright © 2014, 2009 by Saunders, an imprint of Elsevier Inc. All rights reserved. Slide 32
Chapter 21 Lesson 21. 2 Copyright © 2014, 2009 by Saunders, an imprint of Elsevier Inc. All rights reserved.
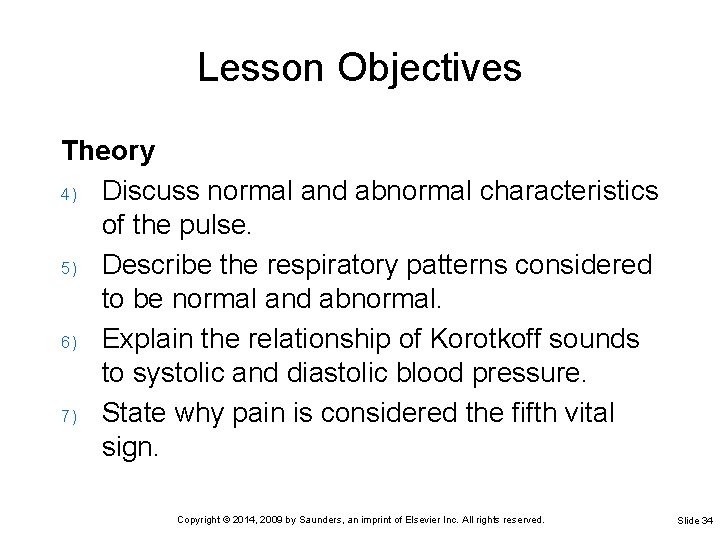
Lesson Objectives Theory 4) Discuss normal and abnormal characteristics of the pulse. 5) Describe the respiratory patterns considered to be normal and abnormal. 6) Explain the relationship of Korotkoff sounds to systolic and diastolic blood pressure. 7) State why pain is considered the fifth vital sign. Copyright © 2014, 2009 by Saunders, an imprint of Elsevier Inc. All rights reserved. Slide 34
Lesson Objectives Clinical Practice 2) Measure and record an apical pulse and a radial pulse. 3) Count and record respirations. 4) Measure and record blood pressure. 5) Use an automatic vital signs machine to monitor pulse and blood pressure. 6) Recognize deviations from normal vital sign patterns. 7) Determine factors that might be adversely affecting the patient’s temperature, pulse, respiration, or blood pressure. Copyright © 2014, 2009 by Saunders, an imprint of Elsevier Inc. All rights reserved. Slide 35
Pulse Produced by cardiac contractions causing a pressure wave against the walls of arteries Cardiac contractions normally initiated by the sinoatrial node Each contraction propels 60 to 70 m. L of blood into the aorta (stroke volume) Stroke volume affects pulse character Stroke volume x heart rate = Cardiac output (approximately 5 L/min for the average adult) Copyright © 2014, 2009 by Saunders, an imprint of Elsevier Inc. All rights reserved. Slide 36
Pulse (cont’d) Normally found by palpation or by auscultation Strength determined by force of cardiac contraction and circulating volume Rate affected by fever, pain, hypoxia, anxiety, exercise, and cardiac disease Rate does not normally change with age, but dysrhythmias are common in the elderly Copyright © 2014, 2009 by Saunders, an imprint of Elsevier Inc. All rights reserved. Slide 37
Pulse Rate Average pulse rate in an adult is 72 bpm Tachycardia Ø Bradycardia Ø Pulse greater than 100 bpm Slow pulse, fewer than 60 bpm Pulse deficit Difference between apical and radial pulse Copyright © 2014, 2009 by Saunders, an imprint of Elsevier Inc. All rights reserved. Slide 38
Pulse Characteristics Rate, rhythm, and volume should be noted Dysrhythmia Ø A period of normal rhythm broken by periods of irregularity or skipped beats Strength of a pulse Ø Ø Ø Ø Weak and regular (even beats with poor force), or 1+ Strong and regular (even beats with moderate force), or 2+ Full and bounding (even beats with strong force), or 3+ Feeble (barely palpable) Irregular (both strong and weak beats occur within 1 minute) Thready (indicates that it is weak and may be irregular) Absent (no pulse palpable or heard on auscultation) Copyright © 2014, 2009 by Saunders, an imprint of Elsevier Inc. All rights reserved. Slide 39
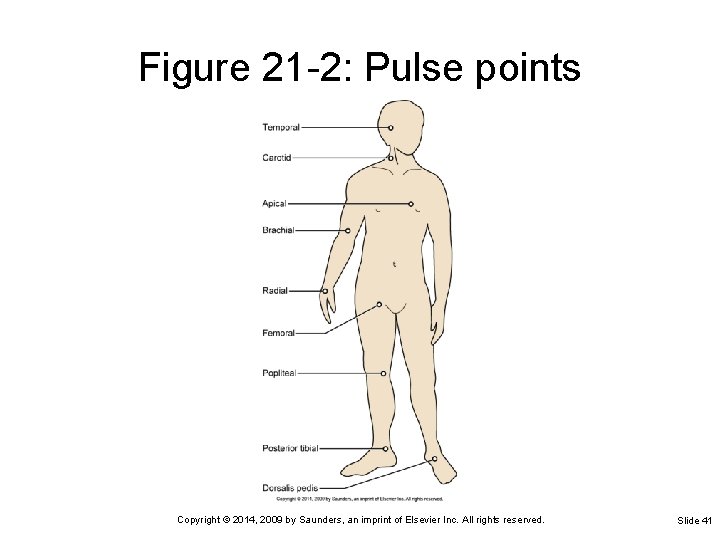
Common Pulse Points Radial artery in the wrist at base of the thumb Temporal artery just in front of the ear Carotid artery on the front side of the neck Femoral artery in the groin Apical pulse over the apex of the heart Popliteal pulse behind the knee Pedal pulse of the posterior tibial artery on the inside of the ankle behind the malleolus Copyright © 2014, 2009 by Saunders, an imprint of Elsevier Inc. All rights reserved. Slide 40
Figure 21 -2: Pulse points Copyright © 2014, 2009 by Saunders, an imprint of Elsevier Inc. All rights reserved. Slide 41
Factors Affecting Pulse Rate Age Body build and size Blood pressure Drugs Emotions Blood loss Exercise Increased body temperature Pain Hypoxia Copyright © 2014, 2009 by Saunders, an imprint of Elsevier Inc. All rights reserved. Slide 42
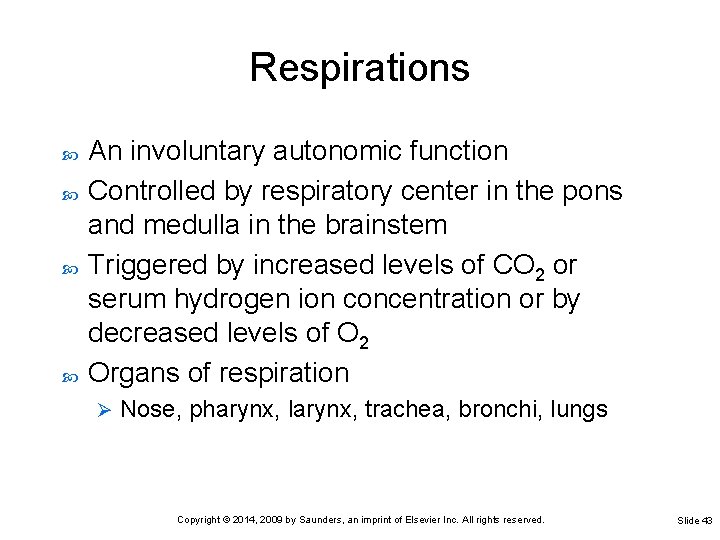
Respirations An involuntary autonomic function Controlled by respiratory center in the pons and medulla in the brainstem Triggered by increased levels of CO 2 or serum hydrogen ion concentration or by decreased levels of O 2 Organs of respiration Ø Nose, pharynx, larynx, trachea, bronchi, lungs Copyright © 2014, 2009 by Saunders, an imprint of Elsevier Inc. All rights reserved. Slide 43
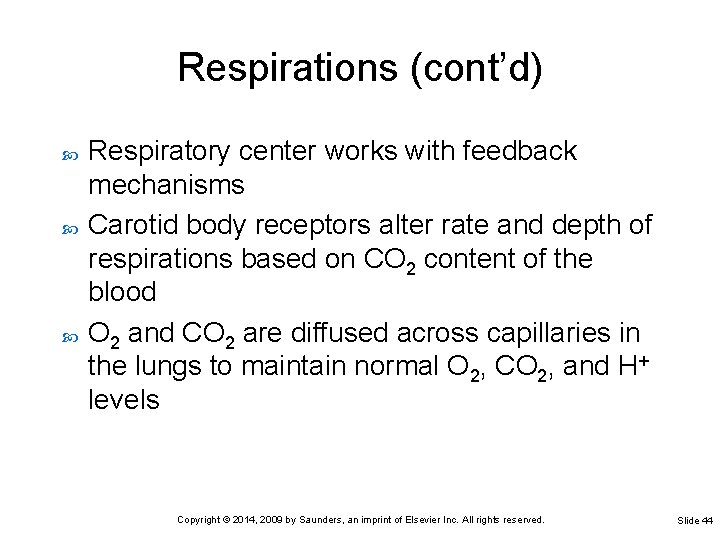
Respirations (cont’d) Respiratory center works with feedback mechanisms Carotid body receptors alter rate and depth of respirations based on CO 2 content of the blood O 2 and CO 2 are diffused across capillaries in the lungs to maintain normal O 2, CO 2, and H+ levels Copyright © 2014, 2009 by Saunders, an imprint of Elsevier Inc. All rights reserved. Slide 44
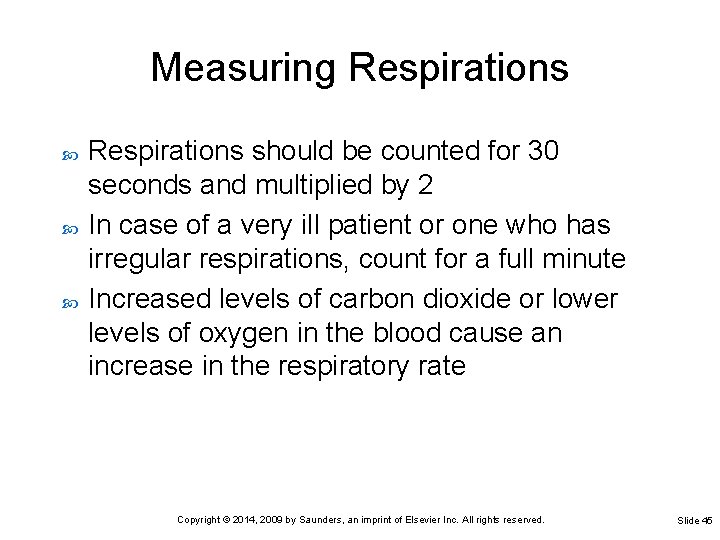
Measuring Respirations should be counted for 30 seconds and multiplied by 2 In case of a very ill patient or one who has irregular respirations, count for a full minute Increased levels of carbon dioxide or lower levels of oxygen in the blood cause an increase in the respiratory rate Copyright © 2014, 2009 by Saunders, an imprint of Elsevier Inc. All rights reserved. Slide 45
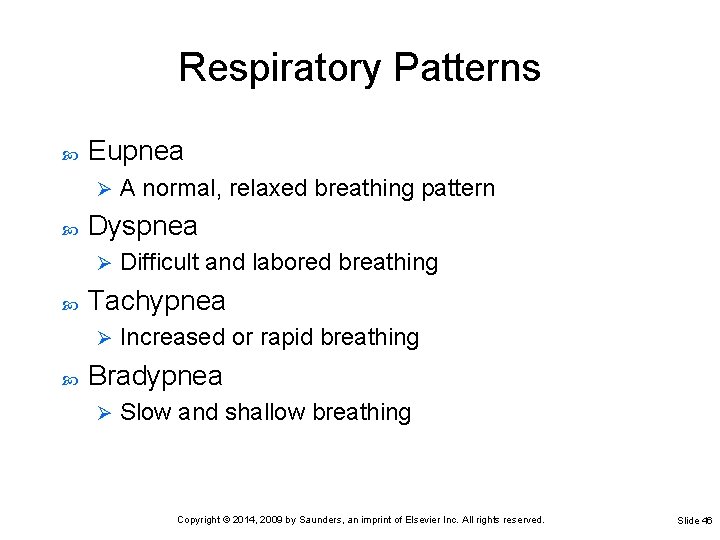
Respiratory Patterns Eupnea Ø Dyspnea Ø Difficult and labored breathing Tachypnea Ø A normal, relaxed breathing pattern Increased or rapid breathing Bradypnea Ø Slow and shallow breathing Copyright © 2014, 2009 by Saunders, an imprint of Elsevier Inc. All rights reserved. Slide 46
Respiratory Patterns (cont’d) Hyperventilation Ø Breathing in which there is an increase in the rate and the depth of breaths Cheyne-Stokes respirations Ø Dyspnea followed by a short period of apnea Kussmaul’s respirations Ø Increased rate and depth with panting and long, grunting exhalation Biot’s respirations Ø Shallow for two or three breaths with a period of variable apnea Copyright © 2014, 2009 by Saunders, an imprint of Elsevier Inc. All rights reserved. Slide 47
Respiratory Patterns: Noisy Respirations Crackles Ø Rhonchi Ø Snoring sound produced when patient unable to cough up secretions from the trachea or bronchi Stridor Ø Continuous dry, rattling sounds heard on auscultation of the lungs caused by partial obstruction Stertor Ø Abnormal, nonmusical sound heard on auscultation of the lungs during inspiration Crowing sound on inspiration caused by obstruction of the upper air passages, as occurs in croup or laryngitis Wheeze Ø Whistling sound of air forced past a partial obstruction Copyright © 2014, 2009 by Saunders, an imprint of Elsevier Inc. All rights reserved. Slide 48
Measuring Oxygen Saturation of Blood Pulse oximeter Machine that measures oxygen in the blood Ø Measures oxygen saturation by determining the percentage of hemoglobin that is bound with oxygen Ø A sensor or probe is attached to an area of the patient’s body through which infrared and red light can reach the capillary bed Ø Copyright © 2014, 2009 by Saunders, an imprint of Elsevier Inc. All rights reserved. Slide 49
Blood Pressure The pressure exerted on arterial walls by pumping action of the heart Affected by condition of vascular bed, circulating blood volume, and cardiac output Changes with aging are normal Copyright © 2014, 2009 by Saunders, an imprint of Elsevier Inc. All rights reserved. Slide 50
Blood Pressure (cont’d) Systolic pressure Ø Diastolic pressure Ø Exerted on the arterial wall during cardiac contraction Exerted on the arterial wall between contractions Blood pressure is affected by cardiac output Blood pressure increases with increases in circulating blood volume Copyright © 2014, 2009 by Saunders, an imprint of Elsevier Inc. All rights reserved. Slide 51
Blood Pressure (cont’d) If blood volume decreases beyond the vascular bed’s ability to compensate, blood pressure may decrease Ø Causes • Dehydration • Hemorrhage Vasoconstriction and vasodilatation alter blood pressure to compensate for changes in circulating volume Copyright © 2014, 2009 by Saunders, an imprint of Elsevier Inc. All rights reserved. Slide 52
Measuring the Blood Pressure The average blood pressure in a healthy young adult is 120/70 mm Hg Ø 120 is the systolic pressure, 70 is the diastolic pressure Anxiety, fear, and stress elevate the blood pressure Take a person’s blood pressure in a quiet room with a relaxed environment Copyright © 2014, 2009 by Saunders, an imprint of Elsevier Inc. All rights reserved. Slide 53
Korotkoff Sounds May be heard related to the effect of the blood pressure cuff on the arterial wall Phase I: tapping Ø Auscultatory gap: no sound Ø Phase II: swishing Ø Phase III: knocking Ø Phase IV: muffling Ø Phase V: silence Ø Copyright © 2014, 2009 by Saunders, an imprint of Elsevier Inc. All rights reserved. Slide 54
Hypertension Pressure consistently above the normal range Systolic pressure above 140 mm Hg and a diastolic pressure above 90 mm Hg are outside the normal range Prolonged hypertension cause permanent damage to the brain, the kidneys, the heart, and the retinas Copyright © 2014, 2009 by Saunders, an imprint of Elsevier Inc. All rights reserved. Slide 55
Hypotension Low blood pressure; less than 90/60 mm Hg Postural hypotension Ø Drop in blood pressure occurring with change from supine to standing or from sitting to standing position Copyright © 2014, 2009 by Saunders, an imprint of Elsevier Inc. All rights reserved. Slide 56
Pain: The Fifth Vital Sign Pain is recognized by The Joint Commission as the fifth vital sign Assessment should include: Location Ø Intensity Ø Character Ø Frequency Ø Duration Ø Standardized pain scale used for assessment Copyright © 2014, 2009 by Saunders, an imprint of Elsevier Inc. All rights reserved. Slide 57
Vital Sign Changes Occurring with Aging Temperature: heat loss may lead to hypothermia in the elderly Lower metabolic rate may result in hypothermia Respiratory rates may vary with decreases in vital capacity Systolic and diastolic blood pressure may rise with hardening of the arteries Copyright © 2014, 2009 by Saunders, an imprint of Elsevier Inc. All rights reserved. Slide 58
Automated Vital Signs Lightweight, portable, automated unit Measure blood pressure and heart rate simultaneously Vital signs are displayed digitally Copyright © 2014, 2009 by Saunders, an imprint of Elsevier Inc. All rights reserved. Slide 59
Charting Vital Signs Should be written down as soon as the measurements are obtained Recorded on the patient’s chart Any unusual or abnormal findings may be written in the nurse’s notes Copyright © 2014, 2009 by Saunders, an imprint of Elsevier Inc. All rights reserved. Slide 60
Recording Temperature Measurements Record in even numbers Do not use odd numbers unless an electronic thermometer was used with measurements accurate to one-tenth of a degree Place a dot on the center of the appropriate line Ø Dot should be at the intersection of the appropriate hour and temperature reading Connect the dots with a straight, accurate line If the temperature is rectal, write above the dot If the temperature is axillary, write above the dot Copyright © 2014, 2009 by Saunders, an imprint of Elsevier Inc. All rights reserved. Slide 61
Recording Pulse Measurements On a graph, each line between the bold lines represents 10 pulse beats Record the pulse on a graph in even numbers Connect the dots with a straight, accurate line when a graph is used Copyright © 2014, 2009 by Saunders, an imprint of Elsevier Inc. All rights reserved. Slide 62
Recording Respiration Measurements Lower portion of graphic sheet used for recording respiratory rate on the sheet or in a table When respiratory rate to be recorded on a graph is one of the numbers indicated on the sheet (such as 20 or 40), place the dot in the center of the appropriate line Otherwise, the dot is centered at the correct vertical distance between two lines Copyright © 2014, 2009 by Saunders, an imprint of Elsevier Inc. All rights reserved. Slide 63
Recording Blood Pressure Measurements Many graphic sheets now contain a section labeled “blood pressure” and provide space for recording the readings Write the systolic pressure above the slanted line and the diastolic pressure below the line Copyright © 2014, 2009 by Saunders, an imprint of Elsevier Inc. All rights reserved. Slide 64
Question 3 Allison is taking her patient’s pulse. Which site is most often used when taking a pulse? 1) 2) 3) 4) Apical pulse Radial artery Carotid pulse Temporal artery Copyright © 2014, 2009 by Saunders, an imprint of Elsevier Inc. All rights reserved. Slide 65
Question 4 Allison’s patient has a heart rate of 54 beats per minute (bpm). This is defined as: 1) 2) 3) 4) tachycardia. bradycardia. arrhythmia. normal. Copyright © 2014, 2009 by Saunders, an imprint of Elsevier Inc. All rights reserved. Slide 66
Question 5 Which is not an appropriate guideline for measuring a blood pressure? 1) 2) 3) 4) Have the patient lie down or sit for 5 minutes. Use the radial artery. The arm should be supported on a surface at the level of the heart. Inflate the cuff to 30 mm Hg above where the pulse disappears with inflation. Obtain systolic and diastolic readings; deflate all the way to zero. Copyright © 2014, 2009 by Saunders, an imprint of Elsevier Inc. All rights reserved. Slide 67