Chapter 13 WEATHER FORECASTING Acquisition of Weather Information


: communication, storage, processing, and display")


- Slides: 26
Chapter 13 WEATHER FORECASTING
Acquisition of Weather Information 10, 000 land-based stations, hundreds of ships and buoys; four times a day, airports hourly Upper level: radiosonde, aircraft, satellites United Nations World Meteorological Organization, 175 countries World Meteorological Centers: Melbourne, Moscow, Washington D. C. NCEP, US NWS ASOS
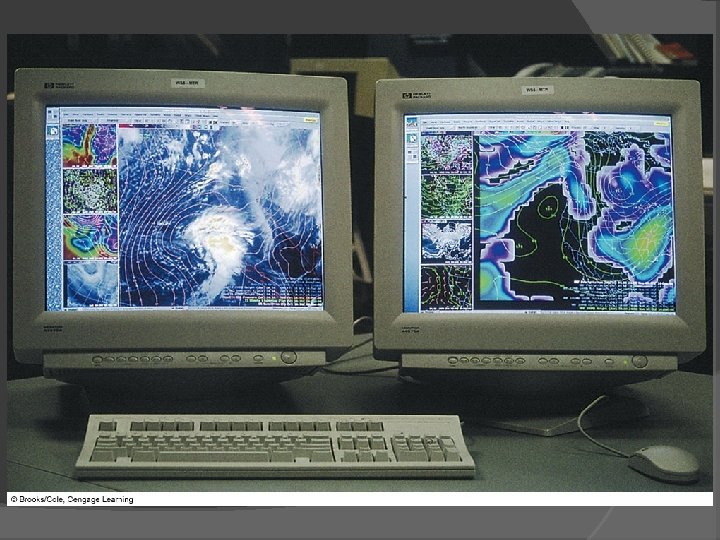
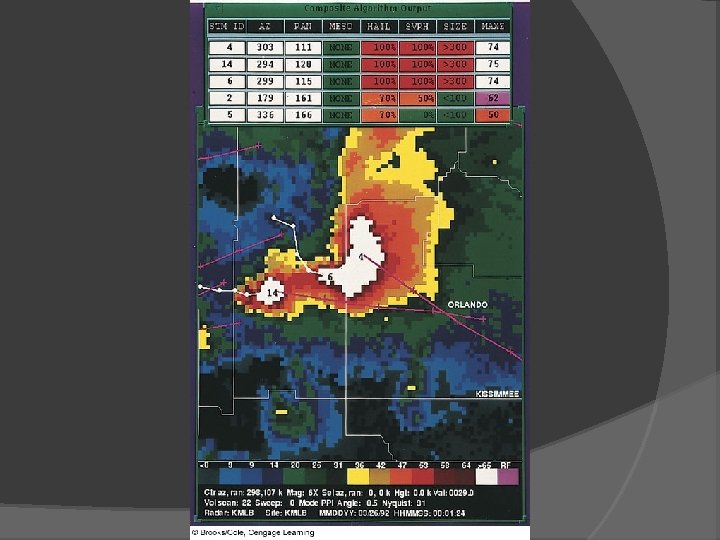
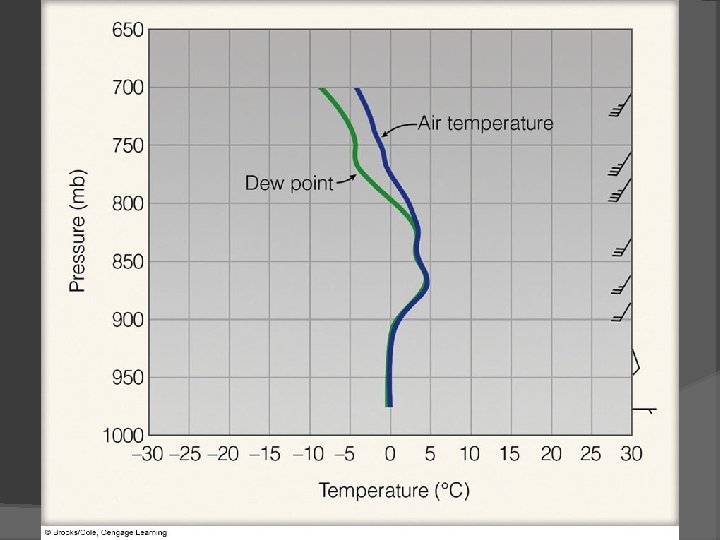
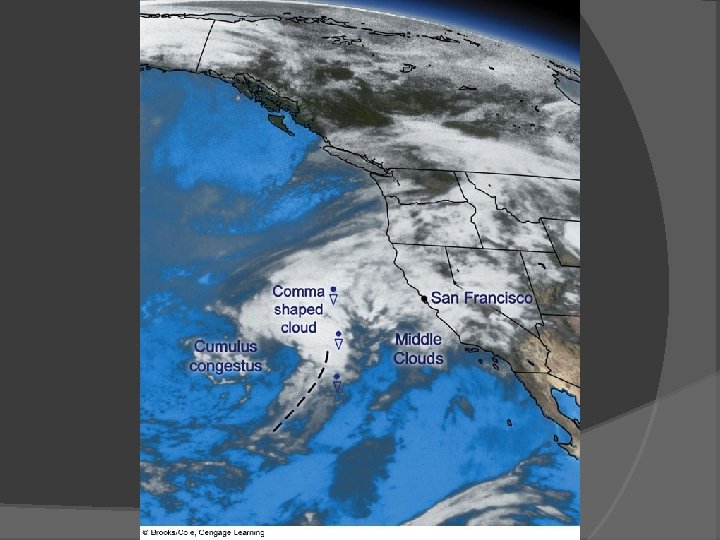
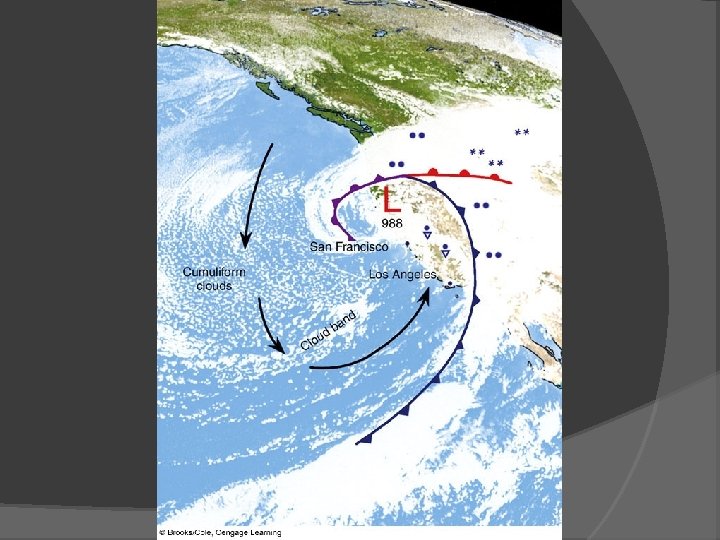
Weather Forecasting Tools High speed data modeling systems (AWIPS): communication, storage, processing, and display Doppler radar Satellite imagery Forecast charts Soundings Wind profiles
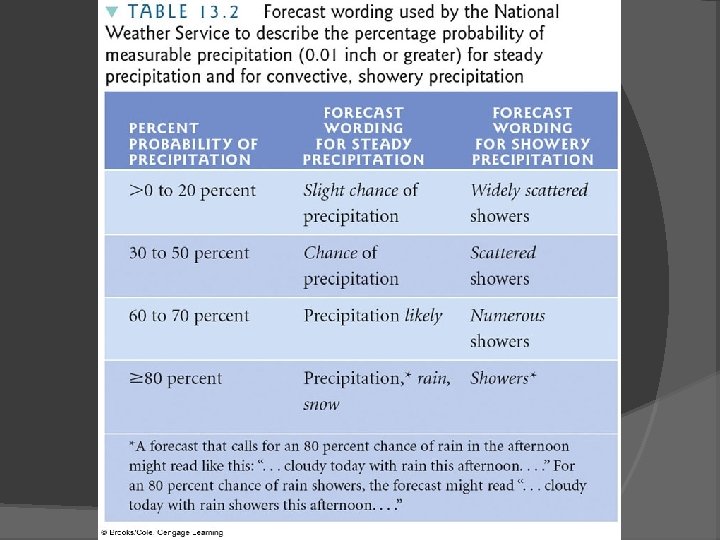
Weather Forecasting Tools Topic: Watches, Warnings, and Advisories: potential hazardous conditions; wind, wind chill, heat, urban and small stream, snow, dense fog Watch: atmospheric conditions favoring hazardous weather over a region in time, actual location and time not known; flash flood, severe thunderstorm, tornado, hurricane Warning: imminent or occurring hazardous weather over a region in time; high wind, heat, flash flood, severe storm, tornado, hurricane, winter storm, blizzard, gale, storm
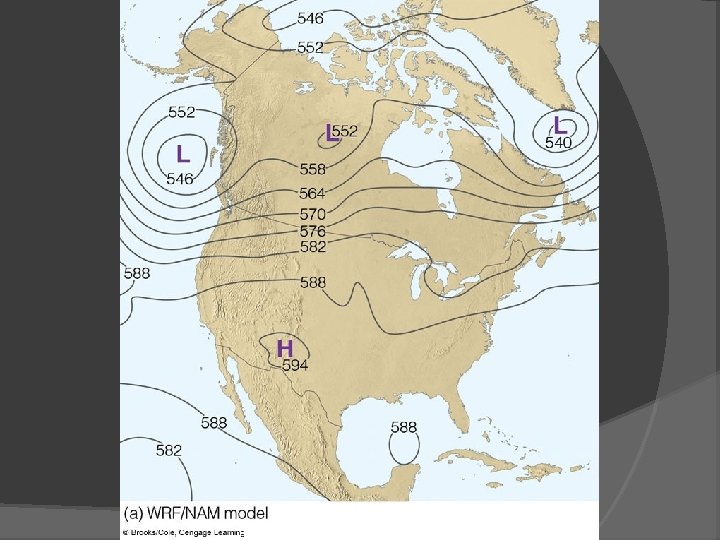
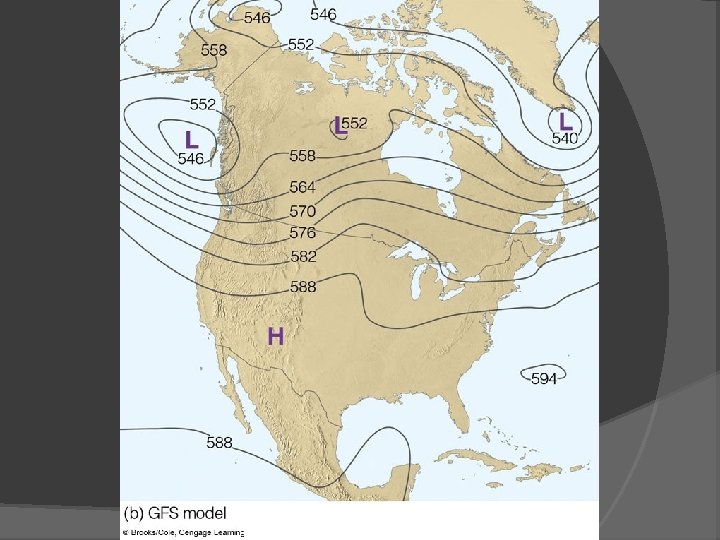
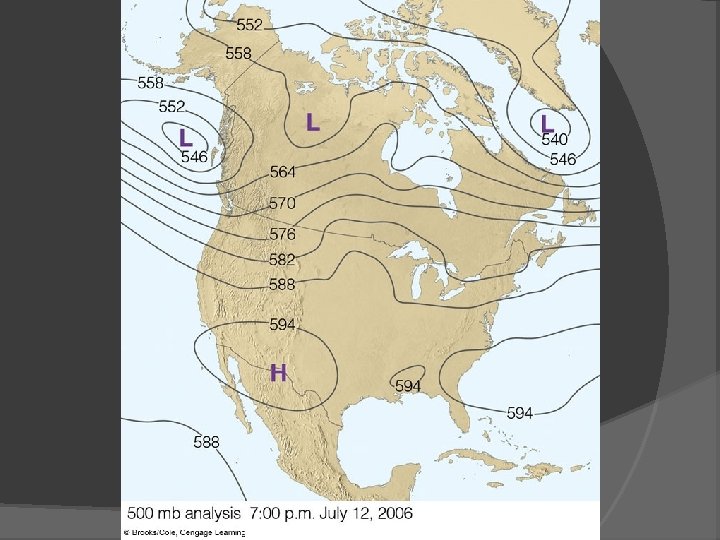
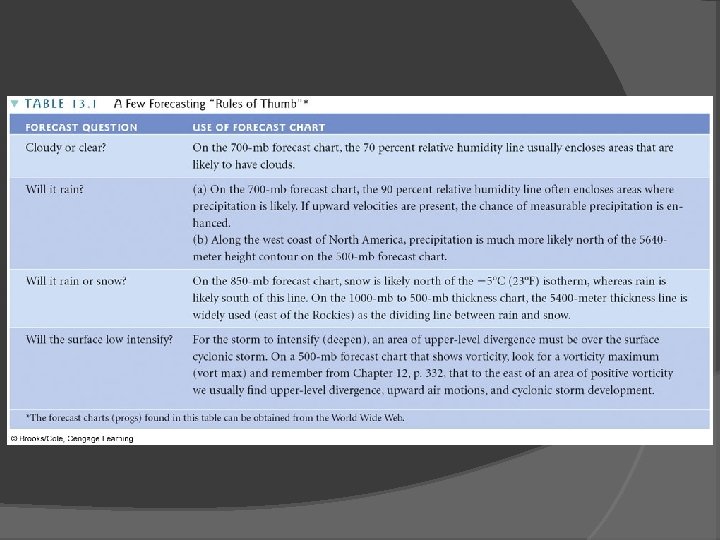
Weather Forecasting Methods 1950 s maps, charts plotted by hand Numerical weather prediction Solves equations using gridded data Final chart called analysis 24 hr forecast for the N Hemisphere requires millions of calculations Resolution Guidance/ rules of thumb
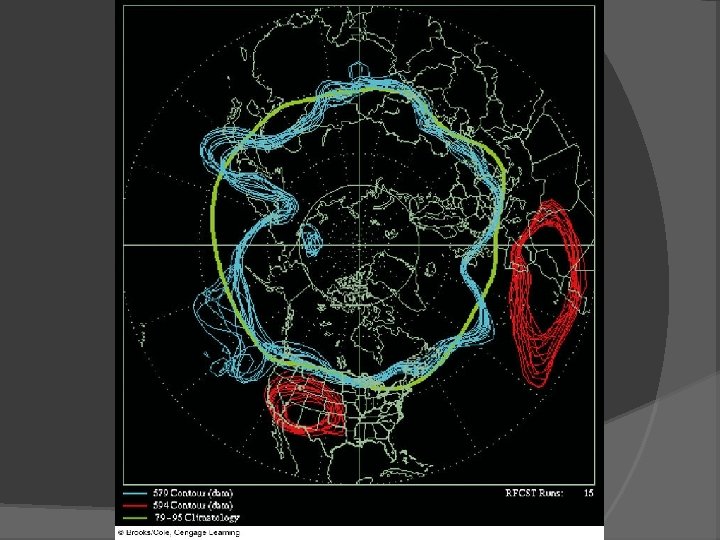
Weather Forecasting Methods Topic: Thickness Charts Difference in height between two constant pressure surfaces (100 mb-500 mb) Higher thickness equals warmer air Why Forecast Go Awry Assumptions Models not global Regions with few observations Cannot model small-scale features All factors cannot be modeled Ensemble Forecasts: Spaghetti model, robust
Weather Forecasting Methods Other Forecasting Techniques Persistence Trend Analogue Statistical Weather type climatological
Weather Forecasting Methods Observation: Weathercasters Chroma key or color separation Types of Forecasts Now cast <6 hrs Short range 12 -65 hrs Medium range 3 -8. 5 days Long Range >8. 5 days Accuracy and Skill 12 -24 hrs most accurate, 2 -5 days good Skill = more accurate than a forecast utilizing persistence of climatology
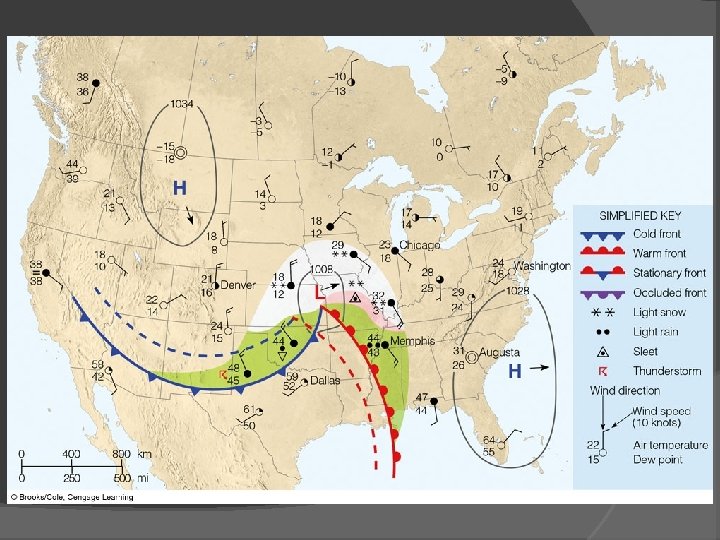
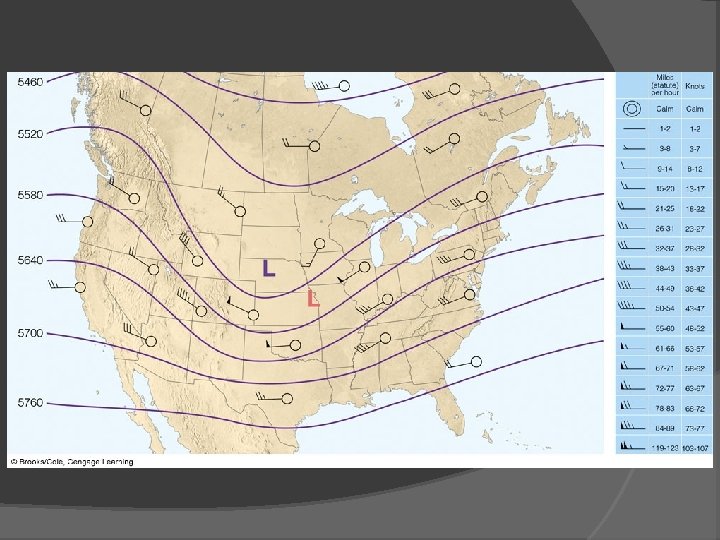
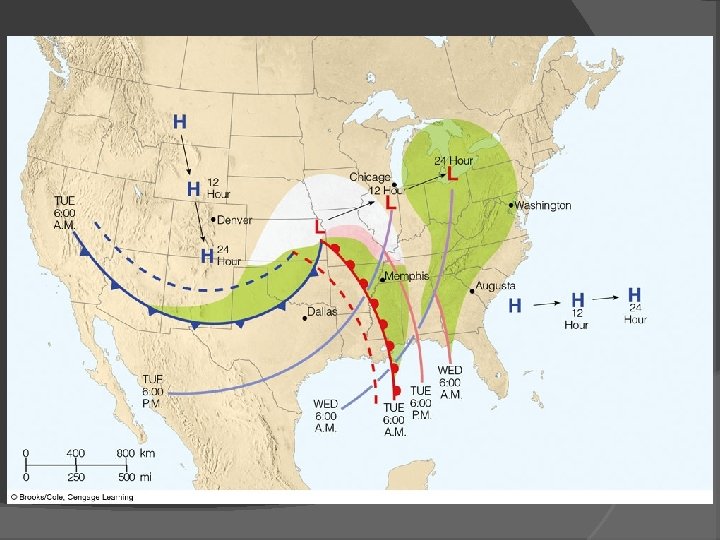
Weather Forecasting Using Surface Charts Observation: Advection Winds that back with height indicate cold advection (counterclockwise) and vice versa Movement of Weather Systems 1. Mid-lat cyclones move in same direction and speed as previous 6 hrs 2. Lows move in direction parallel the isobars in the warm air ahead of the cold front 3. Lows move toward region of greatest pressure drop
Forecasting : Accuracy and skill A persistent forecast or climatological forecast is often accurate. Forcasting a warm sunny day in LA during the summer is often accurate. To show forecast skill the forecaster must do better than either the persistent forecast or climatological forecast. Correctly Forecasting a rainy day during the summer in LA takes skill.
Stepped Art Fig. 13 -15, p. 359