Ch 26 Phylogeny and the Tree of Life


- Slides: 23

Ch. 26 Phylogeny and the Tree of Life

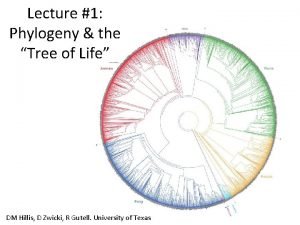
Opening Discussion: Is this basic “tree of life” a fact? If so, why? If not, what is it?


Appreciate the enormous diversity and complexity of life on Earth. There are 1. 8 million named species. . …a fraction of the 10 – 100 million extant species.

Phylogeny = the evolutionary history of a species or group of species Taxon = named taxonomic unit at any level of the hierarchy Write down the hierarchical classification system: What is the binomial nomenclature?

What goes into phylogeny? Systematics data Homologies: ancestry Linnaeus, 1707 - 1778 similarities due to shared

Phylogenetic trees Clade = a group of species that includes an ancestral species and all of its descendants ◦ Monophyletic Group

Monophyletic vs Polyphyletic & Paraphyletic

Phylogenetic trees Node Sister Shared taxa ancestral trait Shared derived trait

A B What are the: Shared Ancestral Traits? Shared Derived Traits? C D

How to tell how to make the tree? Parsimony = logical principle that the most likely explanation is the one that implies the least amount of change (Simplest answer is most likely true)

Genetic & Molecular homologies Biotechnology revolution of late 20 th century has given us new type of homology Universal code: All lifeforms share certain molecular traits e. g. , similarities in hemoglobin molecule

Actual sequence of nucleotides for the "leptin" gene for Mouse, Chimpanzee and Human: First 60 nucleotides: M gaggga tcc ctgctccagc agctgcaagg taaggcccggggcgcgctact ttctcctcca C gtaggaatcg cagcgccagc ggttgcaagg taaggccccg gcgcgctcctccttct H gtaggaatcg cagcgccagc ggttgcaagg taaggccccg gcgcgctcctccttct Nucelotides 121 -180: C: agtcaggaggcagggc ggatggctta gttctggact atgatagctt tgtaccgagt H: agtcaggagg gatgcagggc ggatggctta gttctggact atgatagctt tgtaccgagt (National Center for Biotechnology Information)

Evidence from Molecular Biology When confirm previous conclusions -COHERENCE Can use molecular homologies when other approaches not possible e. g. , similarities in cytochrome c protein

How to tell how to make the tree? Which tree(s) is/are parsimonious and likely? ◦ Maximum Parsimony ◦ Maximum Likelihood

Molecular Clock Method for estimating the time of evolutionary change, based on genes that evolve at constant rates # nucleotide substitutions is proportional to elapsed time since species diverged from common ancestor Compare number of genetic differences with known evolutionary dates from fossil record to calibrate Average rate of genetic change can estimate date of divergence events unknown from fossils

Molecular Clock 4 base pairs different 1 bp changes per 25 million years = 100 million years of evolution occurring between the 2 species (4*25) = 50 million years each 50 my since the common ancestor #bps/rate/2 = time since divergence Diagram: evolution. berkeley. edu

The figure shows an analysis of the evolution of the hemoglobin protein in vertebrates from sharks to humans. The straight line indicates that the evolution has occurred at a constant rate. According to the graph, on average, approximately 18% of amino acids change in hemoglobin per 100 million years. What percentage change per 1 million years?

According to the fossil record, orangutans and African apes diverged 13 million years ago. Based on the average rate shown, calculate the expected percent difference in hemoglobin between orangutans and African apes.

Bonobos and common chimpanzees are the closest extant relative to humans. Given that they only have a 0. 468% difference in hemoglobin amino acid sequence, use the average rate of amino acid changes (from above) to calculate the time since divergence.

Homology vs Homoplasy Convergent evolution: Adaptation by members of different lineages to similar environment Homoplasy = similar analogous structures that arose independently, without shared ancestry

Ocotillo (NA) Allaudia (Madagascar) Homoplasy Ichthyosaur & dolphin

Evolutionary History of Genome Change Homologous Genes: Orthologous genes Paralogous genes
 Phylogeny
 Chapter 20 phylogeny and the tree of life
 Phylogeny and the tree of life chapter 26
 Homologies
 Phylogeny and the tree of life chapter 26
 Chapter 26 phylogeny and the tree of life
 Phenogram vs cladogram
 What is an outgroup in a cladogram
 What is a sister group in phylogeny
 Protochordates and chordates
 Barnacle phylogeny
 Classification system in biology
 Polytomy
 Cladogram animal kingdom
 Phylogeny
 Cladistics
 Phylogeny
 Phylum platyhelminthes
 Metazoan phylogeny
 Anatomy of trout
 Enantiornithes
 Cat family tree
 Consensus sequence in prokaryotes
 Synapomorphy


