
Chapter 20 Phylogeny and the Tree of Life

- Slides: 84
Chapter 20 Phylogeny and the Tree of Life { Power. Point® Lecture Presentations for Biology Eighth Edition 1 Neil Campbell and Jane Reece Lectures by Chris Romero, updated by Erin Barley with contributions from Joan Sharp Copyright©© 2008 Pearson. Education, Inc. , publishingasas. Pearson. Benjamin. Cummings
Overview: Investigating the Tree of Life Phylogeny is the evolutionary history of a species or group of related species The discipline of systematics classifies organisms and determines their evolutionary relationships Systematics use fossil, molecular, and genetic data to infer evolutionary relationships 2 Copyright © 2008 Pearson Education, Inc. , publishing as Pearson Benjamin Cummings
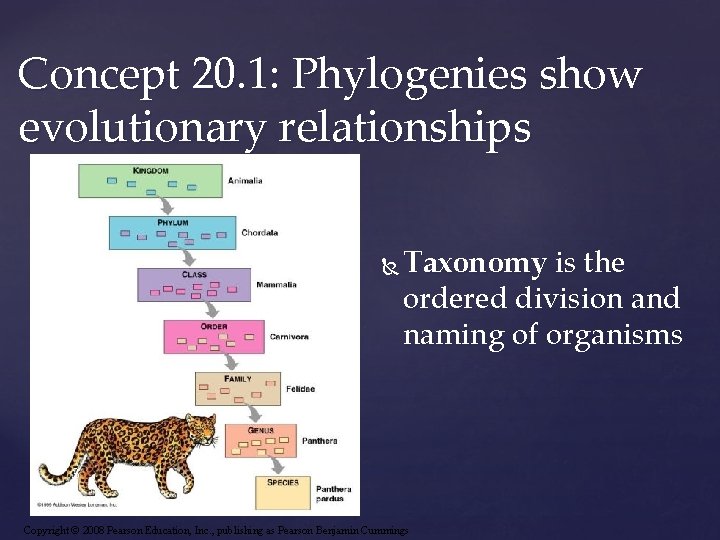
Concept 20. 1: Phylogenies show evolutionary relationships Taxonomy is the ordered division and naming of organisms 3 Copyright © 2008 Pearson Education, Inc. , publishing as Pearson Benjamin Cummings
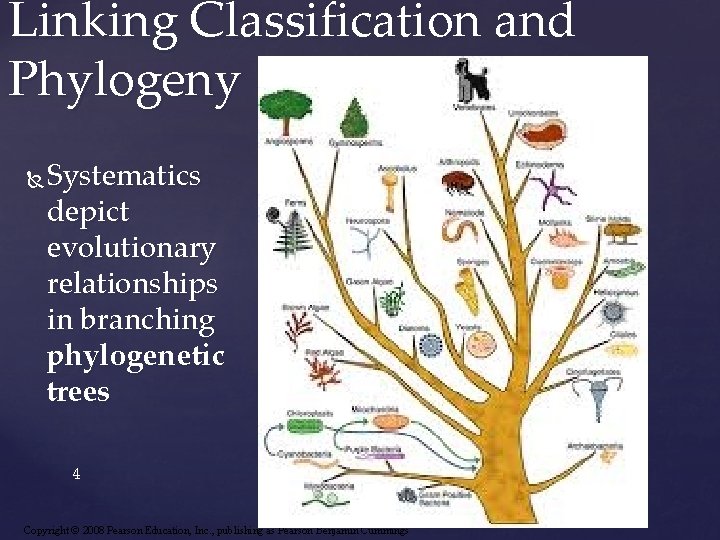
Linking Classification and Phylogeny Systematics depict evolutionary relationships in branching phylogenetic trees 4 Copyright © 2008 Pearson Education, Inc. , publishing as Pearson Benjamin Cummings
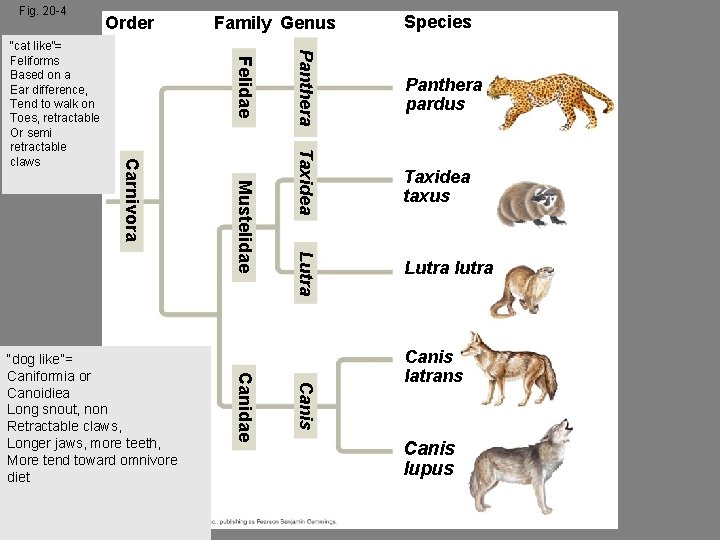
Fig. 20 -4 Family Genus Panthera pardus Taxidea taxus Lutra Mustelidae Lutra lutra Canis Canidae “dog like”= Caniformia or Canoidiea Long snout, non Retractable claws, Longer jaws, more teeth, More tend toward omnivore diet Species Panthera Felidae Carnivora “cat like”= Feliforms Based on a Ear difference, Tend to walk on Toes, retractable Or semi retractable claws Order Canis latrans Canis lupus
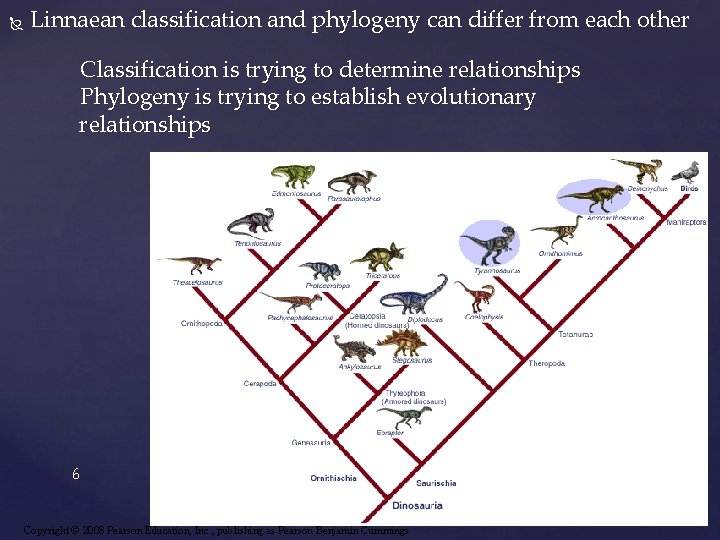
Linnaean classification and phylogeny can differ from each other Classification is trying to determine relationships Phylogeny is trying to establish evolutionary relationships 6 Copyright © 2008 Pearson Education, Inc. , publishing as Pearson Benjamin Cummings
Systematists have proposed the Phylo. Code, which recognizes only groups that include a common ancestor and all its descendents There wouldn’t be ranking any more Fewer groups would exist and be reorganized Like birds, since they are descendents of reptiles birds would be considered a subgroup of reptilian Names wouldn’t change as drastically. 7 Copyright © 2008 Pearson Education, Inc. , publishing as Pearson Benjamin Cummings
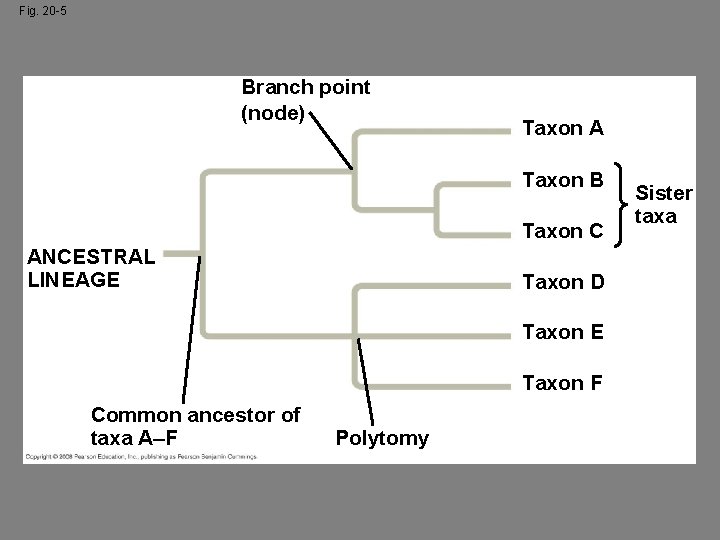
A phylogenetic tree represents a hypothesis about evolutionary relationships Each branch point represents the divergence of two species Sister taxa are groups that share an immediate common ancestor 8 Copyright © 2008 Pearson Education, Inc. , publishing as Pearson Benjamin Cummings
A rooted tree includes a branch to represent the last common ancestor of all taxa in the tree A polytomy is a branch from which more than two groups emerge 9 Copyright © 2008 Pearson Education, Inc. , publishing as Pearson Benjamin Cummings
Fig. 20 -5 Branch point (node) Taxon A Taxon B Taxon C ANCESTRAL LINEAGE Taxon D Taxon E Taxon F Common ancestor of taxa A–F Polytomy Sister taxa
What We Can and Cannot Learn from Phylogenetic Trees Phylogenetic trees do show patterns of descent Phylogenetic trees do not indicate when species evolved or how much genetic change occurred in a lineage (not a time scale) It shouldn’t be assumed that a taxon evolved from the taxon next to it 11 Copyright © 2008 Pearson Education, Inc. , publishing as Pearson Benjamin Cummings
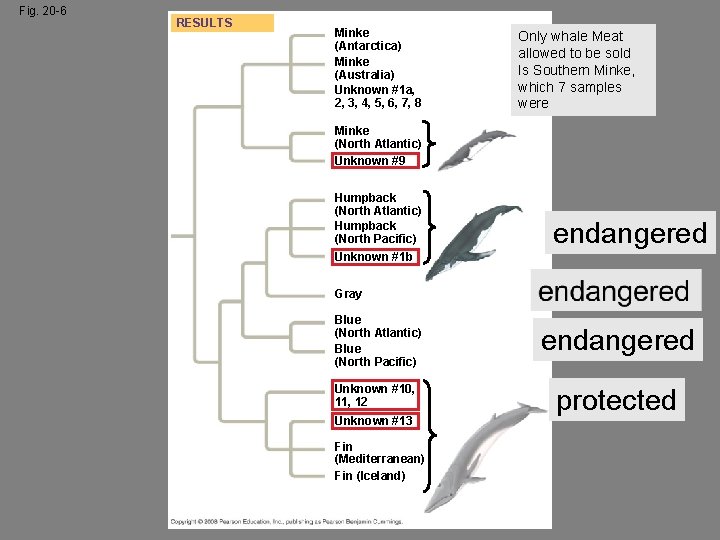
Applying Phylogenies Phylogeny provides important information about similar characteristics in closely related species A phylogeny was used to identify the species of whale from which “whale meat” originated Baker and Palumbi had 13 samples of “whale meat” and sequenced the mitochondrial DNA from each sample and compared their results with the DNA sequences of the known whale types 12 Copyright © 2008 Pearson Education, Inc. , publishing as Pearson Benjamin Cummings
Fig. 20 -6 RESULTS Minke (Antarctica) Minke (Australia) Unknown #1 a, 2, 3, 4, 5, 6, 7, 8 Only whale Meat allowed to be sold Is Southern Minke, which 7 samples were Minke (North Atlantic) Unknown #9 Humpback (North Atlantic) Humpback (North Pacific) Unknown #1 b endangered Gray Blue (North Atlantic) Blue (North Pacific) Unknown #10, 11, 12 Unknown #13 Fin (Mediterranean) Fin (Iceland) endangered protected
Phylogenies of anthrax bacteria helped researchers identify the source of a particular strain of anthrax Compared known strains to unknown strains by analyzing their genomes Compared VNTRs- variable number of tandem repeats Repeats of a DNA sequence If those areas are the same, then same strain and same source Or Compare SNPs- single nucleotide polymorphisms mutations that occur anywhere in the genome 14 Copyright © 2008 Pearson Education, Inc. , publishing as Pearson Benjamin Cummings
Bozeman: Phylogeny 15 Copyright © 2008 Pearson Education, Inc. , publishing as Pearson Benjamin Cummings
Concept 20. 2: Phylogenies are inferred from morphological and molecular data To infer phylogenies, systematists gather information about morphologies Genes biochemistry of living organisms 16 Copyright © 2008 Pearson Education, Inc. , publishing as Pearson Benjamin Cummings
Morphological and Molecular Homologies Organisms with similar morphologies or DNA sequences are likely to be more closely related than organisms with different structures or sequences Remember: the morphology difference could be “great” while the DNA similarity is strong (and vice versa) 17 Copyright © 2008 Pearson Education, Inc. , publishing as Pearson Benjamin Cummings
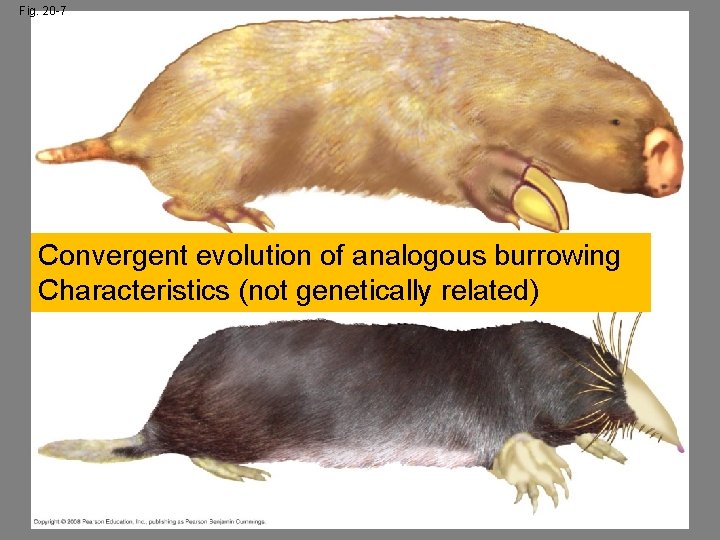
Sorting Homology from Analogy When constructing a phylogeny, systematists need to distinguish whether a similarity is the result of homology or analogy Homology is similarity due to shared ancestry Analogy is similarity due to convergent evolution 18 Copyright © 2008 Pearson Education, Inc. , publishing as Pearson Benjamin Cummings
Fig. 20 -7 Convergent evolution of analogous burrowing Characteristics (not genetically related)
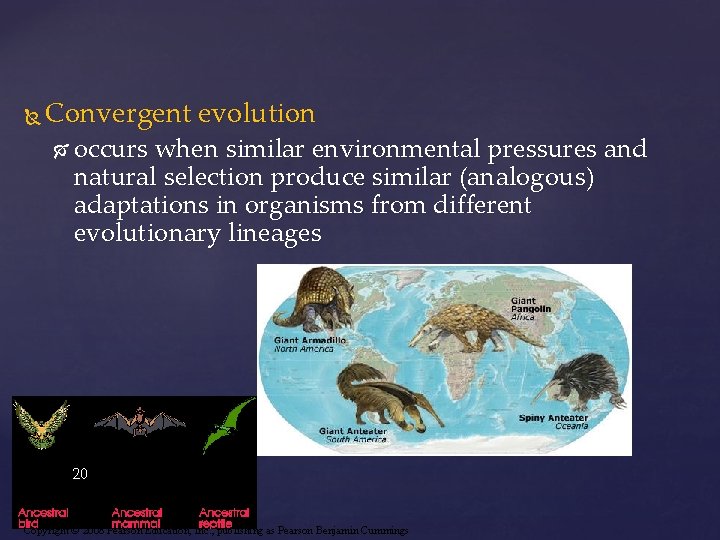
Convergent evolution occurs when similar environmental pressures and natural selection produce similar (analogous) adaptations in organisms from different evolutionary lineages 20 Copyright © 2008 Pearson Education, Inc. , publishing as Pearson Benjamin Cummings
Bat and bird wings are homologous as forelimbs (structurally), but analogous as functional wings (because common ancestor couldn’t fly, but these two are now able due to environmental factors selecting for this trait) Analogous structures or molecular sequences that evolved independently are also called homoplasies 21 Copyright © 2008 Pearson Education, Inc. , publishing as Pearson Benjamin Cummings
Evaluating Molecular Homologies Homology can be distinguished from analogy by comparing fossil evidence and the degree of complexity The more complex two similar structures are, the more likely it is that they are homologous Systematists use computer programs and mathematical tools when analyzing comparable DNA segments from different organisms 22 Copyright © 2008 Pearson Education, Inc. , publishing as Pearson Benjamin Cummings
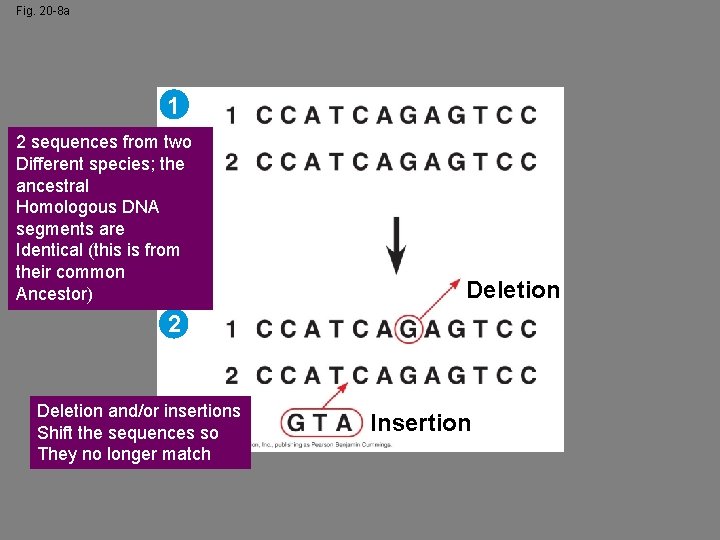
Fig. 20 -8 a 1 2 sequences from two Different species; the ancestral Homologous DNA segments are Identical (this is from their common Ancestor) Deletion 2 Deletion and/or insertions Shift the sequences so They no longer match Insertion
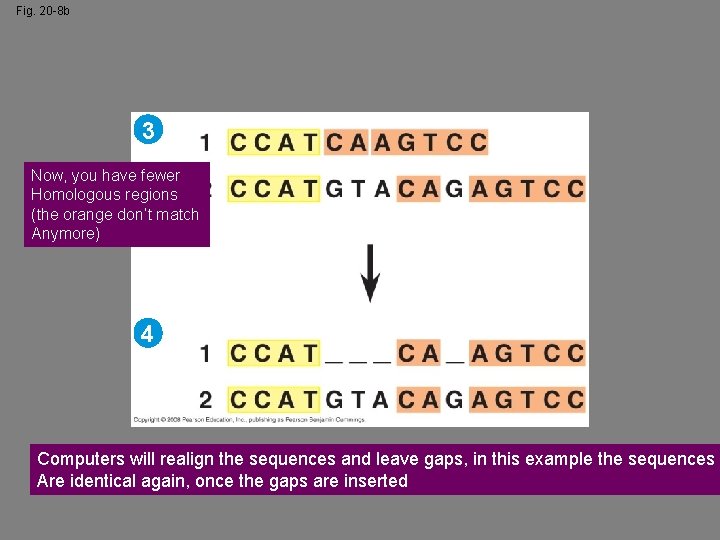
Fig. 20 -8 b 3 Now, you have fewer Homologous regions (the orange don’t match Anymore) 4 Computers will realign the sequences and leave gaps, in this example the sequences Are identical again, once the gaps are inserted
It is also important to distinguish homology from analogy in molecular similarities Mathematical tools help to identify molecular homoplasies, or coincidences Molecular systematics uses DNA and other molecular data to determine evolutionary relationships 25 Copyright © 2008 Pearson Education, Inc. , publishing as Pearson Benjamin Cummings
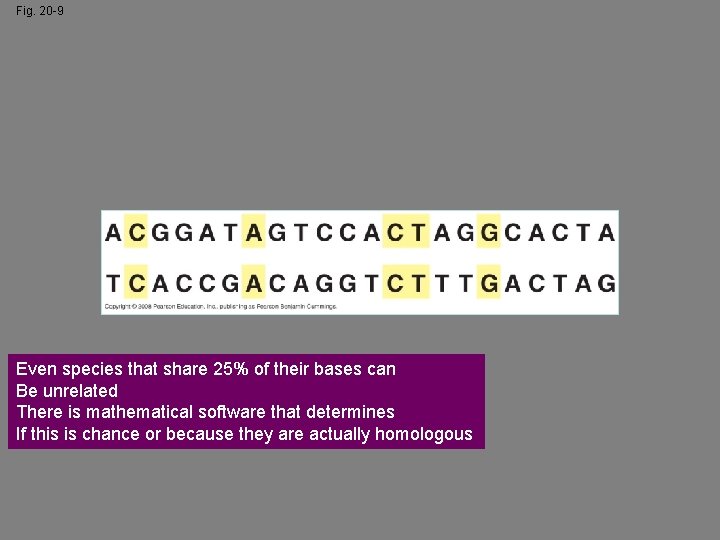
Fig. 20 -9 Even species that share 25% of their bases can Be unrelated There is mathematical software that determines If this is chance or because they are actually homologous
Concept 20. 3: Shared characters are used to construct phylogenetic trees Once homologous characters have been identified, they can be used to infer a phylogeny (these characters are the ones that reflect evolutionary history) 27 Copyright © 2008 Pearson Education, Inc. , publishing as Pearson Benjamin Cummings
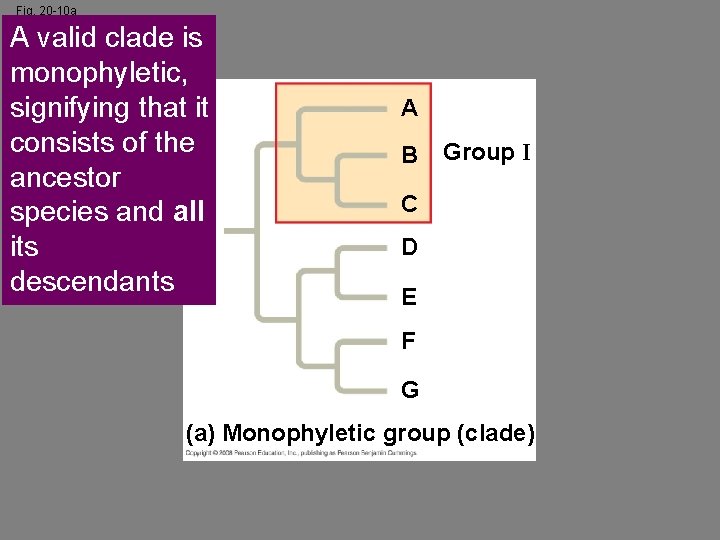
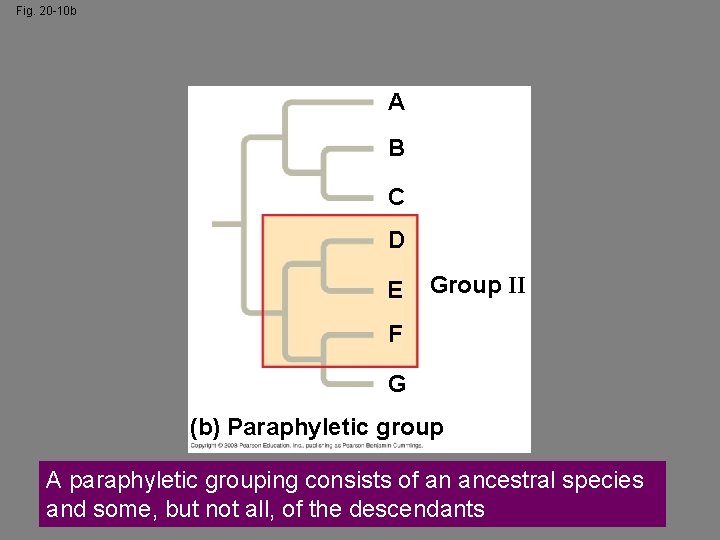
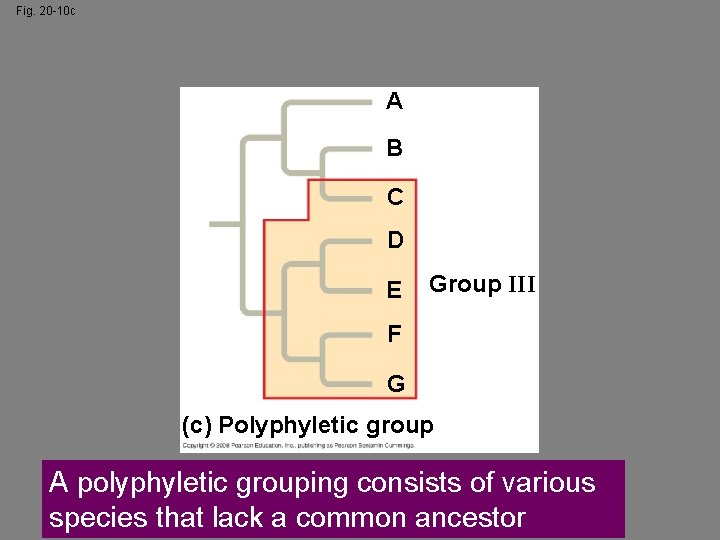
Cladistics groups organisms by common descent A clade is a group of species that includes an ancestral species and all its descendants Clades can be nested in larger clades, but not all groupings of organisms qualify as clades 28 Copyright © 2008 Pearson Education, Inc. , publishing as Pearson Benjamin Cummings
Fig. 20 -10 a A valid clade is monophyletic, signifying that it consists of the ancestor species and all its descendants A B Group I C D E F G (a) Monophyletic group (clade)
Fig. 20 -10 b A B C D E Group II F G (b) Paraphyletic group A paraphyletic grouping consists of an ancestral species and some, but not all, of the descendants
Fig. 20 -10 c A B C D E Group III F G (c) Polyphyletic group A polyphyletic grouping consists of various species that lack a common ancestor
Shared Ancestral and Shared Derived Characters In comparison with its ancestor, an organism has both shared and different characteristics 32 Copyright © 2008 Pearson Education, Inc. , publishing as Pearson Benjamin Cummings
A shared ancestral character is a character that originated in an ancestor of the taxon Like the backbone of all vertebrates; this isn’t unique to just mammals A shared derived character is an evolutionary novelty unique to a particular clade Like hair on mammals (even dolphins and whales have hair on their faces or lose their hair after birth!) A character can be both ancestral and derived, depending on the context (basically, where you are starting your investigation of a trait) 33 Copyright © 2008 Pearson Education, Inc. , publishing as Pearson Benjamin Cummings
Inferring Phylogenies Using Derived Characters Shared derived characters are unique to particular clades. When inferring evolutionary relationships, it is useful to know in which clade a shared derived character first appeared 34 Copyright © 2008 Pearson Education, Inc. , publishing as Pearson Benjamin Cummings
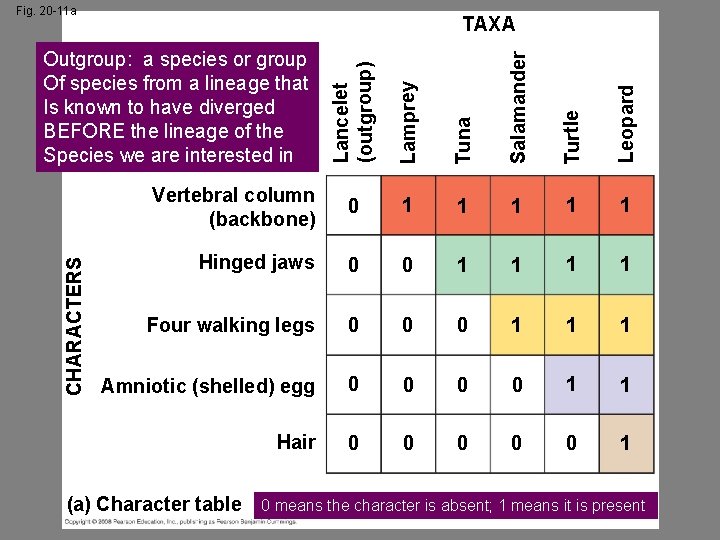
Fig. 20 -11 a TAXA Lancelet (outgroup) Lamprey Tuna Salamander Turtle Leopard CHARACTERS Outgroup: a species or group Of species from a lineage that Is known to have diverged BEFORE the lineage of the Species we are interested in Vertebral column (backbone) 0 1 1 1 Hinged jaws 0 0 1 1 Four walking legs 0 0 0 1 1 1 Amniotic (shelled) egg 0 0 1 1 Hair 0 0 0 1 (a) Character table 0 means the character is absent; 1 means it is present
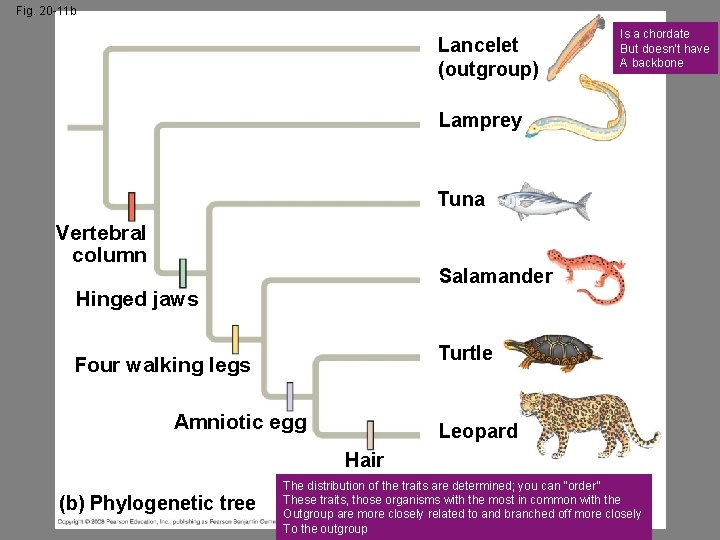
Fig. 20 -11 b Lancelet (outgroup) Is a chordate But doesn’t have A backbone Lamprey Tuna Vertebral column Salamander Hinged jaws Turtle Four walking legs Amniotic egg Leopard Hair (b) Phylogenetic tree The distribution of the traits are determined; you can “order” These traits, those organisms with the most in common with the Outgroup are more closely related to and branched off more closely To the outgroup
Homologies shared by the outgroup and ingroup are ancestral characters that predate the divergence of both groups from a common ancestor Ie. The common traits between the in/out groups are there because they appeared BEFORE the groups separated 37 Copyright © 2008 Pearson Education, Inc. , publishing as Pearson Benjamin Cummings
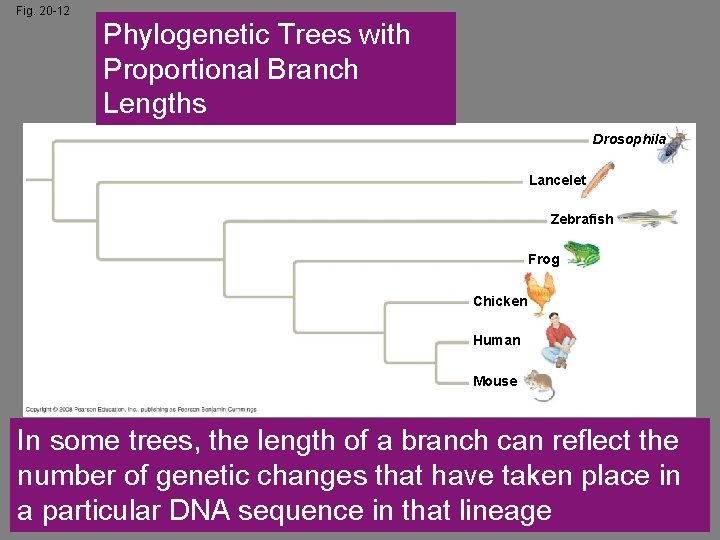
Fig. 20 -12 Phylogenetic Trees with Proportional Branch Lengths Drosophila Lancelet Zebrafish Frog Chicken Human Mouse In some trees, the length of a branch can reflect the number of genetic changes that have taken place in a particular DNA sequence in that lineage
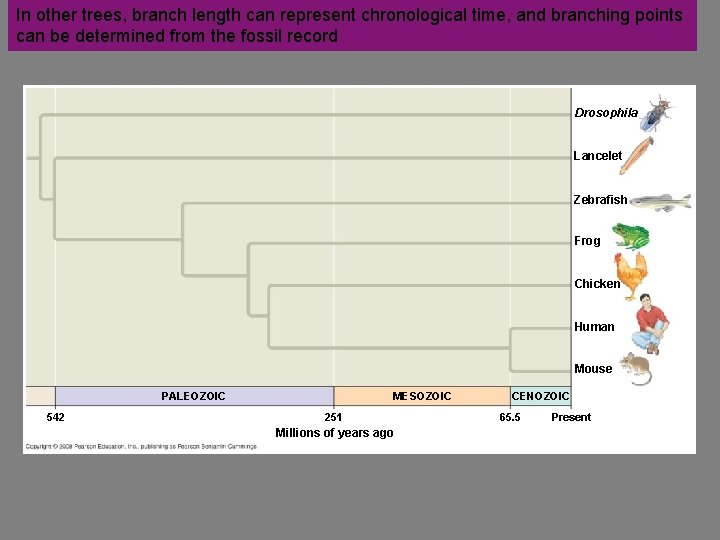
Fig. 20 -13 In other trees, branch length can represent chronological time, and branching points can be determined from the fossil record Drosophila Lancelet Zebrafish Frog Chicken Human Mouse PALEOZOIC 542 MESOZOIC 251 Millions of years ago CENOZOIC 65. 5 Present
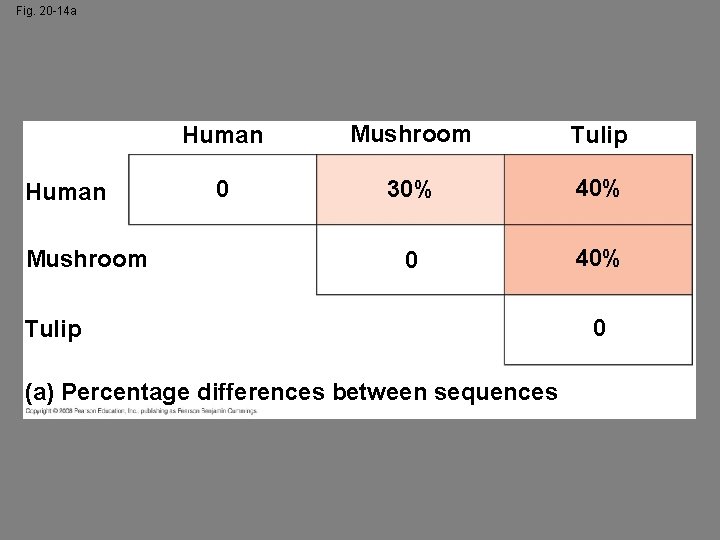
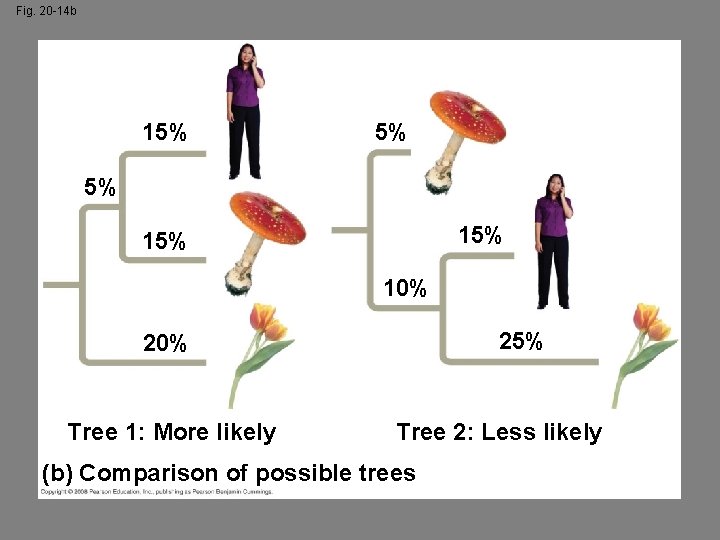
Maximum Parsimony (Occam’s razor) and Maximum Likelihood Systematists can never be sure of finding the best tree in a large data set They narrow possibilities by applying the principles of maximum parsimony and maximum likelihood 40 Copyright © 2008 Pearson Education, Inc. , publishing as Pearson Benjamin Cummings
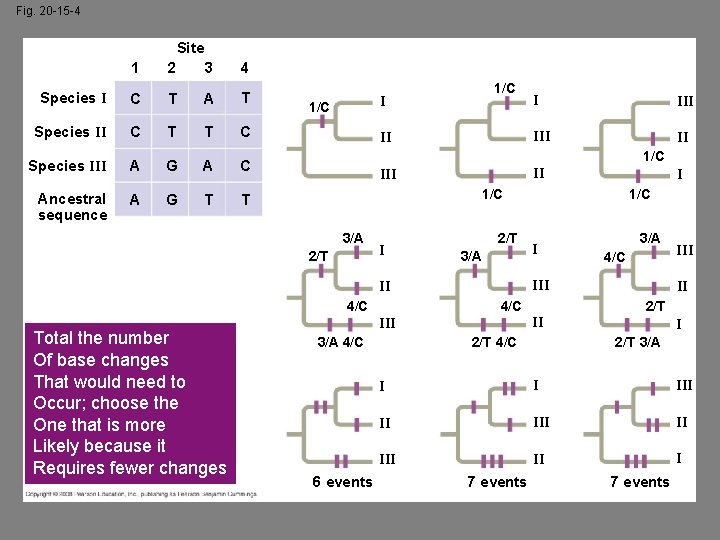
Maximum parsimony assumes that the tree that requires the fewest evolutionary events (appearances of shared derived characters) is the most likely The principle of maximum likelihood states that, given certain rules about how DNA changes over time, a tree can be found that reflects the most likely sequence of evolutionary events 41 Copyright © 2008 Pearson Education, Inc. , publishing as Pearson Benjamin Cummings
Fig. 20 -14 a Human Mushroom Tulip 0 30% 40% 0 40% Tulip (a) Percentage differences between sequences 0
Fig. 20 -14 b 15% 5% 5% 15% 10% 25% 20% Tree 1: More likely Tree 2: Less likely (b) Comparison of possible trees
Computer programs are used to search for trees that are parsimonious and likely 44 Copyright © 2008 Pearson Education, Inc. , publishing as Pearson Benjamin Cummings
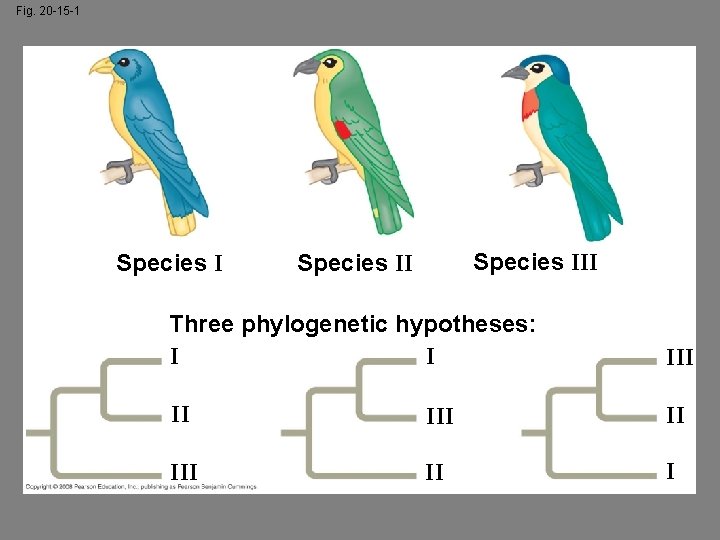
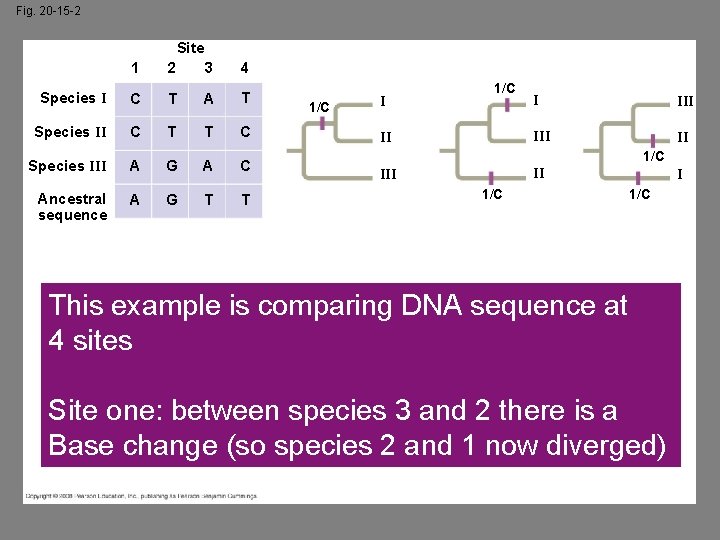
Fig. 20 -15 -1 Species III Species II Three phylogenetic hypotheses: I I III II II I
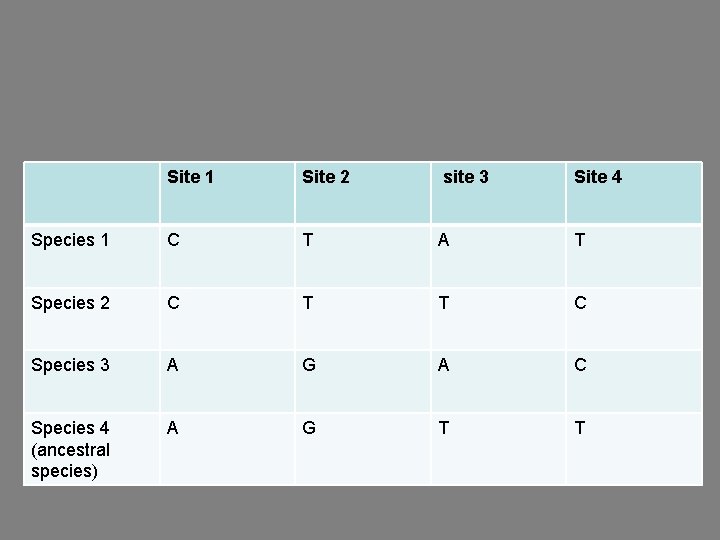
Site 1 Site 2 site 3 Site 4 Species 1 C T A T Species 2 C T T C Species 3 A G A C Species 4 (ancestral species) A G T T
Fig. 20 -15 -2 Site 1 2 3 4 Species I C T A T Species II C T T C Species III A G A C Ancestral sequence A G T T 1/C II I III II 1/C II III 1/C This example is comparing DNA sequence at 4 sites Site one: between species 3 and 2 there is a Base change (so species 2 and 1 now diverged)
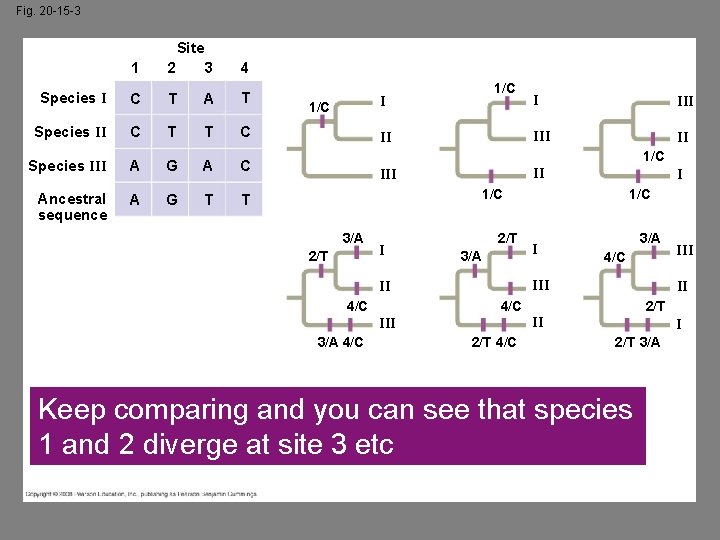
Fig. 20 -15 -3 Site 1 2 3 4 Species I C T A T Species II C T T C Species III A G A C Ancestral sequence A G T T 1/C II I III II 1/C II I 1/C 3/A 2/T I 2/T 3/A 4/C 2/T II 2/T 4/C III II 4/C III 3/A 4/C I II 4/C 1/C I 2/T 3/A Keep comparing and you can see that species 1 and 2 diverge at site 3 etc
Fig. 20 -15 -4 Site 1 2 3 4 Species I C T A T Species II C T T C Species III A G A C Ancestral sequence A G T T 1/C II III II 1/C II I 1/C 3/A 2/T I 2/T 3/A 4/C III II 2/T 4/C II III 6 events 1/C III II Total the number Of base changes That would need to Occur; choose the One that is more Likely because it Requires fewer changes I I 2/T 3/A 2/T 4/C I I III II II I 7 events
Phylogenetic Trees as Hypotheses The best hypotheses for phylogenetic trees fit the most data: morphological, molecular, and fossil Phylogenetic bracketing allows us to predict features of an ancestor from features of its descendents 50 Copyright © 2008 Pearson Education, Inc. , publishing as Pearson Benjamin Cummings
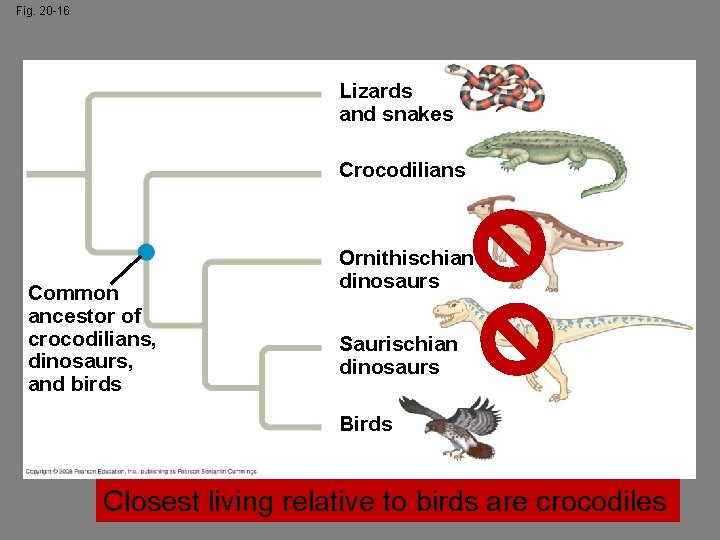
Fig. 20 -16 Lizards and snakes Crocodilians Common ancestor of crocodilians, dinosaurs, and birds Ornithischian dinosaurs Saurischian dinosaurs Birds Closest living relative to birds are crocodiles
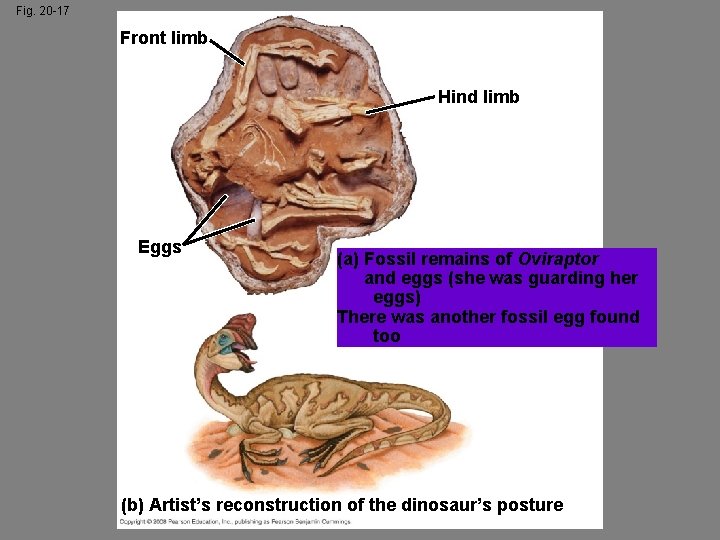
This has been applied to infer features of dinosaurs from their descendents: birds and crocodiles Four chambered heart Sing to attract mate/guard Brood Build nests Because of this it is “predicted” that dinosaurs did these things, too. Why? We think birds descended from dinosaurs, and dinosaurs descended from crocs, SO if crocs and birds do these things the intermediate species (the dinosaurs) must have done these things, too. 52 Animation: The Geologic Record Copyright © 2008 Pearson Education, Inc. , publishing as Pearson Benjamin Cummings
Fig. 20 -17 Front limb Hind limb Eggs (a) Fossil remains of Oviraptor and eggs (she was guarding her eggs) There was another fossil egg found too (b) Artist’s reconstruction of the dinosaur’s posture
Comparing nucleic acids or other molecules to infer relatedness is a valuable tool for tracing organisms’ evolutionary history mt. DNA evolves rapidly and can be used to explore recent evolutionary events 54 Copyright © 2008 Pearson Education, Inc. , publishing as Pearson Benjamin Cummings
DNA that codes for r. RNA changes relatively slowly and is useful for investigating branching points hundreds of millions of years ago It has changed very slowly so can be compared between a variety of species The 3 d shape of the ribosome is conserved between species The linear sequences (primary structure) are not! 55 Copyright © 2008 Pearson Education, Inc. , publishing as Pearson Benjamin Cummings
Gene Duplications and Gene Families Gene duplication increases the number of genes in the genome, providing more opportunities for evolutionary changes Like homologous genes, duplicated genes can be traced to a common ancestor 56 Copyright © 2008 Pearson Education, Inc. , publishing as Pearson Benjamin Cummings
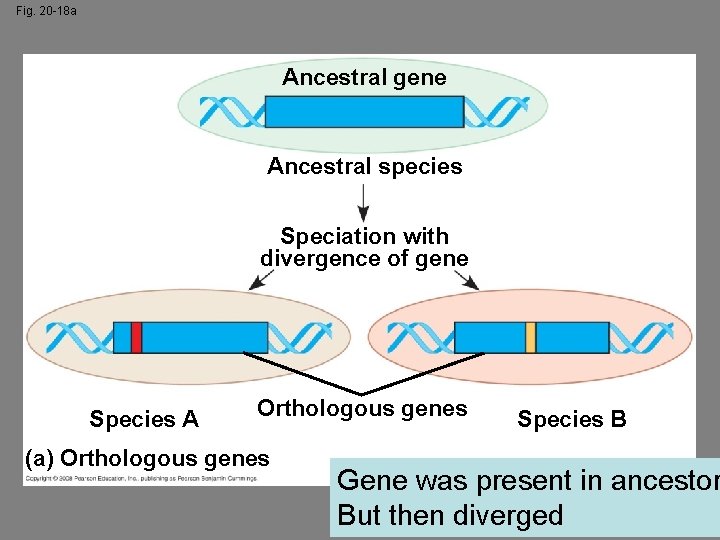
Orthologous genes are found in a single copy in the genome are found in different species Cytochrome c gene (an electron transport chain protein) is orthologous in dogs and humans They can diverge only after speciation occurs (so, new species first then the genes can diverge from each other) With the result that the genes are found in separate gene pools The cytochrome c gene Have a similar function The gene’s sequence in humans has diverged from that in dogs since the time when they shared a common ancestor 57 Copyright © 2008 Pearson Education, Inc. , publishing as Pearson Benjamin Cummings
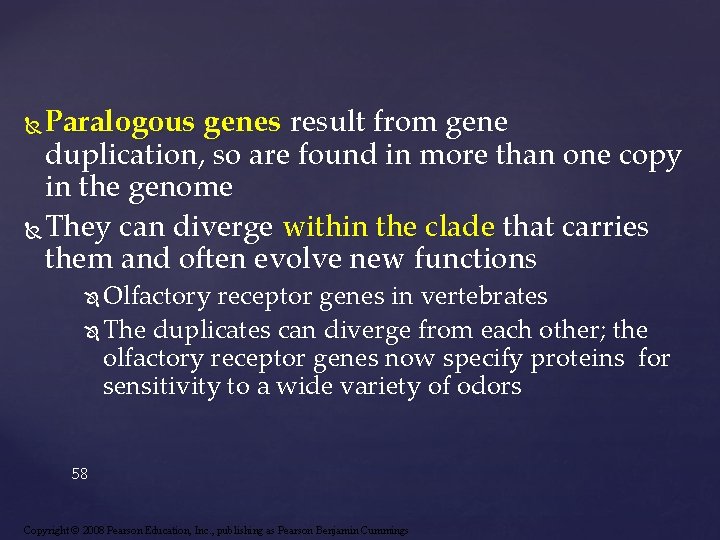
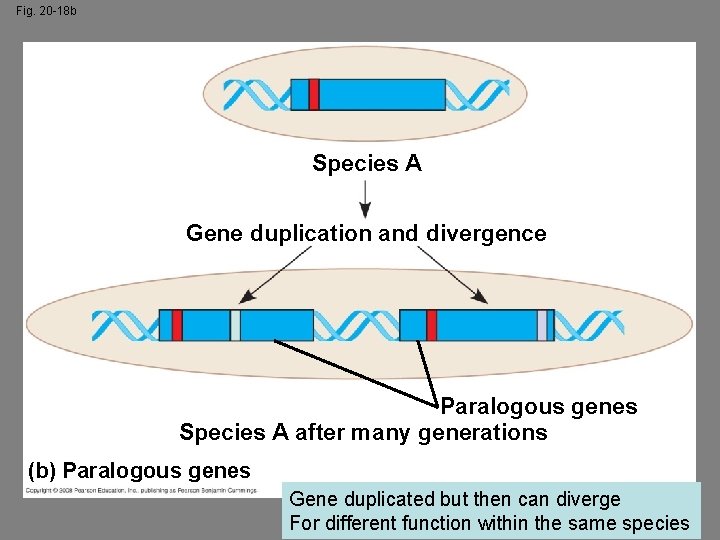
Paralogous genes result from gene duplication, so are found in more than one copy in the genome They can diverge within the clade that carries them and often evolve new functions Olfactory receptor genes in vertebrates The duplicates can diverge from each other; the olfactory receptor genes now specify proteins for sensitivity to a wide variety of odors 58 Copyright © 2008 Pearson Education, Inc. , publishing as Pearson Benjamin Cummings
Fig. 20 -18 a Ancestral gene Ancestral species Speciation with divergence of gene Species A Orthologous genes (a) Orthologous genes Species B Gene was present in ancestor But then diverged
Fig. 20 -18 b Species A Gene duplication and divergence Paralogous genes Species A after many generations (b) Paralogous genes Gene duplicated but then can diverge For different function within the same species
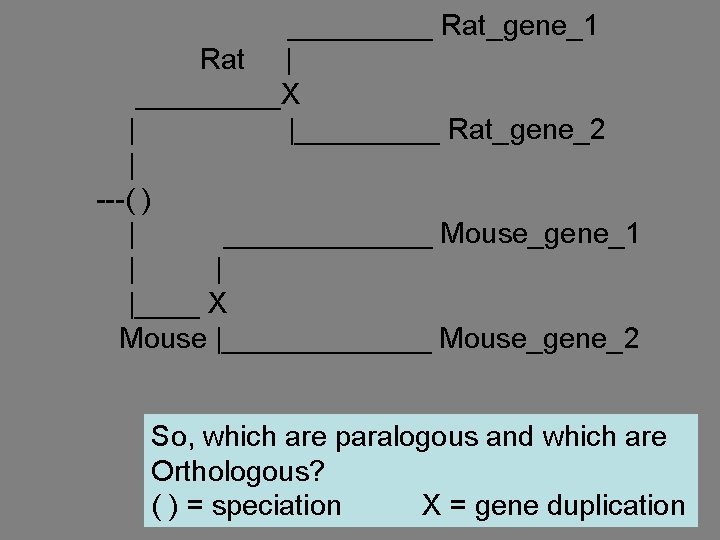
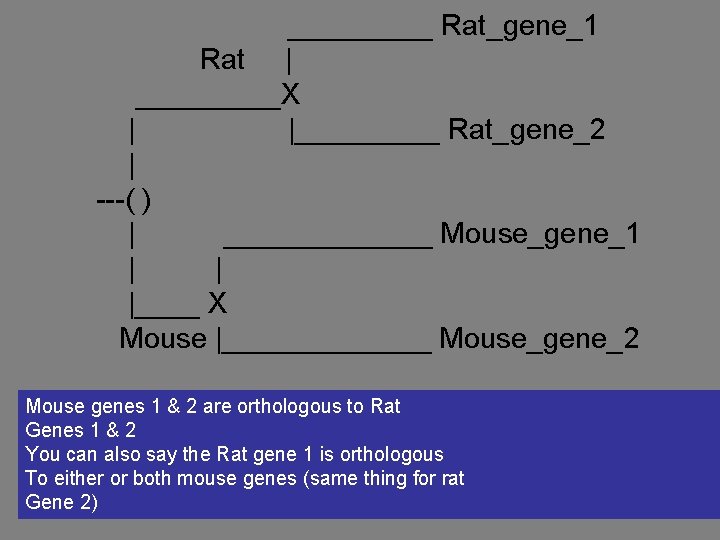
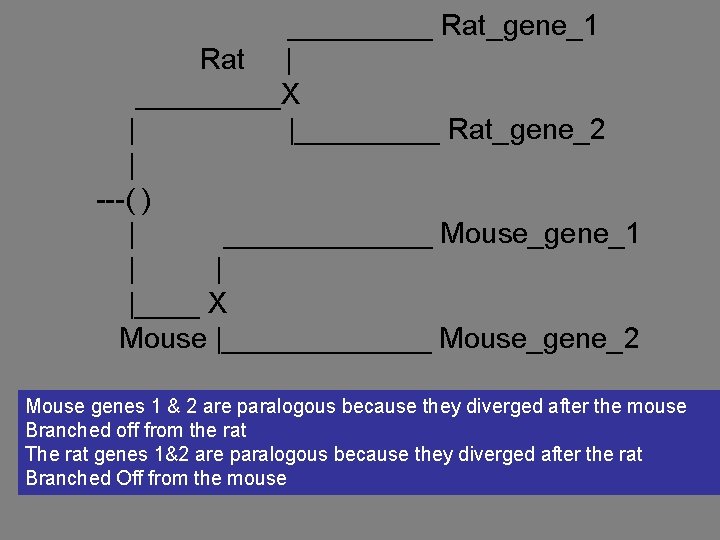
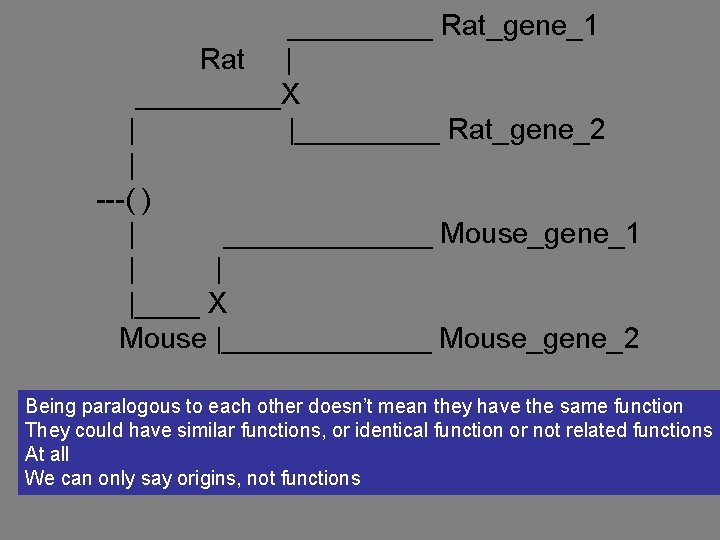
_____ Rat_gene_1 Rat | _____X | |_____ Rat_gene_2 | ---( ) | _______ Mouse_gene_1 | | |____ X Mouse |_______ Mouse_gene_2 So, which are paralogous and which are Orthologous? ( ) = speciation X = gene duplication
_____ Rat_gene_1 Rat | _____X | |_____ Rat_gene_2 | ---( ) | _______ Mouse_gene_1 | | |____ X Mouse |_______ Mouse_gene_2 Mouse genes 1 & 2 are orthologous to Rat Genes 1 & 2 You can also say the Rat gene 1 is orthologous To either or both mouse genes (same thing for rat Gene 2)
_____ Rat_gene_1 Rat | _____X | |_____ Rat_gene_2 | ---( ) | _______ Mouse_gene_1 | | |____ X Mouse |_______ Mouse_gene_2 Mouse genes 1 & 2 are paralogous because they diverged after the mouse Branched off from the rat The rat genes 1&2 are paralogous because they diverged after the rat Branched Off from the mouse
_____ Rat_gene_1 Rat | _____X | |_____ Rat_gene_2 | ---( ) | _______ Mouse_gene_1 | | |____ X Mouse |_______ Mouse_gene_2 Being paralogous to each other doesn’t mean they have the same function They could have similar functions, or identical function or not related functions At all We can only say origins, not functions
Genome Evolution Orthologous genes are widespread and extend across many widely varied species Gene number and the complexity of an organism are not strongly linked Genes in complex organisms appear to be very versatile and each gene can perform many functions 65 Copyright © 2008 Pearson Education, Inc. , publishing as Pearson Benjamin Cummings
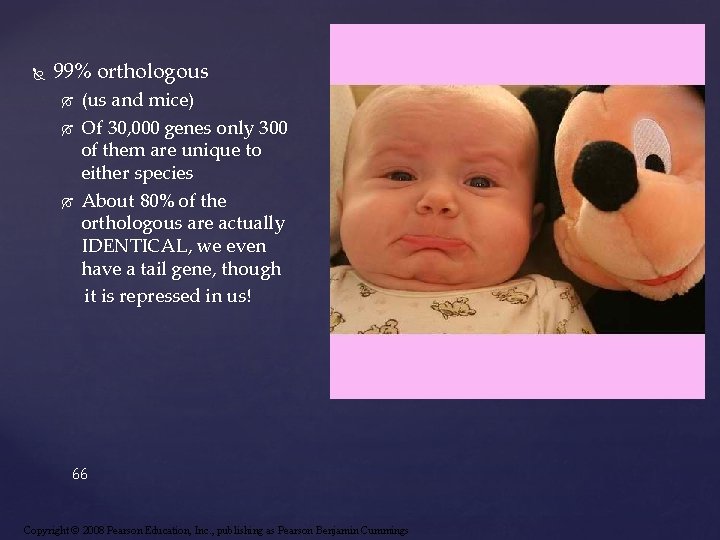
99% orthologous (us and mice) Of 30, 000 genes only 300 of them are unique to either species About 80% of the orthologous are actually IDENTICAL, we even have a tail gene, though it is repressed in us! 66 Copyright © 2008 Pearson Education, Inc. , publishing as Pearson Benjamin Cummings
Concept 20. 4: Molecular clocks help track evolutionary time To extend molecular phylogenies beyond the fossil record, we must make an assumption about how change occurs over time 67 Copyright © 2008 Pearson Education, Inc. , publishing as Pearson Benjamin Cummings
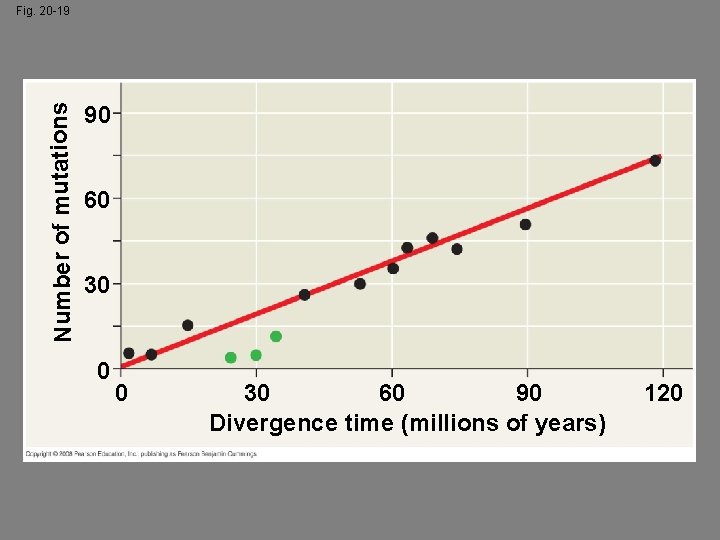
Molecular Clocks A molecular clock uses constant rates of evolution in some genes to estimate the absolute time of evolutionary change In orthologous genes, nucleotide substitutions are proportional to the time since they last shared a common ancestor (before speciation occurred) In paralogous genes, nucleotide substitutions are proportional to the time since the genes became duplicated 68 Copyright © 2008 Pearson Education, Inc. , publishing as Pearson Benjamin Cummings
Molecular clocks are calibrated against branches whose dates are known from the fossil record HOWEVER, it is thought that different parts of the genome mutate at their own rate…so might not be as easy as we currently believe! 69 Copyright © 2008 Pearson Education, Inc. , publishing as Pearson Benjamin Cummings
Number of mutations Fig. 20 -19 90 60 30 0 0 30 60 90 Divergence time (millions of years) 120
Neutral Theory Neutral theory states that much evolutionary change in genes and proteins has no effect on fitness and therefore is not influenced by Darwinian selection It states that the rate of molecular change in these genes and proteins should be regular like a clock If it is a harmful change then the genes would be removed quickly 71 Copyright © 2008 Pearson Education, Inc. , publishing as Pearson Benjamin Cummings
Difficulties with Molecular Clocks The molecular clock does not run as smoothly as neutral theory predicts Irregularities result from natural selection in which some DNA changes are favored over others Estimates of evolutionary divergences older than the fossil record have a high degree of uncertainty The use of multiple genes may improve 72 estimates Copyright © 2008 Pearson Education, Inc. , publishing as Pearson Benjamin Cummings
Applying a Molecular Clock: The Origin of HIV Phylogenetic analysis shows that HIV is descended from viruses that infect chimpanzees and other primates The virus is a retrovirus and uses RNA as its genetic material- evolves quickly (why? ) Doesn’t cause any AIDS like diseases in non humans 73 Copyright © 2008 Pearson Education, Inc. , publishing as Pearson Benjamin Cummings
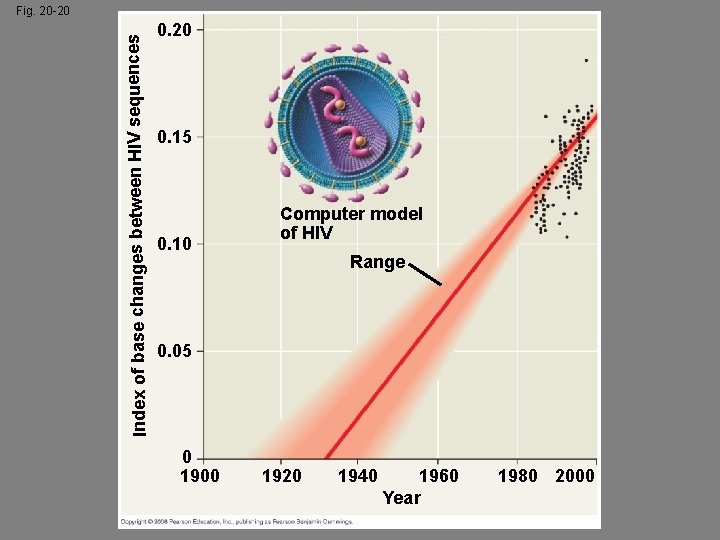
Comparison of HIV samples throughout the epidemic shows that the virus evolved in a very clocklike way Application of a molecular clock to one strain of HIV suggests that strain spread to humans during the 1930 s https: //www. youtube. com /watch? v=hdg. Nn. XLY 8 LU 74 Copyright © 2008 Pearson Education, Inc. , publishing as Pearson Benjamin Cummings
Index of base changes between HIV sequences Fig. 20 -20 0. 15 0. 10 Computer model of HIV Range 0. 05 0 1900 1920 1940 1960 Year 1980 2000
Concept 20. 5: New information continues to revise our understanding of the tree of life Recently, we have gained insight into the very deepest branches of the tree of life through molecular systematics 76 Copyright © 2008 Pearson Education, Inc. , publishing as Pearson Benjamin Cummings
From Two Kingdoms to Three Domains Early taxonomists classified all species as either plants or animals Later, five kingdoms were recognized: Monera (prokaryotes), Protista, Plantae, Fungi, and Animalia 77 Animation: Classification Schemes Copyright © 2008 Pearson Education, Inc. , publishing as Pearson Benjamin Cummings
More recently, the three-domain system has been adopted: Bacteria, Archaea, and Eukarya The three-domain system is supported by data from many sequenced genomes 78 Copyright © 2008 Pearson Education, Inc. , publishing as Pearson Benjamin Cummings
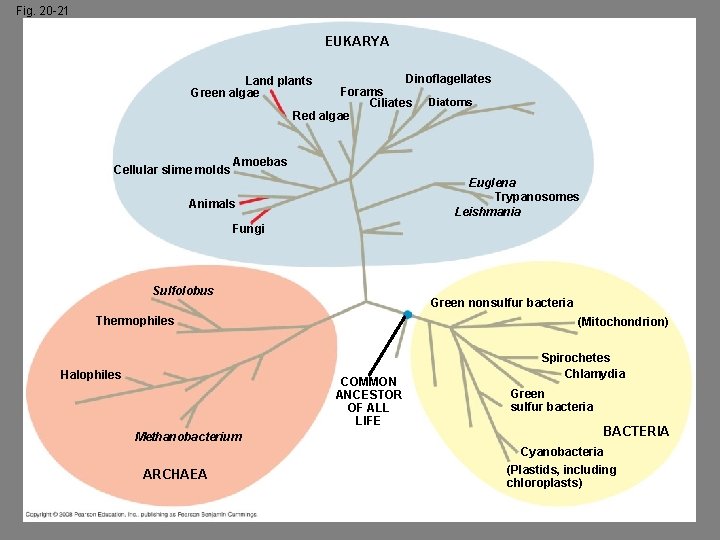
Fig. 20 -21 EUKARYA Dinoflagellates Forams Ciliates Diatoms Red algae Land plants Green algae Cellular slime molds Amoebas Euglena Trypanosomes Leishmania Animals Fungi Sulfolobus Green nonsulfur bacteria Thermophiles Halophiles (Mitochondrion) COMMON ANCESTOR OF ALL LIFE Methanobacterium ARCHAEA Spirochetes Chlamydia Green sulfur bacteria BACTERIA Cyanobacteria (Plastids, including chloroplasts)
A Simple Tree of All Life The tree of life suggests that eukaryotes and archaea are more closely related to each other than to bacteria The bacteria diverged first, leaving the archaea and eukaryotes to diverge from each other later The tree of life is based largely on r. RNA genes, as these have evolved slowly 80 Copyright © 2008 Pearson Education, Inc. , publishing as Pearson Benjamin Cummings
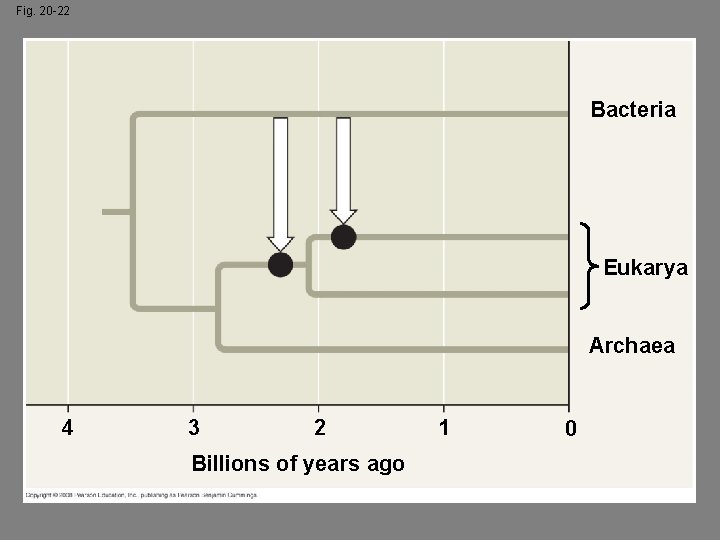
There have been substantial interchanges of genes between organisms in different domains Horizontal gene transfer is the movement of genes from one genome to another Through transposable elements , plasmids, viral infection, fusion of organisms Some scientists believe that eukaryotes developed from a fusion of bacteria and Achaea Horizontal gene transfer complicates efforts to build a tree of life the trees can be built in different ways depending on the criteria for the grouping! 81 Copyright © 2008 Pearson Education, Inc. , publishing as Pearson Benjamin Cummings
Fig. 20 -22 Bacteria Eukarya Archaea 4 3 2 Billions of years ago 1 0
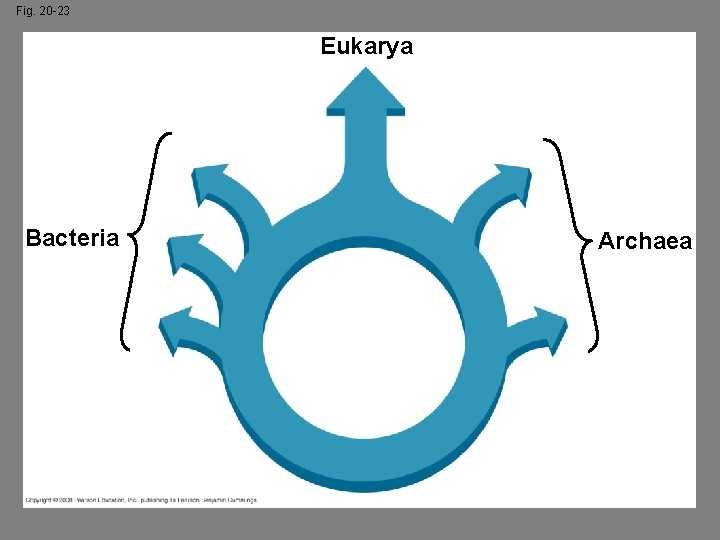
Is the Tree of Life Really a Ring? Some researchers suggest that eukaryotes arose as an endosymbiosis between a bacterium and archaean If so, early evolutionary relationships might be better depicted by a ring of life instead of a tree of life If we are just as closely related to both the bacterium and archaean 83 Copyright © 2008 Pearson Education, Inc. , publishing as Pearson Benjamin Cummings
Fig. 20 -23 Eukarya Bacteria Archaea