Chapter 26 Phylogeny and the Tree of Life


 Systematics Phylogenetics (evolutionary history)")
 3. Molecular")
 Naming system")


 species Common ancestor (fossil)")


 tree Unrooted tree Rooted tree")
 for")


- Slides: 26
Chapter 26 Phylogeny and the Tree of Life
What you need to know: • The taxonomic categories and how they indicate relatedness. • How systematics is used to develop phylogenetic trees. • The three domains of life including their similarities and their differences.
Systematics: classifying organisms and determining their evolutionary relationships Taxonomy (classification) Systematics Phylogenetics (evolutionary history)
Tools used to determine evolutionary relationships: 1. Fossils 2. Morphology (homologous structures) 3. Molecular evidence (DNA, amino acids) Who is more closely related? Animals and fungi are more closely related than either is to plants.
Taxonomy: science of classifying and naming organisms • Binomial nomenclature (Genus species) Naming system developed by Carolus Linnaeus.
REMEMBER!! • Dear King Philip Came Over For Good Spaghetti • Dear King Philip Crossed Over Five Great Seas • Dear King Philip Came Over From Germany Stoned • Your own? ? ?
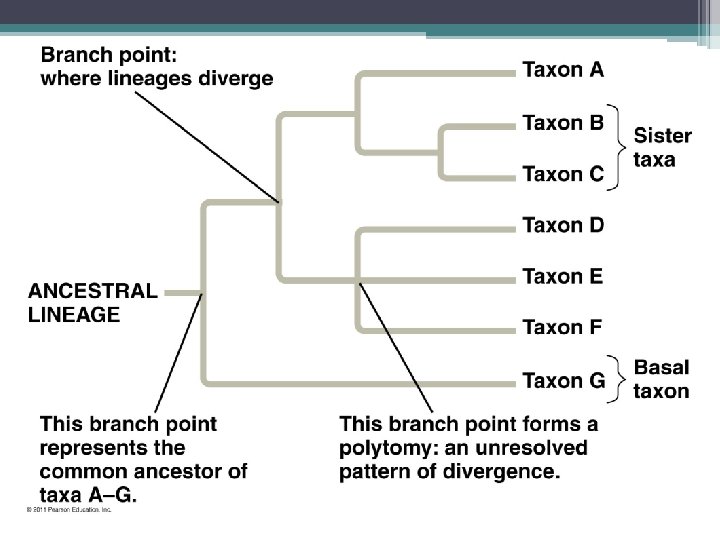
Phylogenetic Tree • Branching diagram that shows evolutionary history of a group of organisms
Molecular Systematics 2004 -2005 • Hypothesizing phylogenies using molecular data ▫ apply principle of parsimony simplest explanation fewest evolutionary events that explain data hypothetical bird species 3 possible phylogenies (there are more)
2004 -2005 • Choose the “tree” that explains the data Parsimony invoking the fewest number of evolutionary events
2004 -2005 Parsimony & analogy vs. homology Phylogenetic trees are hypotheses Which is the most parsimonious tree?
Activity: Constructing a Cookie Phylogenetic Tree
Living (extant) species Common ancestor (fossil)
Extant species Common ancestor
Example of a Cookie Tree
Cladogram: diagram that depicts patterns of shared characteristics among taxa • Clade = group of species that includes an ancestral species + all descendents • Shared derived characteristics are used to construct cladograms Turtle Leopard Hair Salamander Amniotic egg Tuna Lamprey Lancelet (outgroup) Cladogram Four walking legs Hinged jaws Vertebral column
Monophyletic, paraphyletic, and polyphyletic groups Consists of an ancestral species And all of its descendants Consists of an ancestral species and some of its descendants, But not all of them Some of its members have Different ancestros
Constructing a phylogenetic tree A 0 indicates a character is absent; a 1 indicates that a character is present.
Branch lengths can represent genetic change
Branch lengths can indicate time
Draw a phylogenetic tree based on the data below. Draw hatch marks on the tree to indicate the origin(s) of each of the 6 characters.
Answer:
Various tree layouts Circular (rooted) tree Unrooted tree Rooted tree
• Principle of maximum parsimony: parsimony use simplest explanation (fewest DNA changes) for tree – “keep it simple” • Molecular clocks: some regions of DNA appear to evolve at constant rates ▫ Estimate date of past evolutionary events ▫ Eg. Origin of HIV infection in humans= 1930’s
Tree of Life • 3 Domains: Bacteria, Archaea, Eukarya
SYSTEMATICS es focus on phylogeny Biological diversity taxonomy cladistics classification Identification of species binomial Genus, species D K P C O F G S Homologous similarities fossils molecular morphology