CFA Program exam preparation Quantitative Methods Paul Gainford





- Slides: 31
CFA® Program exam preparation Quantitative Methods Paul Gainford, CFA Program Instructor 18 th March 2019 Fitch Learning is a member of the CFA Institute Approved Prep Provider Program. CFA Institute does not endorse, promote, or warrant the accuracy or quality of the products or services offered by Fitch Learning. CFA Institute, CFA® and Chartered Financial Analyst® are trademarks owned by CFA Institute. Knowledge | Skills | Conduct
About Fitch Learning has more than 19 years’ experience helping candidates through their CFA Program studies. Over 3, 000 CFA Program candidates study with Fitch Learning every year. • Choose from a range of flexible classroom and online options • Get a personalized learning experience with access to our adaptive online study portal – Fitch Learning Cognition • Consolidate your knowledge and perfect your technique before the exam with our online and classroom review packages Knowledge | Skills | Conduct
Fitch Learning Cognition • Study anytime and anywhere on desktop or using the mobile app • Receive guidance through the topics so you know exactly what to study and when • Get the support you need from our expert instructor team via the online helpdesk Knowledge | Skills | Conduct
Getting Ready for the Level I CFA Program Exam Make use of our additional resources to enhance your studies and boost your knowledge, so you enter the exam hall feeling confident. • 5 -Day Intensive Program is available in London, starting 29 th April or 13 th May • Join our 2 -Day London Classroom Review courses on the 18 th – 19 th May and 29 th – 30 th May • Online review includes a variety of question tools, workshops, videos, mocks and live webcasts: Prepare for the exam Strengthen your knowledge Perfect your exam technique • Stand alone mock exams (online and printable) Book Your Review Option Today Contact Steve Brady on 0207 496 8295 or email steve. brady@fitchlearning. com. Alternatively, visit www. fitchexamprep. com/review-options. Knowledge | Skills | Conduct
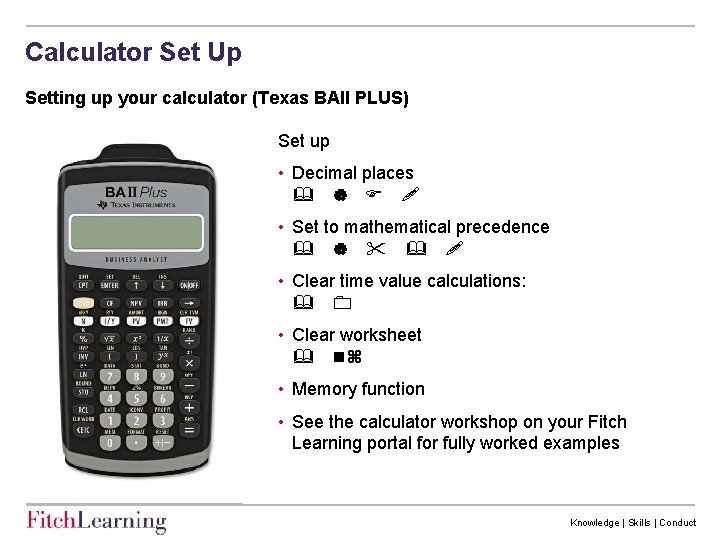
Calculator Set Up Setting up your calculator (Texas BAII PLUS) Set up • Decimal places • Set to mathematical precedence • Clear time value calculations: • Clear worksheet n • Memory function • See the calculator workshop on your Fitch Learning portal for fully worked examples Knowledge | Skills | Conduct
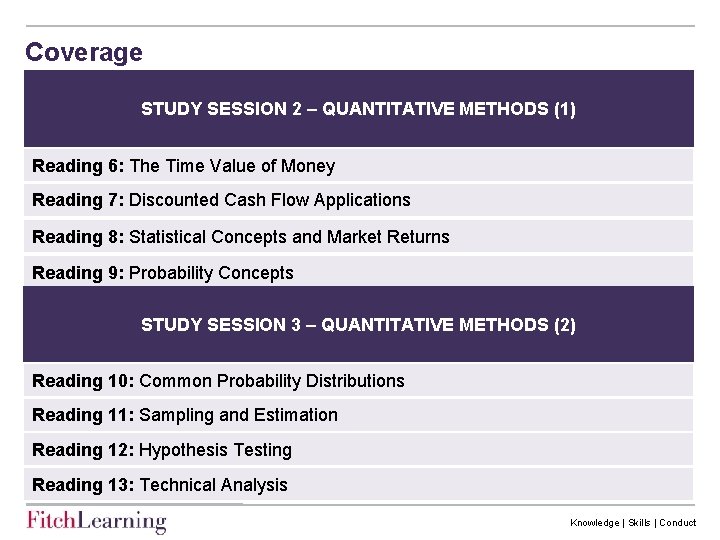
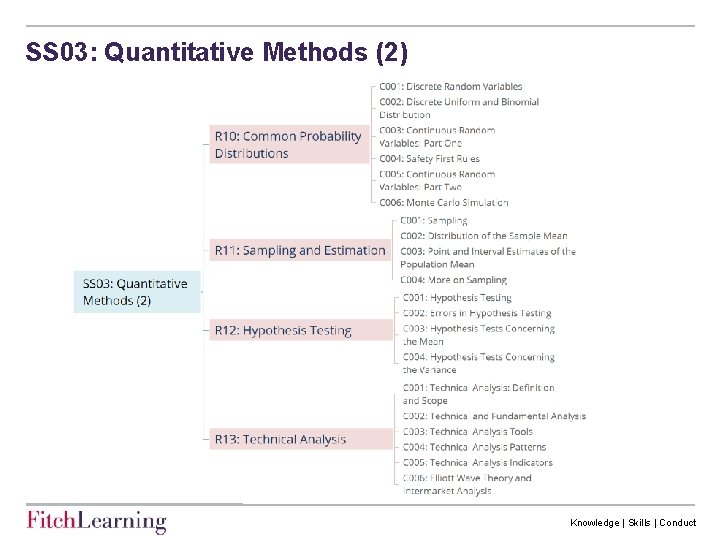
Coverage STUDY SESSION 2 – QUANTITATIVE METHODS (1) Reading 6: The Time Value of Money Reading 7: Discounted Cash Flow Applications Reading 8: Statistical Concepts and Market Returns Reading 9: Probability Concepts STUDY SESSION 3 – QUANTITATIVE METHODS (2) Reading 10: Common Probability Distributions Reading 11: Sampling and Estimation Reading 12: Hypothesis Testing Reading 13: Technical Analysis Knowledge | Skills | Conduct
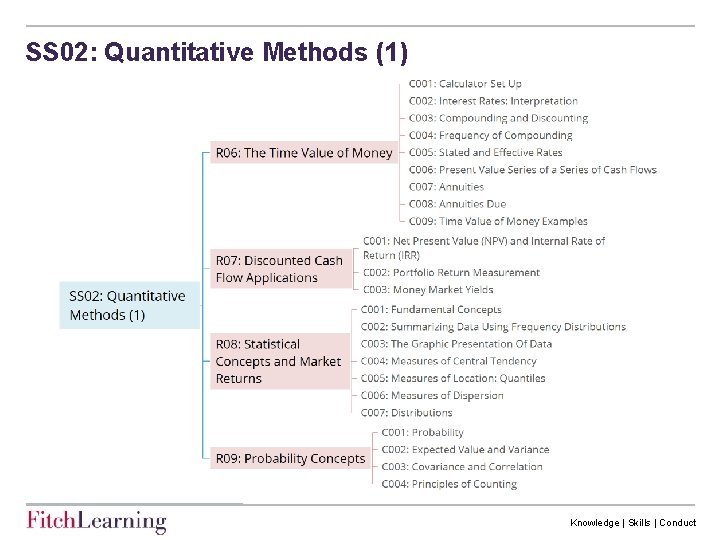
SS 02: Quantitative Methods (1) Knowledge | Skills | Conduct
SS 03: Quantitative Methods (2) Knowledge | Skills | Conduct
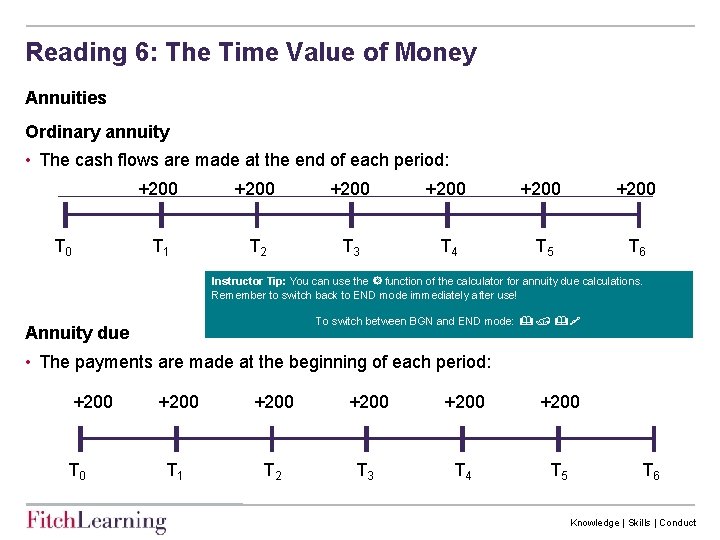
Reading 6: The Time Value of Money Annuities Ordinary annuity • The cash flows are made at the end of each period: +200 +200 T 0 T 1 T 2 T 3 T 4 T 5 T 6 Instructor Tip: You can use the function of the calculator for annuity due calculations. Remember to switch back to END mode immediately after use! Annuity due To switch between BGN and END mode: • The payments are made at the beginning of each period: +200 +200 T 0 T 1 T 2 T 3 T 4 T 5 T 6 Knowledge | Skills | Conduct
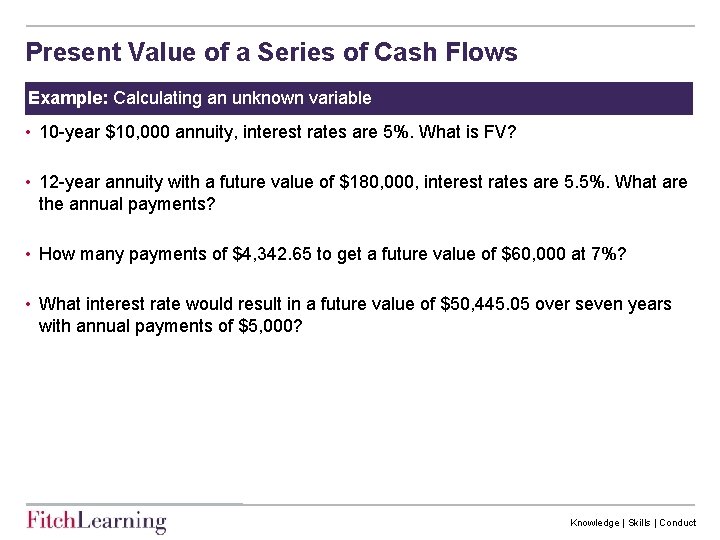
Present Value of a Series of Cash Flows Example: Calculating an unknown variable • 10 -year $10, 000 annuity, interest rates are 5%. What is FV? • 12 -year annuity with a future value of $180, 000, interest rates are 5. 5%. What are the annual payments? • How many payments of $4, 342. 65 to get a future value of $60, 000 at 7%? • What interest rate would result in a future value of $50, 445. 05 over seven years with annual payments of $5, 000? Knowledge | Skills | Conduct
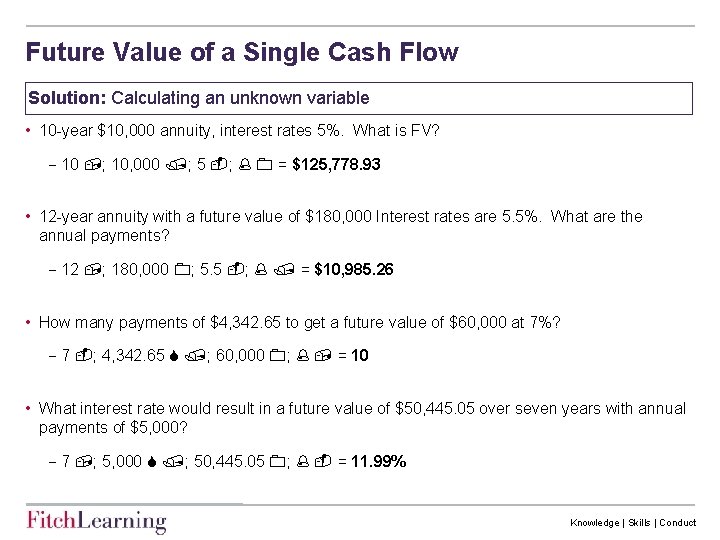
Future Value of a Single Cash Flow Solution: Calculating an unknown variable • 10 -year $10, 000 annuity, interest rates 5%. What is FV? 10 ; 10, 000 ; 5 ; = $125, 778. 93 • 12 -year annuity with a future value of $180, 000 Interest rates are 5. 5%. What are the annual payments? 12 ; 180, 000 ; 5. 5 ; = $10, 985. 26 • How many payments of $4, 342. 65 to get a future value of $60, 000 at 7%? 7 ; 4, 342. 65 ; 60, 000 ; = 10 • What interest rate would result in a future value of $50, 445. 05 over seven years with annual payments of $5, 000? 7 ; 5, 000 ; 50, 445. 05 ; = 11. 99% Knowledge | Skills | Conduct
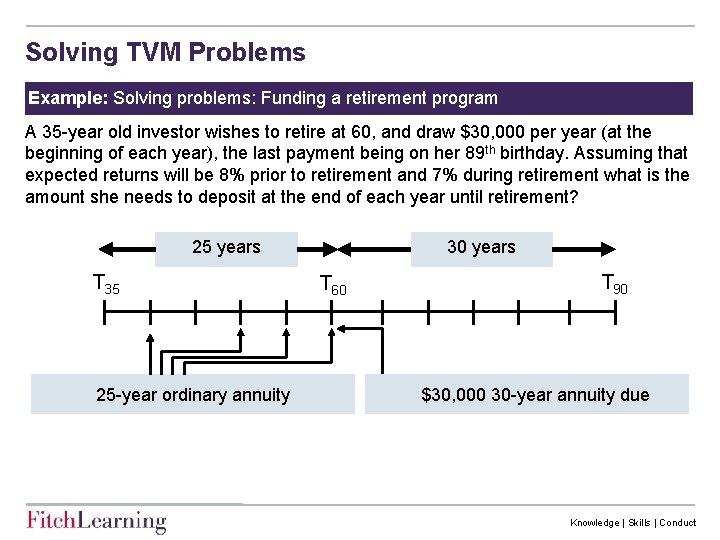
Solving TVM Problems Example: Solving problems: Funding a retirement program A 35 -year old investor wishes to retire at 60, and draw $30, 000 per year (at the beginning of each year), the last payment being on her 89 th birthday. Assuming that expected returns will be 8% prior to retirement and 7% during retirement what is the amount she needs to deposit at the end of each year until retirement? 25 years T 35 25 -year ordinary annuity 30 years T 60 T 90 $30, 000 30 -year annuity due Knowledge | Skills | Conduct
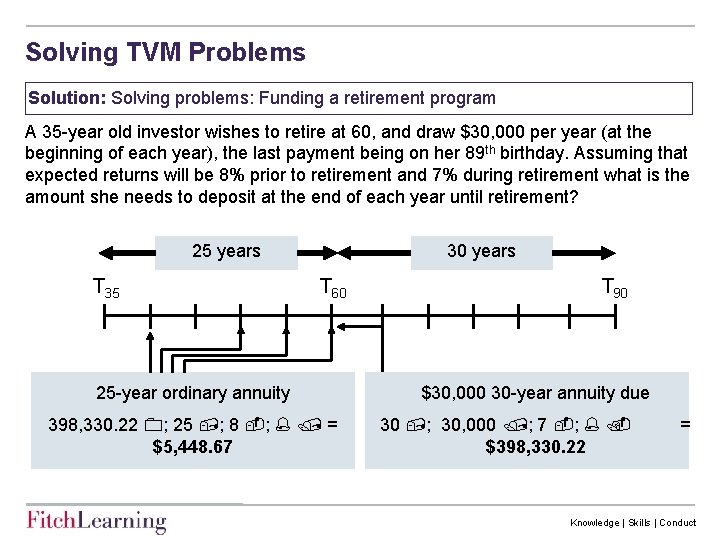
Solving TVM Problems Solution: Solving problems: Funding a retirement program A 35 -year old investor wishes to retire at 60, and draw $30, 000 per year (at the beginning of each year), the last payment being on her 89 th birthday. Assuming that expected returns will be 8% prior to retirement and 7% during retirement what is the amount she needs to deposit at the end of each year until retirement? 25 years T 35 30 years T 60 T 90 25 -year ordinary annuity $30, 000 30 -year annuity due 398, 330. 22 ; 25 ; 8 ; = $5, 448. 67 30 ; 30, 000 ; 7 ; = $398, 330. 22 Knowledge | Skills | Conduct
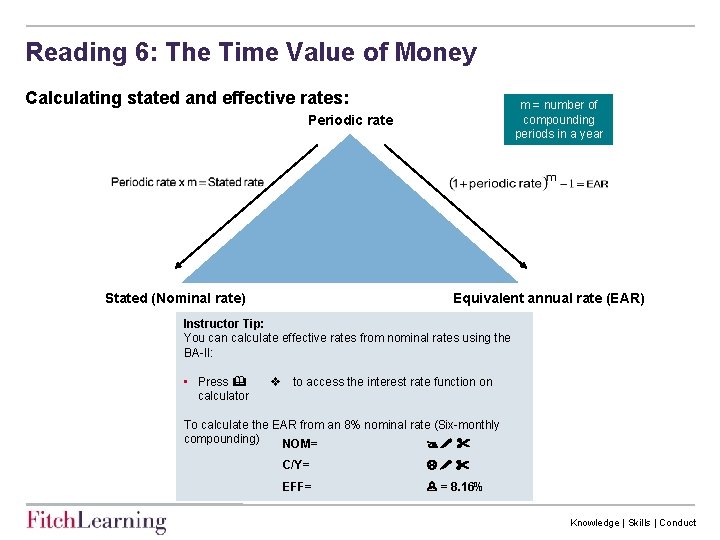
Reading 6: The Time Value of Money Calculating stated and effective rates: m = number of compounding periods in a year Periodic rate Stated (Nominal rate) Equivalent annual rate (EAR) Instructor Tip: You can calculate effective rates from nominal rates using the BA-II: • Press calculator v to access the interest rate function on To calculate the EAR from an 8% nominal rate (Six-monthly compounding) NOM= C/Y= EFF= = 8. 16% Knowledge | Skills | Conduct
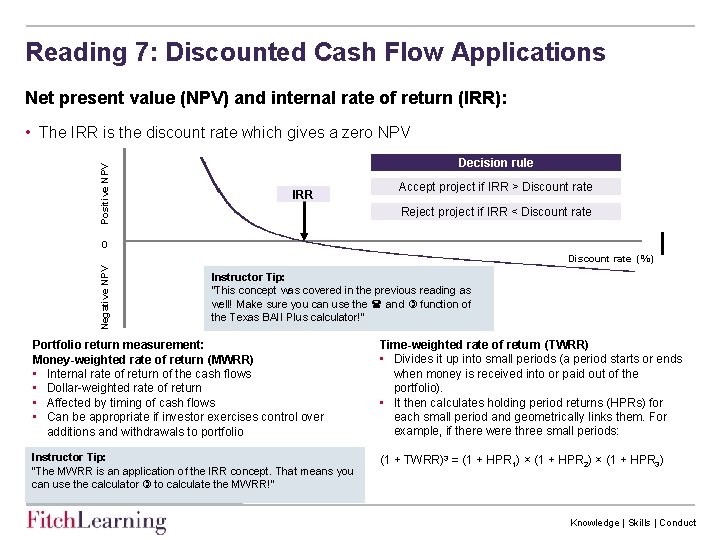
Reading 7: Discounted Cash Flow Applications Net present value (NPV) and internal rate of return (IRR): Positive NPV • The IRR is the discount rate which gives a zero NPV Decision rule IRR Accept project if IRR > Discount rate Reject project if IRR < Discount rate 0 Negative NPV Discount rate (%) Instructor Tip: “This concept was covered in the previous reading as well! Make sure you can use the and function of the Texas BAII Plus calculator!” Portfolio return measurement: Money-weighted rate of return (MWRR) • Internal rate of return of the cash flows • Dollar-weighted rate of return • Affected by timing of cash flows • Can be appropriate if investor exercises control over additions and withdrawals to portfolio Time-weighted rate of return (TWRR) • Divides it up into small periods (a period starts or ends when money is received into or paid out of the portfolio). • It then calculates holding period returns (HPRs) for each small period and geometrically links them. For example, if there were three small periods: Instructor Tip: “The MWRR is an application of the IRR concept. That means you can use the calculator to calculate the MWRR!” (1 + TWRR)3 = (1 + HPR 1) × (1 + HPR 2) × (1 + HPR 3) Knowledge | Skills | Conduct
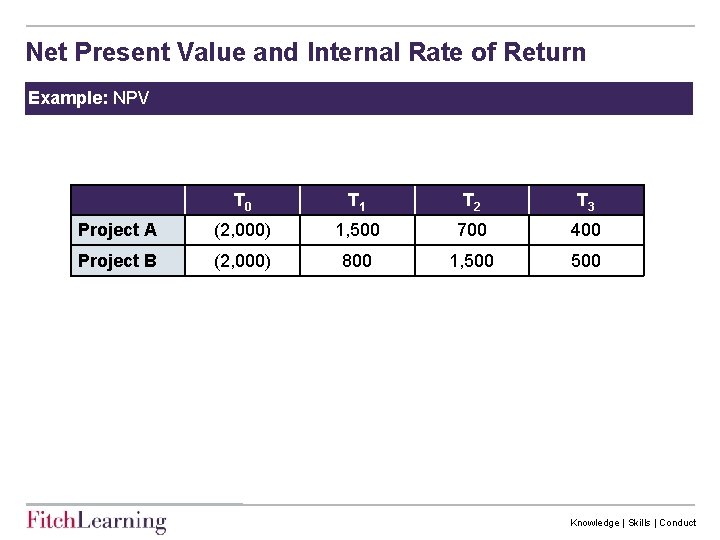
Net Present Value and Internal Rate of Return Example: NPV T 0 T 1 T 2 T 3 Project A (2, 000) 1, 500 700 400 Project B (2, 000) 800 1, 500 Knowledge | Skills | Conduct
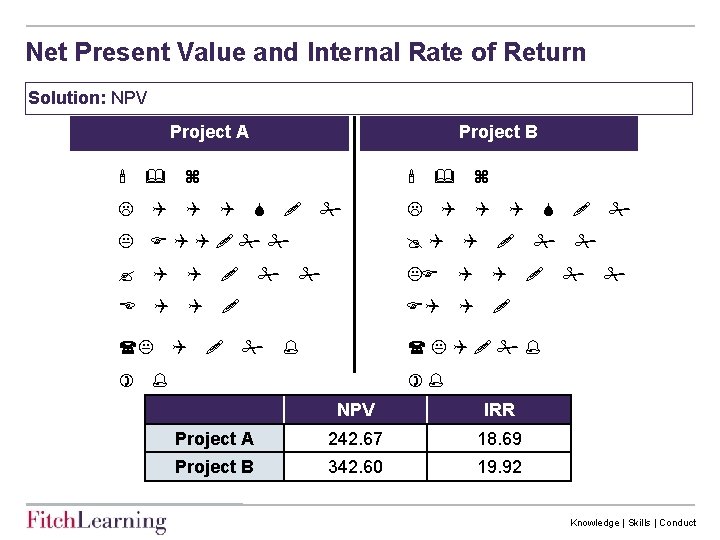
Net Present Value and Internal Rate of Return Solution: NPV Project A Project B E NPV IRR Project A 242. 67 18. 69 Project B 342. 60 19. 92 Knowledge | Skills | Conduct
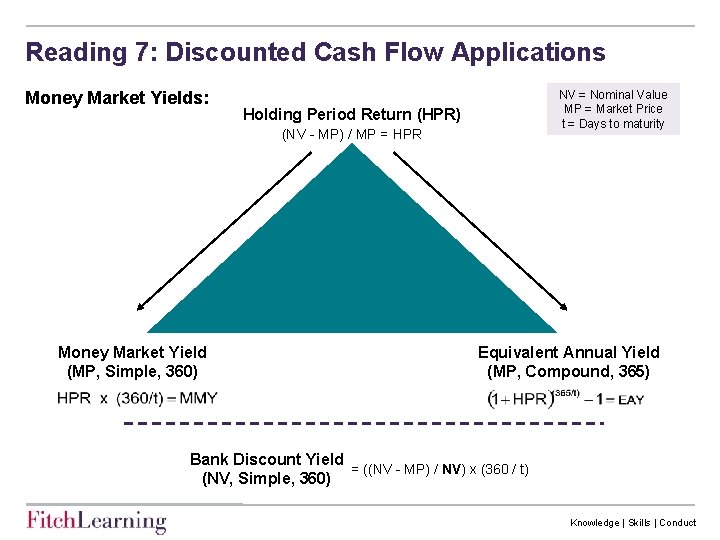
Reading 7: Discounted Cash Flow Applications Money Market Yields: NV = Nominal Value MP = Market Price t = Days to maturity Holding Period Return (HPR) (NV - MP) / MP = HPR Money Market Yield (MP, Simple, 360) Equivalent Annual Yield (MP, Compound, 365) Bank Discount Yield = ((NV - MP) / NV) x (360 / t) (NV, Simple, 360) Knowledge | Skills | Conduct
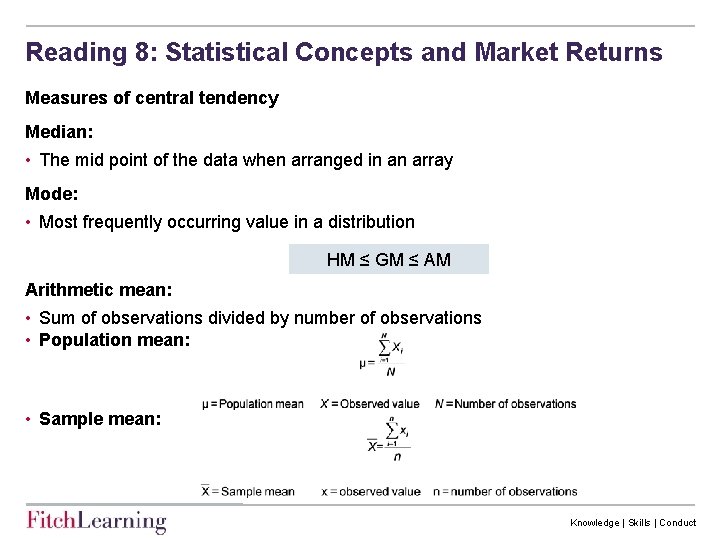
Reading 8: Statistical Concepts and Market Returns Measures of central tendency Median: • The mid point of the data when arranged in an array Mode: • Most frequently occurring value in a distribution HM ≤ GM ≤ AM Arithmetic mean: • Sum of observations divided by number of observations • Population mean: • Sample mean: Knowledge | Skills | Conduct
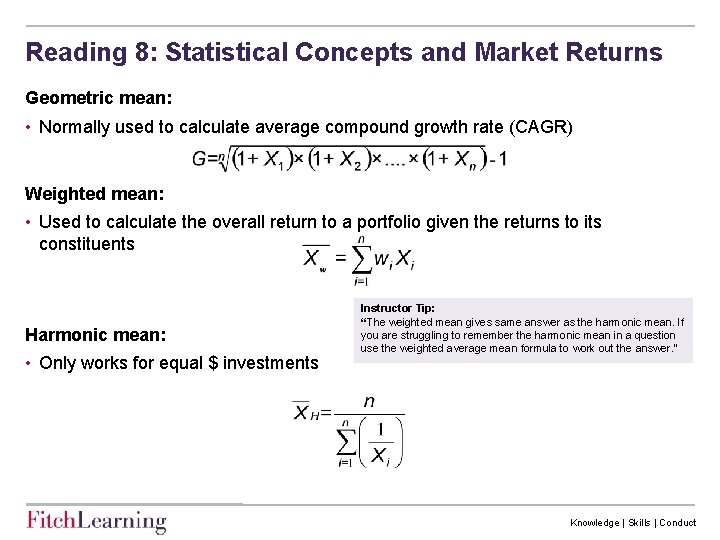
Reading 8: Statistical Concepts and Market Returns Geometric mean: • Normally used to calculate average compound growth rate (CAGR) Weighted mean: • Used to calculate the overall return to a portfolio given the returns to its constituents Harmonic mean: • Only works for equal $ investments Instructor Tip: “The weighted mean gives same answer as the harmonic mean. If you are struggling to remember the harmonic mean in a question use the weighted average mean formula to work out the answer. ” Knowledge | Skills | Conduct
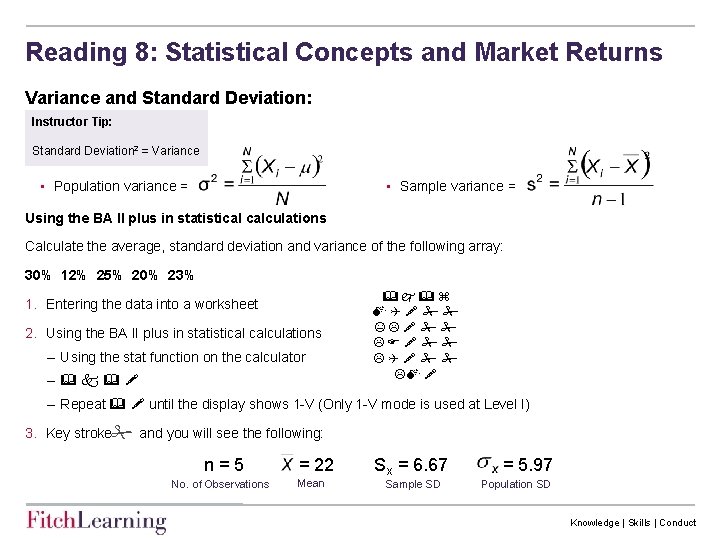
Reading 8: Statistical Concepts and Market Returns Variance and Standard Deviation: Instructor Tip: Standard Deviation 2 = Variance • Population variance = • Sample variance = Using the BA II plus in statistical calculations Calculate the average, standard deviation and variance of the following array: 30% 12% 25% 20% 23% 1. Entering the data into a worksheet 2. Using the BA II plus in statistical calculations – Using the stat function on the calculator – – Repeat until the display shows 1 -V (Only 1 -V mode is used at Level I) 3. Key stroke and you will see the following: n = 5 = 22 Sx = 6. 67 = 5. 97 No. of Observations Mean Sample SD Population SD Knowledge | Skills | Conduct
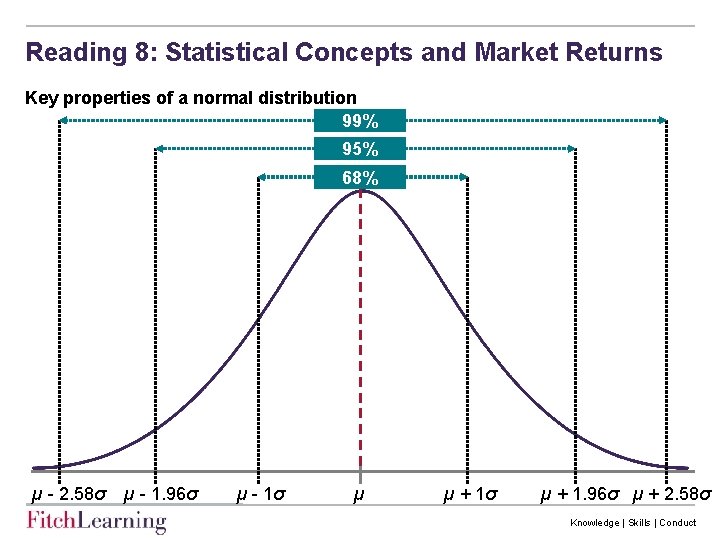
Reading 8: Statistical Concepts and Market Returns Key properties of a normal distribution 99% 95% 68% µ - 2. 58σ µ - 1. 96σ µ - 1σ µ µ + 1σ µ + 1. 96σ µ + 2. 58σ Knowledge | Skills | Conduct
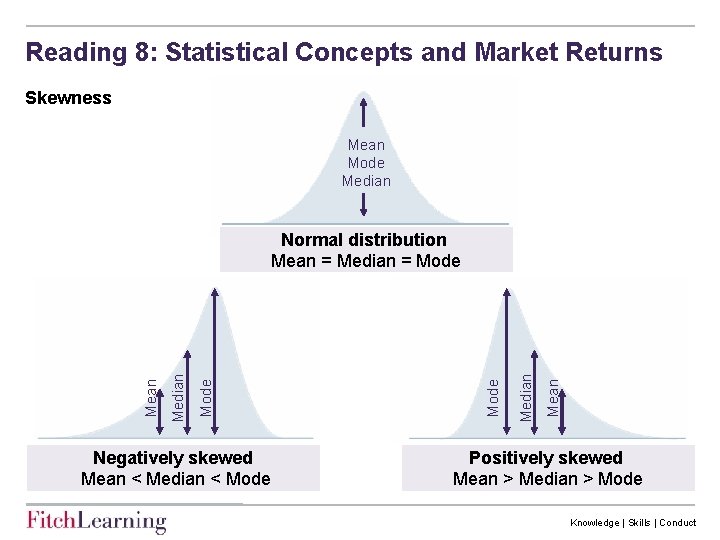
Reading 8: Statistical Concepts and Market Returns Skewness Mean Mode Median Negatively skewed Mean < Median < Mode Mean Median Mode Median Mean Normal distribution Mean = Median = Mode Positively skewed Mean > Median > Mode Knowledge | Skills | Conduct
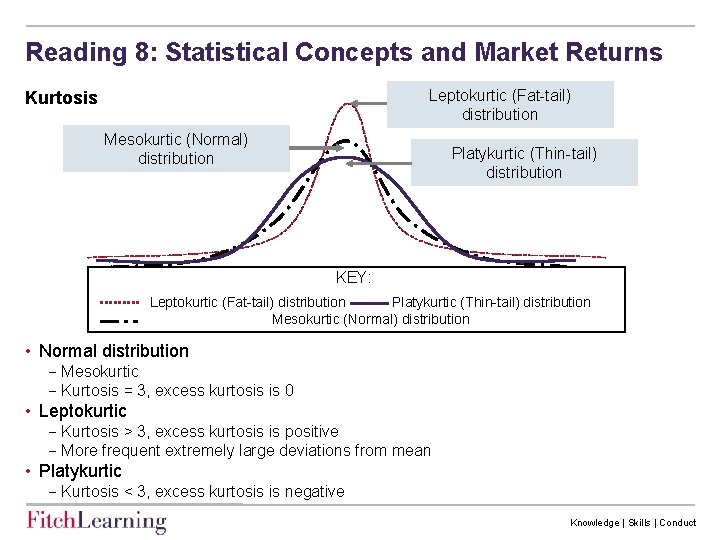
Reading 8: Statistical Concepts and Market Returns Leptokurtic (Fat-tail) distribution Kurtosis Mesokurtic (Normal) distribution Platykurtic (Thin-tail) distribution KEY: Leptokurtic (Fat-tail) distribution Platykurtic (Thin-tail) distribution Mesokurtic (Normal) distribution • Normal distribution Mesokurtic Kurtosis = 3, excess kurtosis is 0 • Leptokurtic Kurtosis > 3, excess kurtosis is positive More frequent extremely large deviations from mean • Platykurtic Kurtosis < 3, excess kurtosis is negative Knowledge | Skills | Conduct
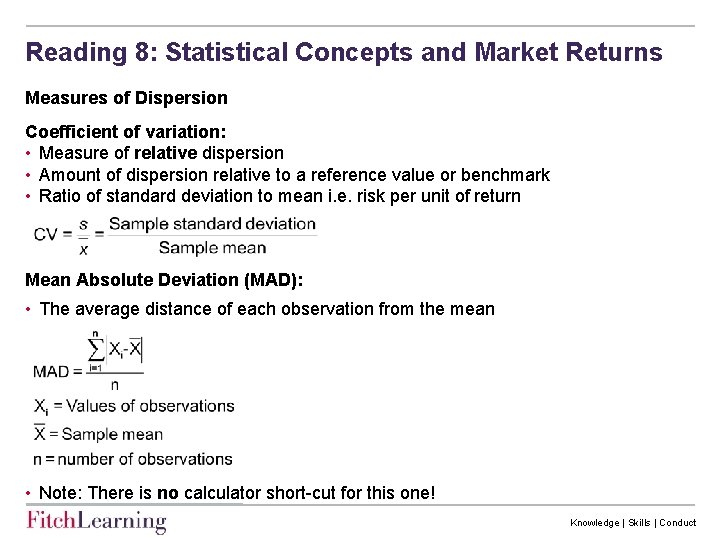
Reading 8: Statistical Concepts and Market Returns Measures of Dispersion Coefficient of variation: • Measure of relative dispersion • Amount of dispersion relative to a reference value or benchmark • Ratio of standard deviation to mean i. e. risk per unit of return Mean Absolute Deviation (MAD): • The average distance of each observation from the mean • Note: There is no calculator short-cut for this one! Knowledge | Skills | Conduct
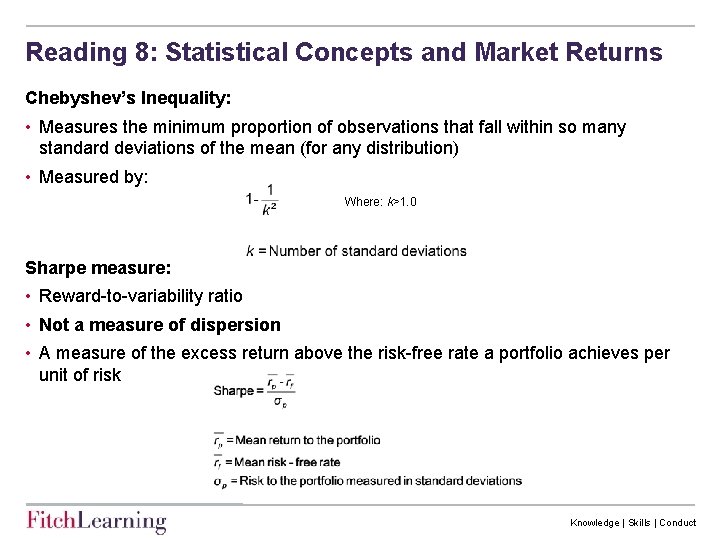
Reading 8: Statistical Concepts and Market Returns Chebyshev’s Inequality: • Measures the minimum proportion of observations that fall within so many standard deviations of the mean (for any distribution) • Measured by: Where: k>1. 0 Sharpe measure: • Reward-to-variability ratio • Not a measure of dispersion • A measure of the excess return above the risk-free rate a portfolio achieves per unit of risk Knowledge | Skills | Conduct
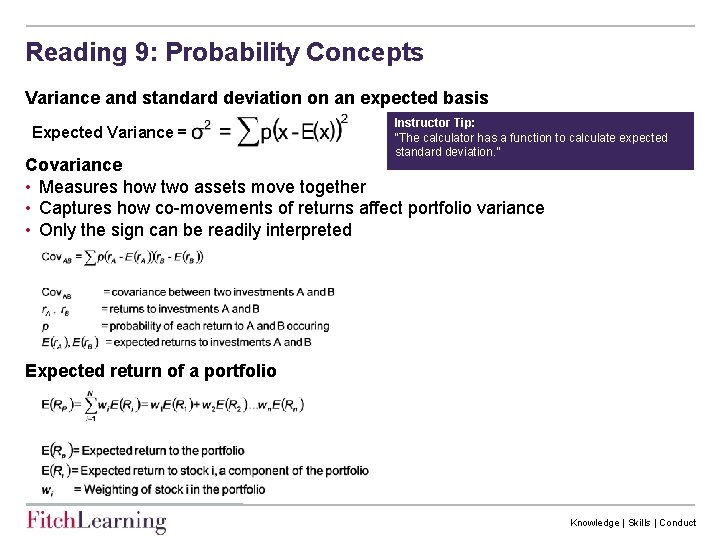
Reading 9: Probability Concepts Variance and standard deviation on an expected basis Expected Variance = Instructor Tip: “The calculator has a function to calculate expected standard deviation. ” Covariance • Measures how two assets move together • Captures how co-movements of returns affect portfolio variance • Only the sign can be readily interpreted Expected return of a portfolio Knowledge | Skills | Conduct
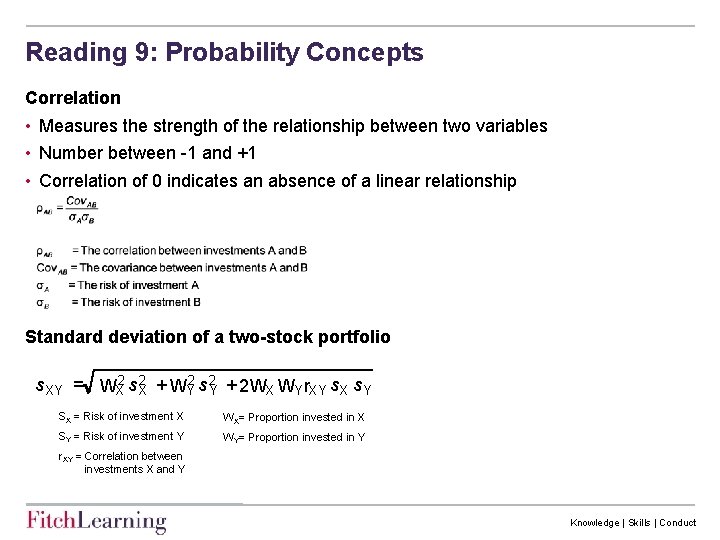
Reading 9: Probability Concepts Correlation • Measures the strength of the relationship between two variables • Number between -1 and +1 • Correlation of 0 indicates an absence of a linear relationship Standard deviation of a two-stock portfolio s XY = WX 2 s X 2 + WY 2 s Y 2 + 2 WX WY r. XY s X s Y SX = Risk of investment X WX= Proportion invested in X SY = Risk of investment Y WY= Proportion invested in Y r. XY = Correlation between investments X and Y Knowledge | Skills | Conduct
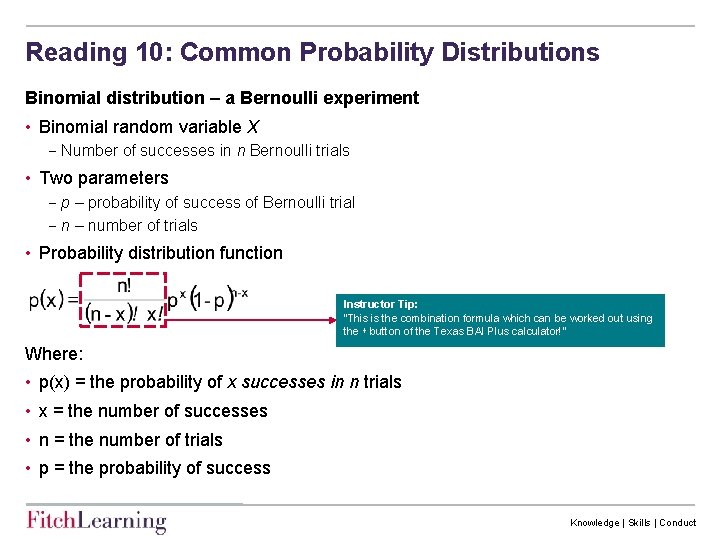
Reading 10: Common Probability Distributions Binomial distribution – a Bernoulli experiment • Binomial random variable X Number of successes in n Bernoulli trials • Two parameters p – probability of success of Bernoulli trial n – number of trials • Probability distribution function Instructor Tip: “This is the combination formula which can be worked out using the button of the Texas BAI Plus calculator!” Where: • p(x) = the probability of x successes in n trials • x = the number of successes • n = the number of trials • p = the probability of success Knowledge | Skills | Conduct
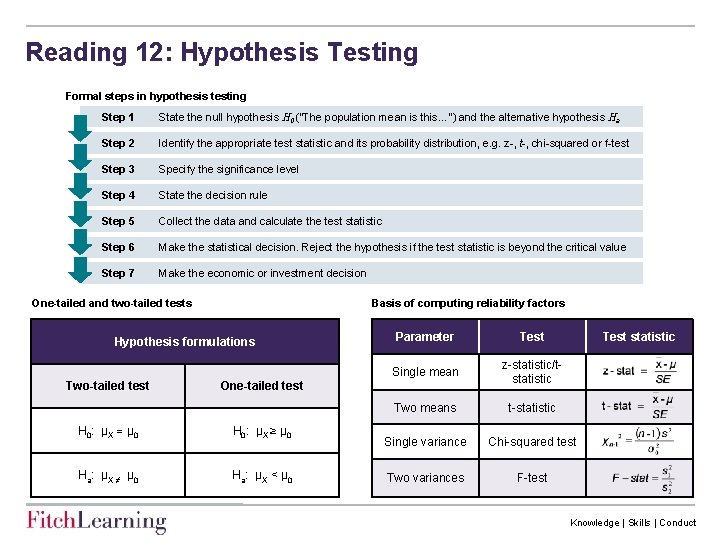
Reading 12: Hypothesis Testing Formal steps in hypothesis testing Step 1 State the null hypothesis H 0 (“The population mean is this…”) and the alternative hypothesis Ha Step 2 Identify the appropriate test statistic and its probability distribution, e. g. z-, t-, chi-squared or f-test Step 3 Specify the significance level Step 4 State the decision rule Step 5 Collect the data and calculate the test statistic Step 6 Make the statistical decision. Reject the hypothesis if the test statistic is beyond the critical value Step 7 Make the economic or investment decision One-tailed and two-tailed tests Basis of computing reliability factors Hypothesis formulations Two-tailed test Parameter Test Single mean z-statistic/tstatistic Two means t-statistic Single variance Chi-squared test Two variances F-test One-tailed test H 0: μX μ 0 H 0: μX ≥ μ 0 Ha: μX ≠ μ 0 Ha: μX < μ 0 Test statistic Knowledge | Skills | Conduct
Contact Europe Steve Brady T: +44 (0) 207 496 8295 E: steve. brady@fitchlearning. com