Canadian Natural Resources Penn West Energy Trust Agenda





















- Slides: 84
Canadian Natural Resources & Penn West Energy Trust
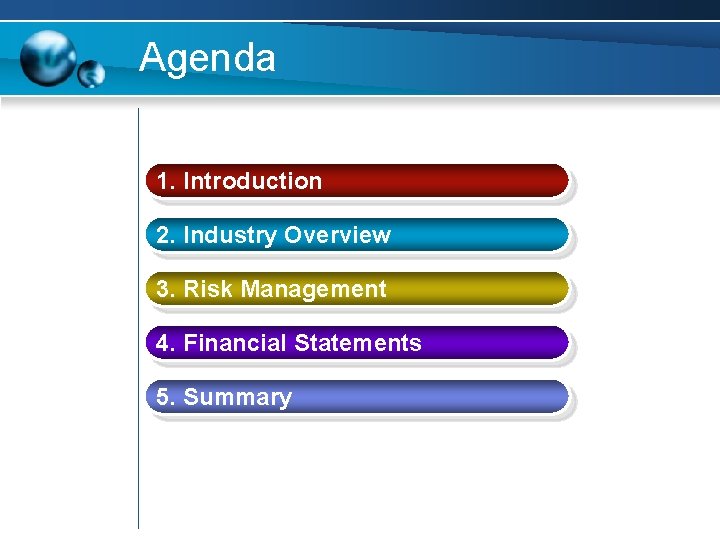
Agenda 1. Introduction 2. Industry Overview 3. Risk Management 4. Financial Statements 5. Summary
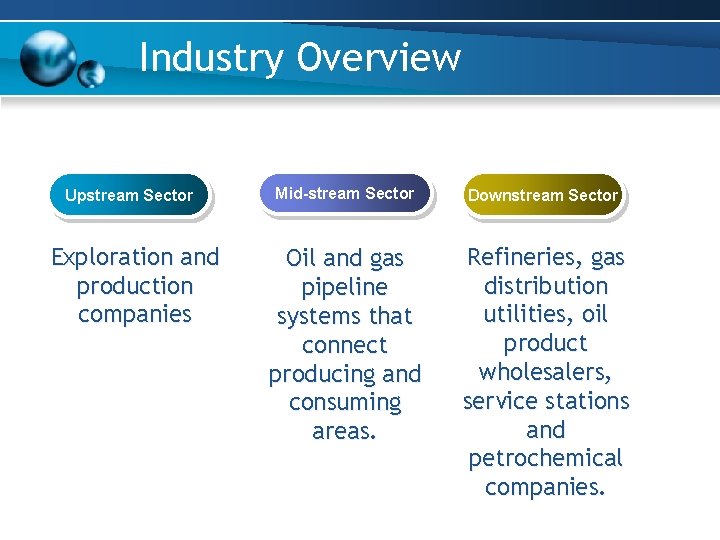
Industry Overview Upstream Sector Exploration and production companies Mid-stream Sector Downstream Sector Oil and gas pipeline systems that connect producing and consuming areas. Refineries, gas distribution utilities, oil product wholesalers, service stations and petrochemical companies.
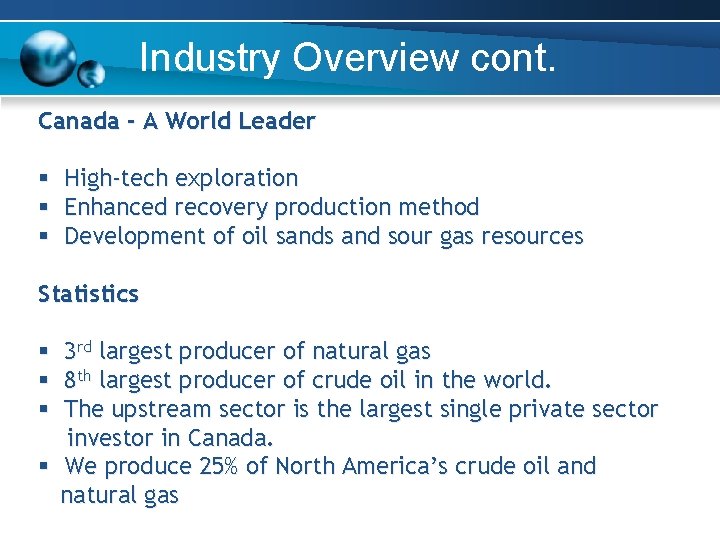
Industry Overview cont. Canada - A World Leader § § § High-tech exploration Enhanced recovery production method Development of oil sands and sour gas resources Statistics 3 rd largest producer of natural gas 8 th largest producer of crude oil in the world. The upstream sector is the largest single private sector investor in Canada. § We produce 25% of North America’s crude oil and natural gas § § §
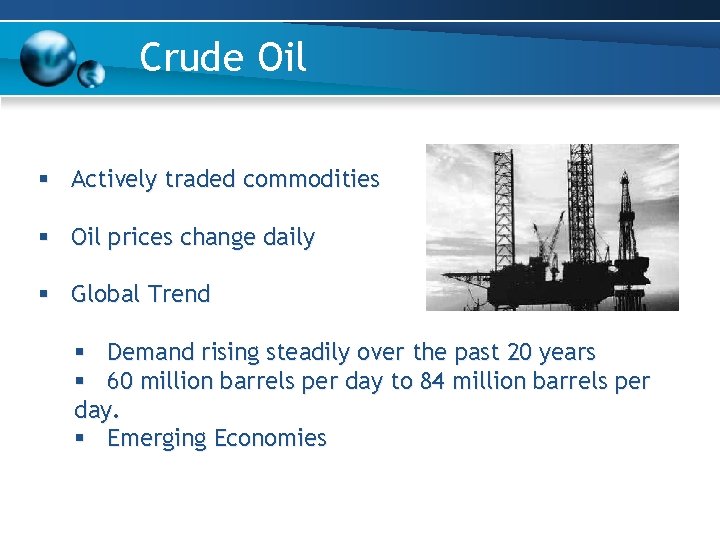
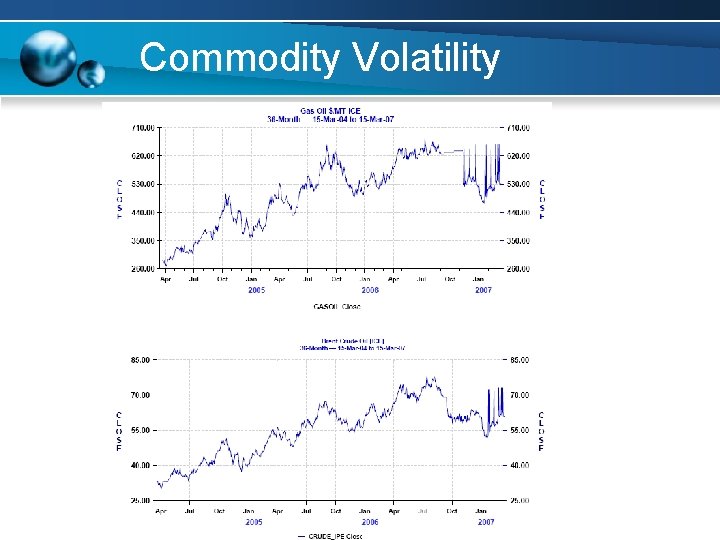
Crude Oil § Actively traded commodities § Oil prices change daily § Global Trend § Demand rising steadily over the past 20 years § 60 million barrels per day to 84 million barrels per day. § Emerging Economies
Commodity Volatility
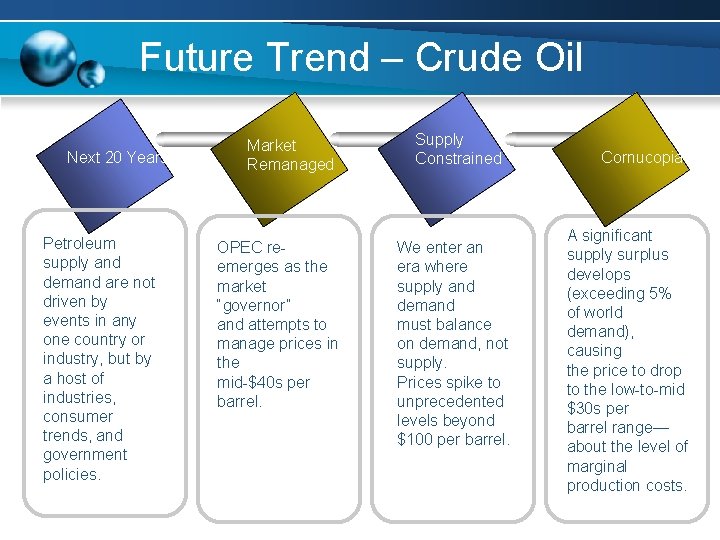
Future Trend – Crude Oil Next 20 Years Petroleum supply and demand are not driven by events in any one country or industry, but by a host of industries, consumer trends, and government policies. Market Remanaged OPEC reemerges as the market “governor” and attempts to manage prices in the mid-$40 s per barrel. Supply Constrained We enter an era where supply and demand must balance on demand, not supply. Prices spike to unprecedented levels beyond $100 per barrel. Cornucopia A significant supply surplus develops (exceeding 5% of world demand), causing the price to drop to the low-to-mid $30 s per barrel range— about the level of marginal production costs.
Future Trend – Crude Oil
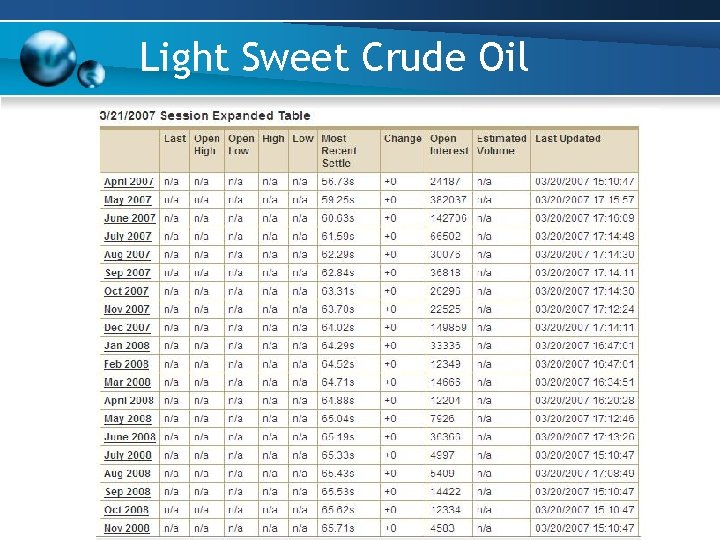
Light Sweet Crude Oil
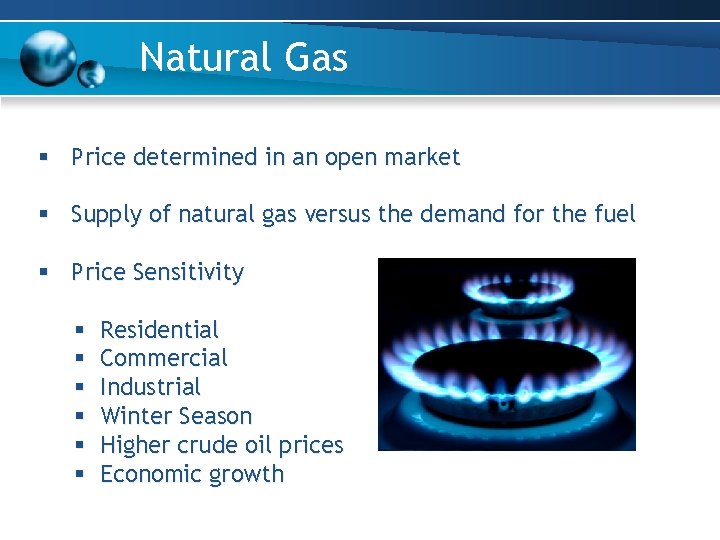
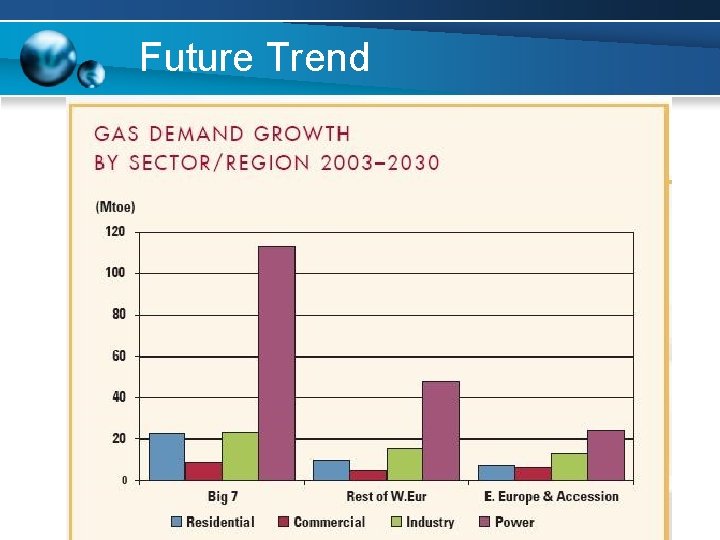
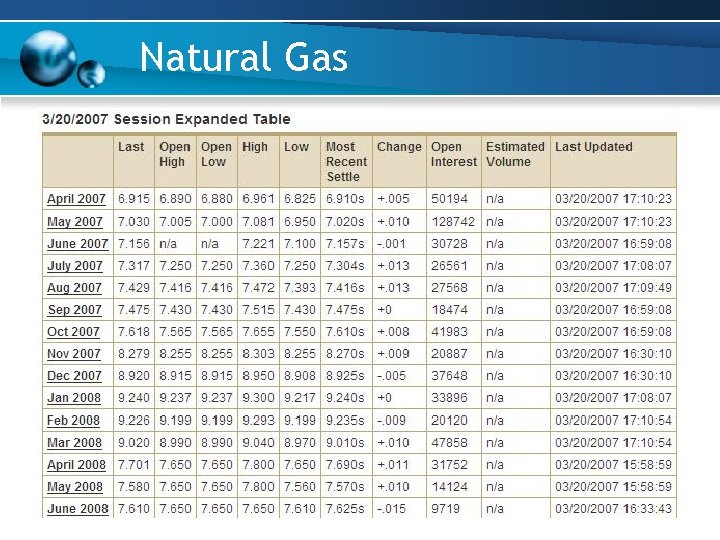
Natural Gas § Price determined in an open market § Supply of natural gas versus the demand for the fuel § Price Sensitivity § § § Residential Commercial Industrial Winter Season Higher crude oil prices Economic growth
Future Trend
Natural Gas
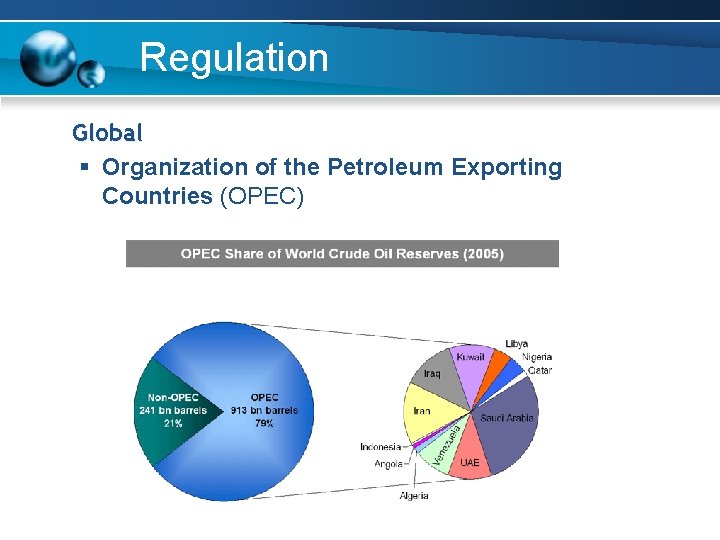
Regulation Global § Organization of the Petroleum Exporting Countries (OPEC)
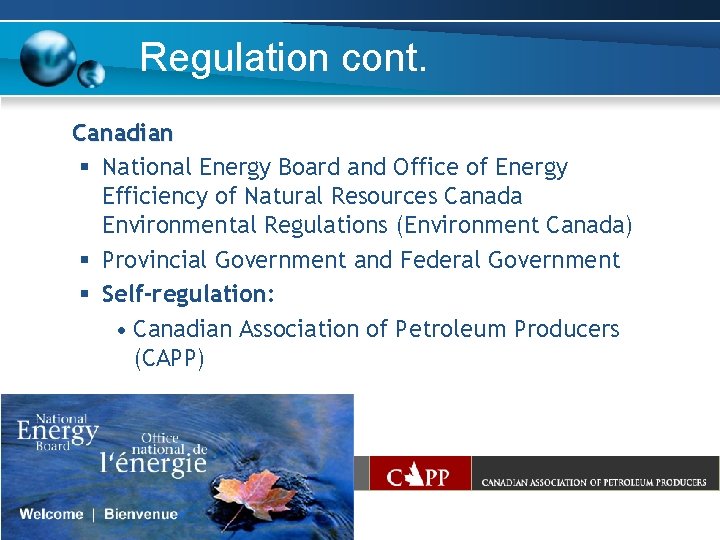
Regulation cont. Canadian § National Energy Board and Office of Energy Efficiency of Natural Resources Canada Environmental Regulations (Environment Canada) § Provincial Government and Federal Government § Self-regulation: • Canadian Association of Petroleum Producers (CAPP)
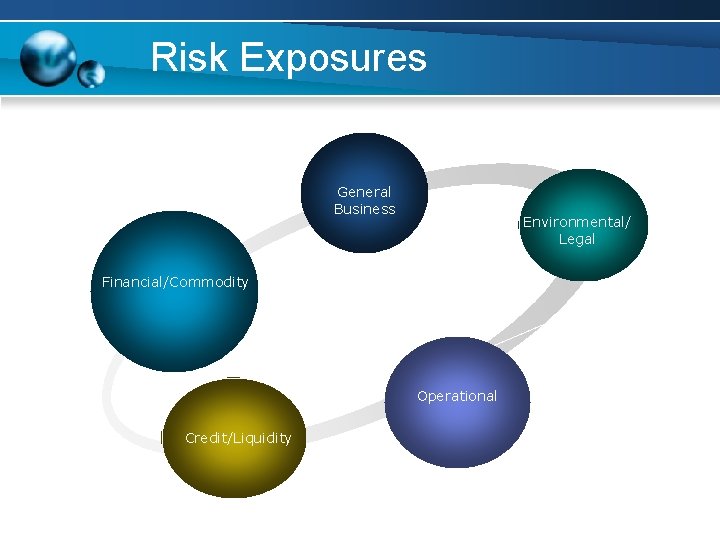
Risk Exposures General Business Environmental/ Legal Financial/Commodity Operational Credit/Liquidity
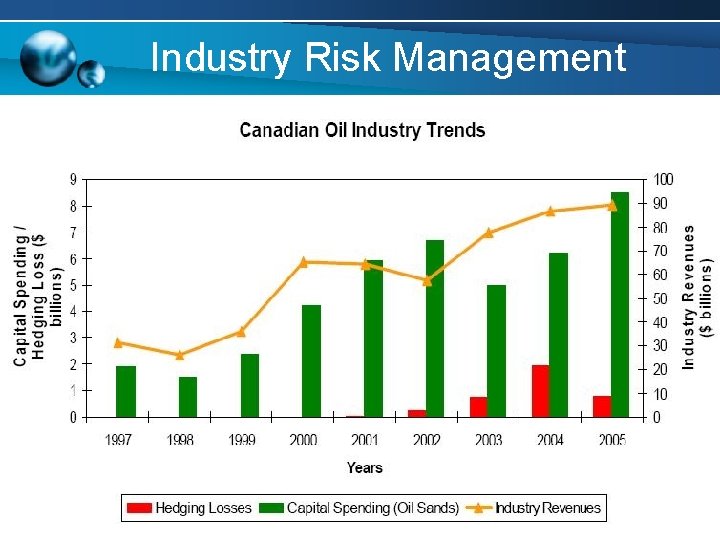
Industry Risk Management • Objective • Reduce the risk of adverse price changes in the physical market • Perhaps to make a profit • How? • Determines a hedge ratio • Optimal hedge ratios should be time-varying For example, a hedging program covering 50%– 60% of total production is far more common with trusts than in the Exploration &Production sector
Industry Risk Management • Trans. Canada Corp, Nexen Inc, Talisman Energy Inc - No clear hedging strategies – Minor oil stake -> all hedged • Encana Corp - Mainly fixed price contracts, collars, puts and calls • Suncor Energy Inc ($9. 7 B in revenue) – Hedged 36%, 16% and 9 % (2003 -2005) -> losses $550 M
Industry Hedgers • Husky Energy Inc ($10 B in revenue) – Hedging no more than 50% of production (2003 -2004) -> losses $670 M • CNRL ($7 B in revenue) – Horizon Oil Sands Project ($10. 8 B in 10 yrs) – Largest hedge loser (close to $1 B) – Continues to hedge into 2007 (US $50/barrel)
Industry Risk Management
Canadian Natural Resources NYSE: CNQ TSE: CNQ and CNQ. U
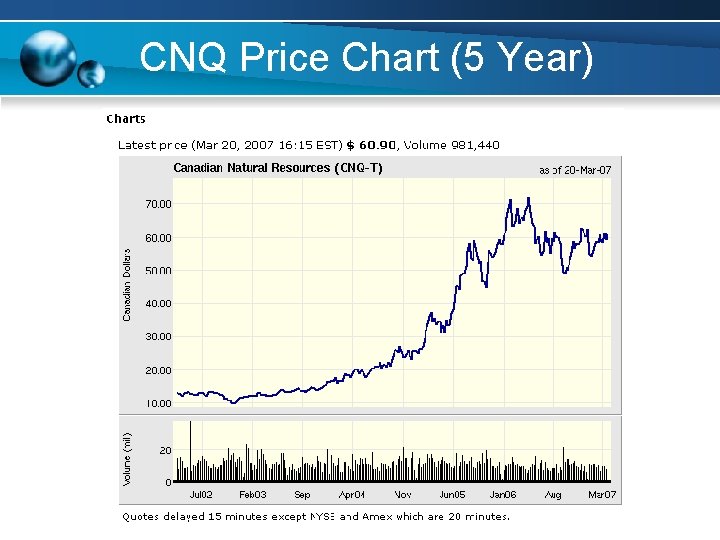
Corporate Profile Incorporated November 7, 1973, in Alberta, Canada Senior Oil and Natural Gas Exploration & Production Common Shares: NYSE: CNQ and TSE: CNQ Current Stock Price as of March 20, 2007: $60. 90 (CAD) Market Capitalization: 27. 23 B (USD) Total Shares Outstanding: 537. 90 M
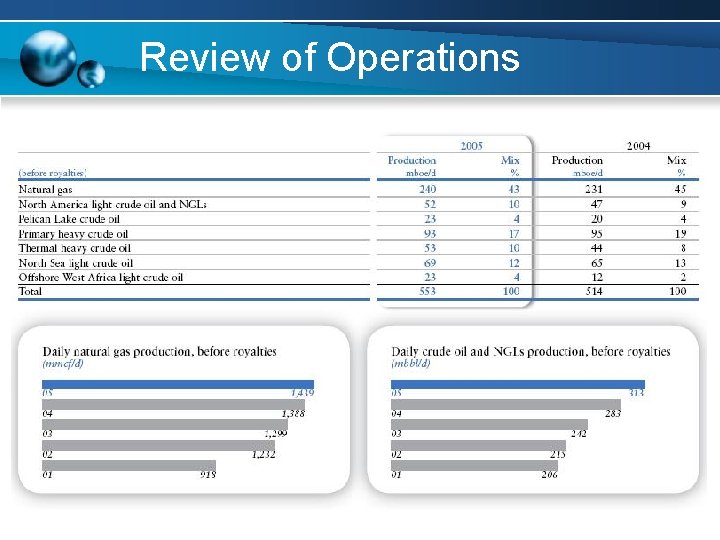
Profile ØCanadian Natural Resources is the second-largest natural -gas producer in Canada. ØTheir international properties in the North Sea and West Africa has boosted oil production to 57% of the total. ØIn 2005, the firm produces 553, 000 gross barrels of oil equivalent per day and posted approximately 3. 7 billion barrels of gross proved reserves, including oil sands resources.
Review of Operations
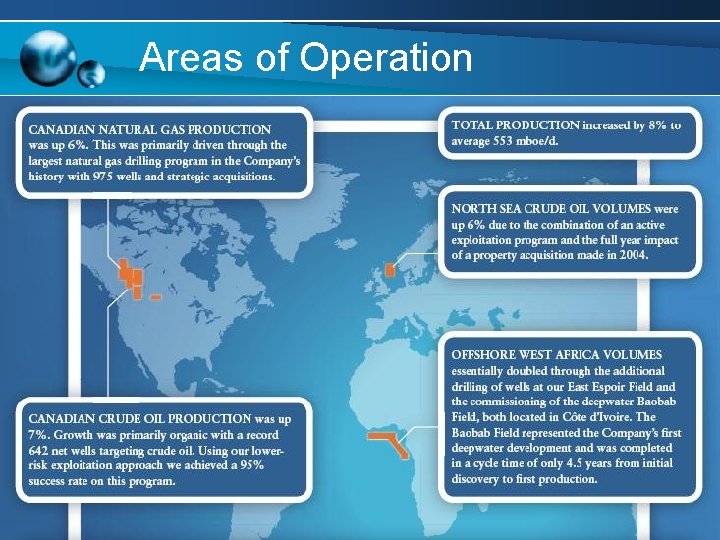
Areas of Operation
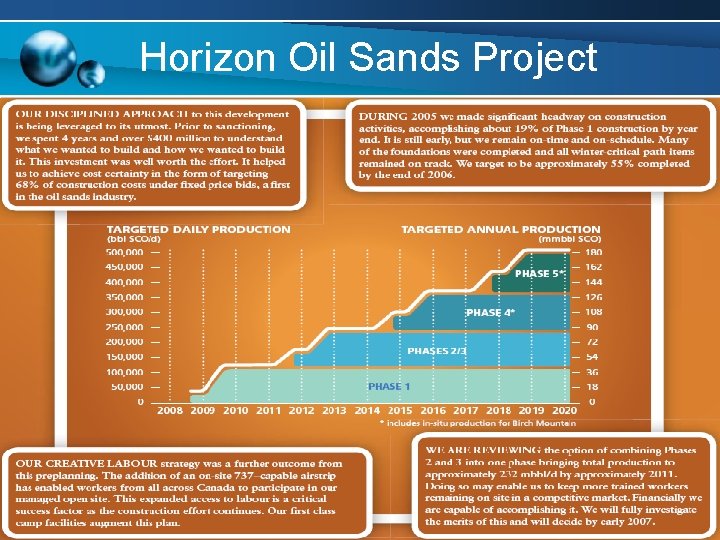
Horizon Oil Sands Project
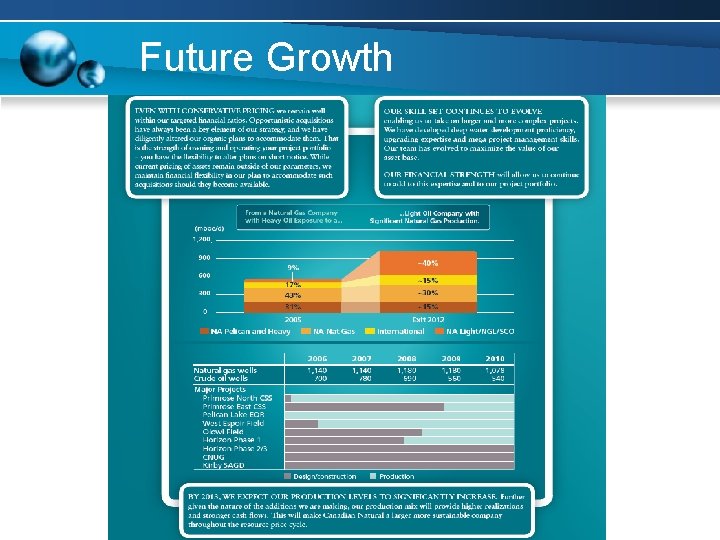
Future Growth
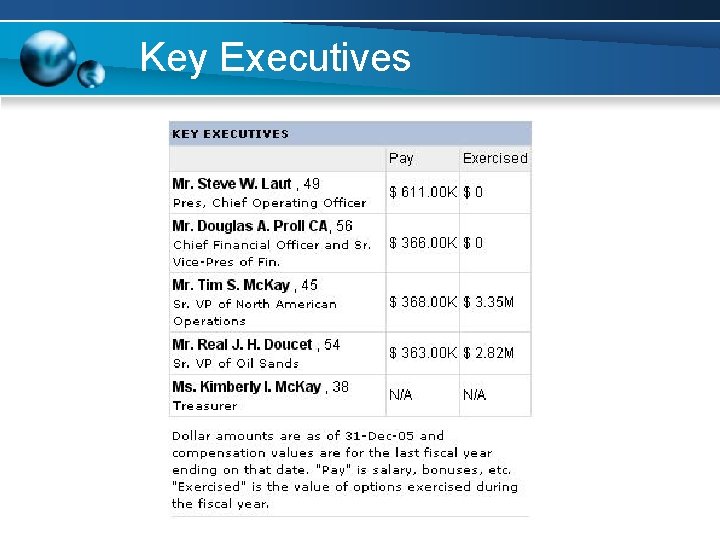
Key Executives
CNQ Management Team Steve Laut Current Position: President and Chief Operating Officer Education: U. of Calgary - BSc – Mechanical Engineering Previous Positions: Vice President of Operations Vice President of Engineering Manager, Exploitation Senior Exploitation Engineer
CNQ Stock Today
CNQ Price Chart (5 Year)
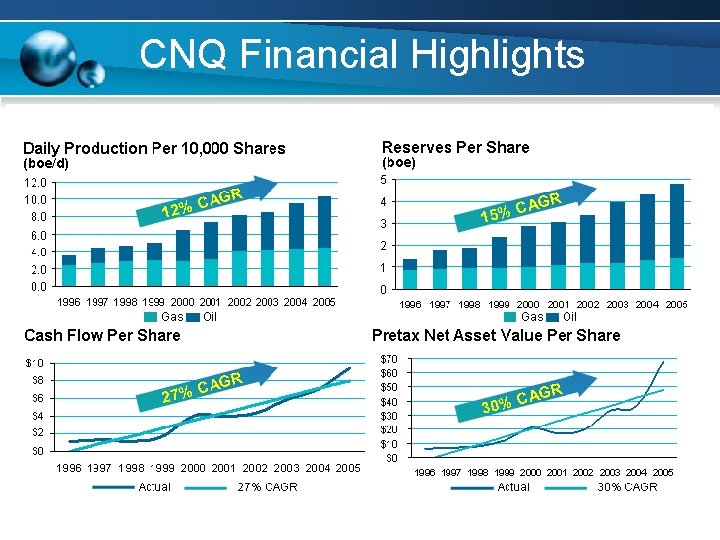
CNQ Financial Highlights
CNQ Financial Highlights § Slight decline in net earnings mainly due to funding for the Horizon Oil Sand Project § Increase in dividend per common share indicates confidence of properity in the long run
Consolidated Statement of Earnings
Consolidated Balance Sheets
Consolidated Statements of Cash Flows
Risks and Uncertainties
Hedging Philosophy “Canadian Natural utilizes hedging techniques to provide some assurance on price realizations and to protect cash flow generation capability in order to fund ongoing development programs. ” o. The derivative financial instruments are not intended for trading or speculative purposes. o. The purpose of using derivative financial instruments is to generate stable and predictable cash flows. o. Changes in fair value of derivative financial instruments formally designated as hedges are not recognized in net earnings until such time as the corresponding gains or losses on the related hedged items are also recognized. o Changes in the fair value of derivative financial instruments not formally designated as hedges are recognized in the balance sheet each period with the offset reflected in risk management activities in the consolidated statements of earnings.
Risk Management Activities Commodity Price Risk • Oil and Gas Prices Currency Risk • US Dollar Denominated Debt Interest Rate Risk • Fixed/Floating Inflows and Outflows
Commodity Price Risk o The company enters into commodity price contracts to manage anticipated sales of crude oil and natural gas. o. Realized gains or losses on these contracts are included in risk management activities. o. Unrealized gains or losses on commodity price contracts not formally documented as hedges are also included in risk management activities.
Currency Risk o. The company’s operating results are affected by fluctuations in the exchange rates between the Canadian dollar, US dollar, and UK pound sterling. o. Majority of revenues are based on reference to US dollar benchmark prices and therefore an increase in the value of the CAD/USD results in decreased revenue from the sale of production. o. Production expenses are subject to fluctuations due to changes in the exchange rate of the UK pound sterling to the US dollar on North Sea operations.
Currency Risk o. Cross-currency swap agreements are used to manage currency exposure on US dollar denominated debt. o. Gains or losses on the foreign exchange component of all cross -currency swap contracts are included in risk management activities. o. Gains or losses on the interest component of cross-currency swap contracts designated as hedges are included in interest expense.
Interest Rate Risk o. The company enters into interest rate swap agreements to manage its fixed to floating interest rate mix on long-term debt. o. The contracts require the periodic exchange of payments without the exchange of the notional principle amounts on which the payments are based. o. Gains or losses on interest rate swap contracts formally designated as hedges are included in interest expense. o. Gains or losses on non-designated interest rate contracts are included in risk management activities.
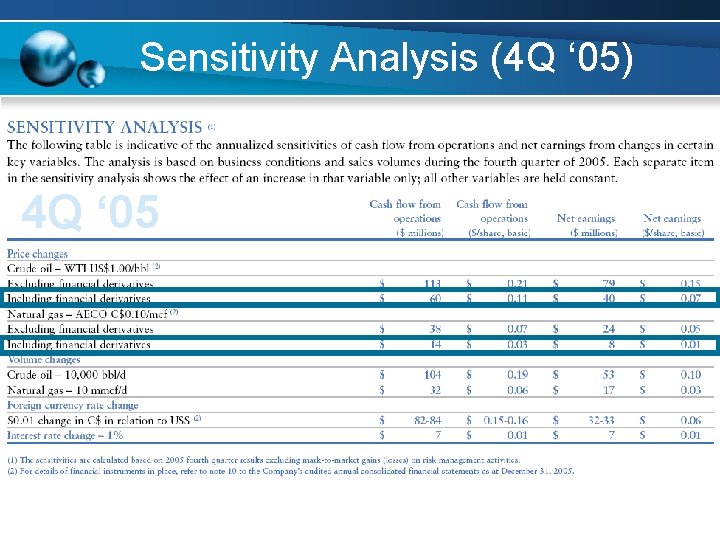
Sensitivity Analysis (4 Q ‘ 05) 4 Q ‘ 05
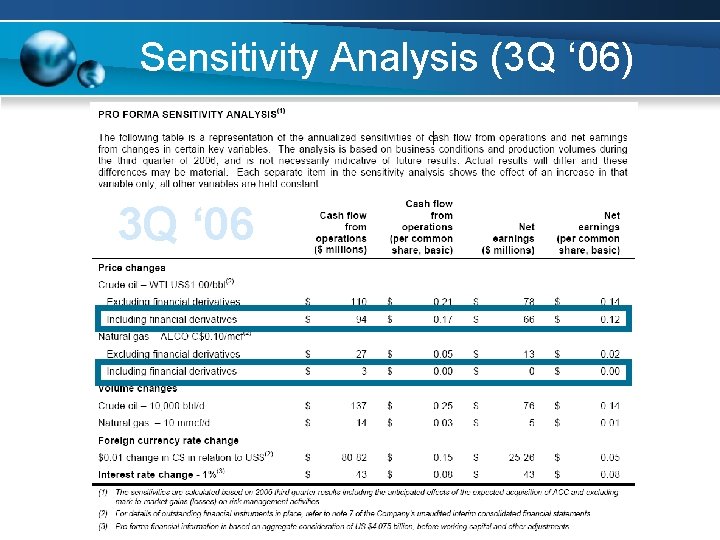
Sensitivity Analysis (3 Q ‘ 06) 3 Q ‘ 06
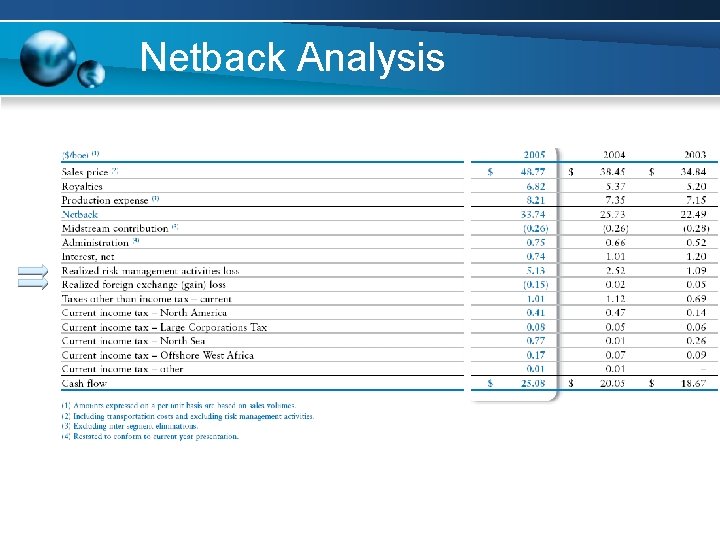
Netback Analysis
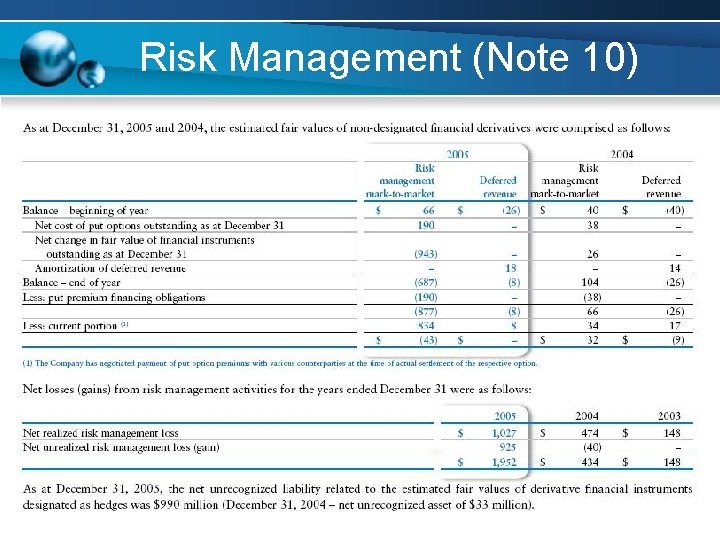
Risk Management (Note 10)
Risk Management Tools §COMMODITY PRICE RISK §Crude Oil §Price Collars §Put Options §Brent Differential Swaps §Natural Gas §AECO Collars (NGX) §INTEREST RATE RISK §Swaps - Fixed to Floating §Swaps – Floating to Fixed §CURRENCY RISK §Swaps (US$/C$)
Commodity Price Risk
Interest Rate Risk
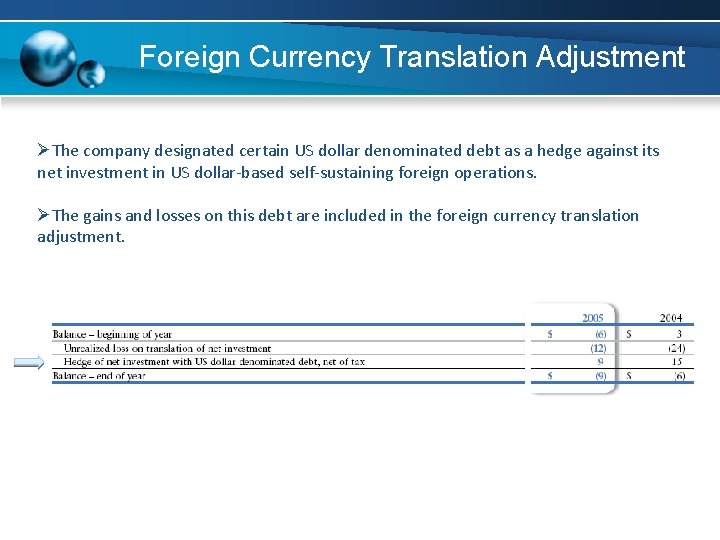
Foreign Currency Translation Adjustment ØThe company designated certain US dollar denominated debt as a hedge against its net investment in US dollar-based self-sustaining foreign operations. ØThe gains and losses on this debt are included in the foreign currency translation adjustment.
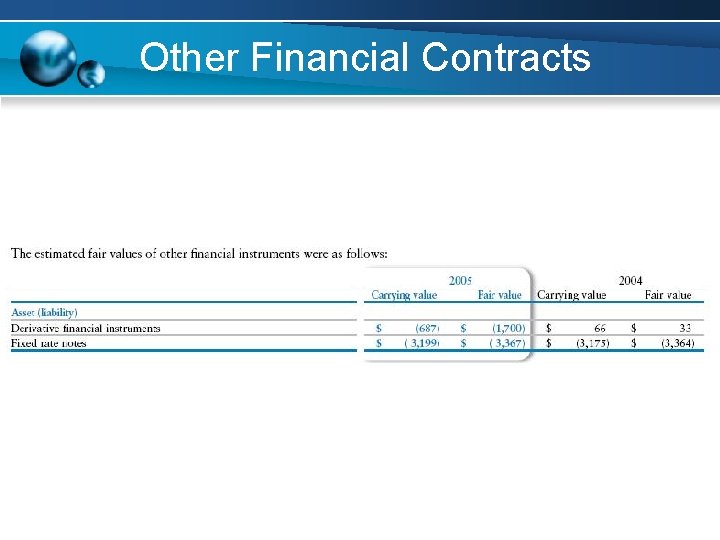
Other Financial Contracts
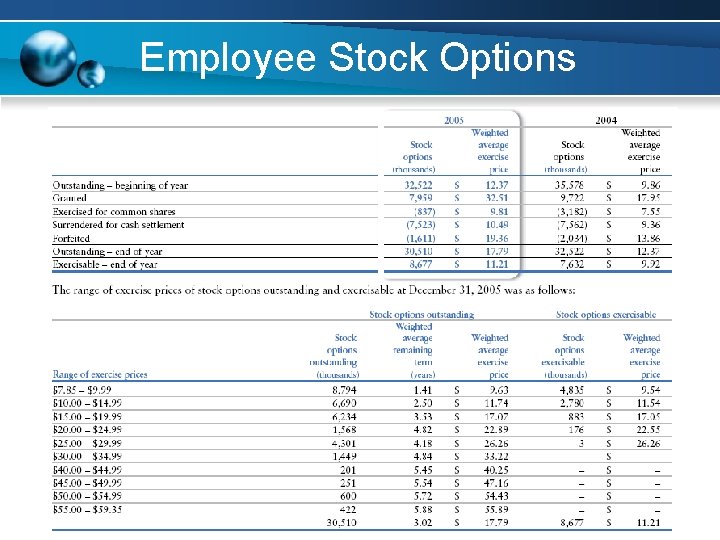
Employee Stock Options ØThe Company’s Stock Option Plan provides current employees with the right to elect to receive common shares or a direct cash payment in exchange for options surrendered. ØOptions are valued based on the difference between the exercise price of the stock options and the market price of the Company’s common shares. ØStock options granted under the Option Plan have a maximum term of six years to expiry and vest equally over a five-year period. ØThe exercise price of each stock option granted is determined at the closing market price of the common shares on the Toronto Stock Exchange on the day prior to the grant. ØEach stock option granted permits the holder to purchase one common share of the Company at the stated exercise price.
Employee Stock Options ØThe expense reflects the Company’s potential cash liability should all the vested options be surrendered for a cash payout at the market price on Dec. 31, 2005. ØFor the year ended Dec. 31, 2005, the Company paid $227 million for stock options surrendered for cash settlement (Dec. 31, 2004 – $80 million; 2003 – $31 million).
Employee Stock Options
Counterparty Credit Risk Management ØAccounts receivable are mainly with customers in the crude oil and natural gas industry and are subject to normal industry credit risks. ØThe company manages this risk by entering into sales contracts with only highly rated entities. ØThe company ensures that parental guarantees or letters of credit are in place to minimize the impact in the event of default. ØThe company is also exposed to possible losses in the event of nonperformance by counterparties to derivative financial instruments. ØThis risk is managed by entering into agreements with only highly rated financial institutions and other entities.
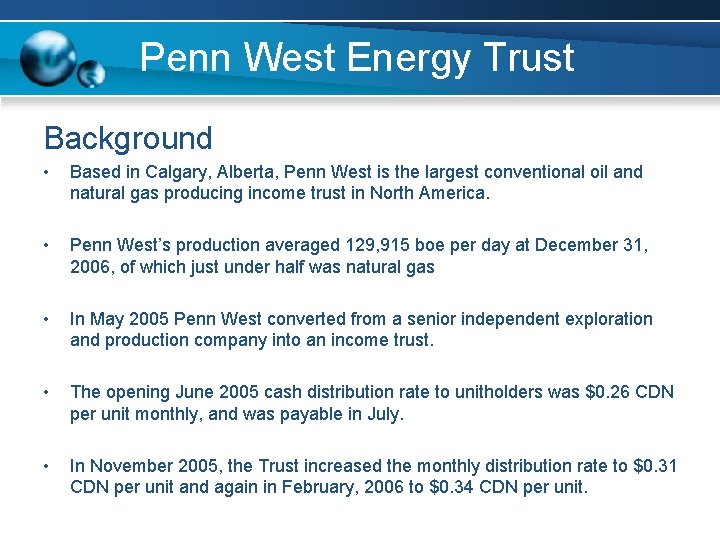
Penn West Energy Trust Background • Based in Calgary, Alberta, Penn West is the largest conventional oil and natural gas producing income trust in North America. • Penn West’s production averaged 129, 915 boe per day at December 31, 2006, of which just under half was natural gas • In May 2005 Penn West converted from a senior independent exploration and production company into an income trust. • The opening June 2005 cash distribution rate to unitholders was $0. 26 CDN per unit monthly, and was payable in July. • In November 2005, the Trust increased the monthly distribution rate to $0. 31 CDN per unit and again in February, 2006 to $0. 34 CDN per unit.
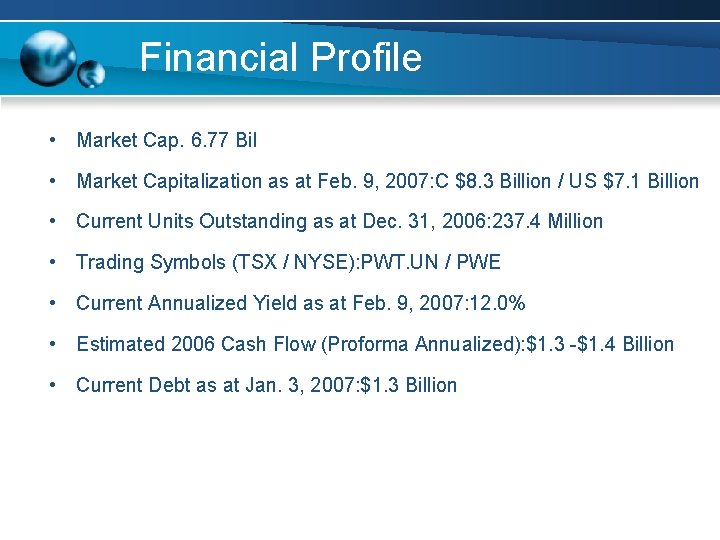
Financial Profile • Market Cap. 6. 77 Bil • Market Capitalization as at Feb. 9, 2007: C $8. 3 Billion / US $7. 1 Billion • Current Units Outstanding as at Dec. 31, 2006: 237. 4 Million • Trading Symbols (TSX / NYSE): PWT. UN / PWE • Current Annualized Yield as at Feb. 9, 2007: 12. 0% • Estimated 2006 Cash Flow (Proforma Annualized): $1. 3 -$1. 4 Billion • Current Debt as at Jan. 3, 2007: $1. 3 Billion
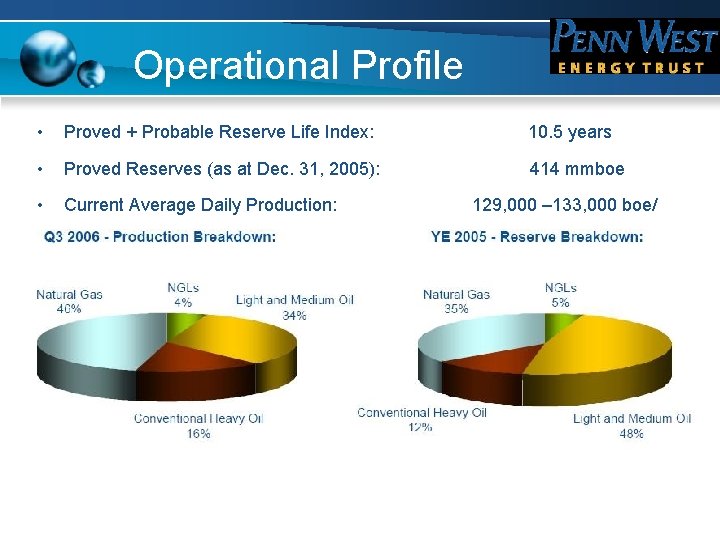
Operational Profile • Proved + Probable Reserve Life Index: 10. 5 years • Proved Reserves (as at Dec. 31, 2005): 414 mmboe • Current Average Daily Production: 129, 000 – 133, 000 boe/
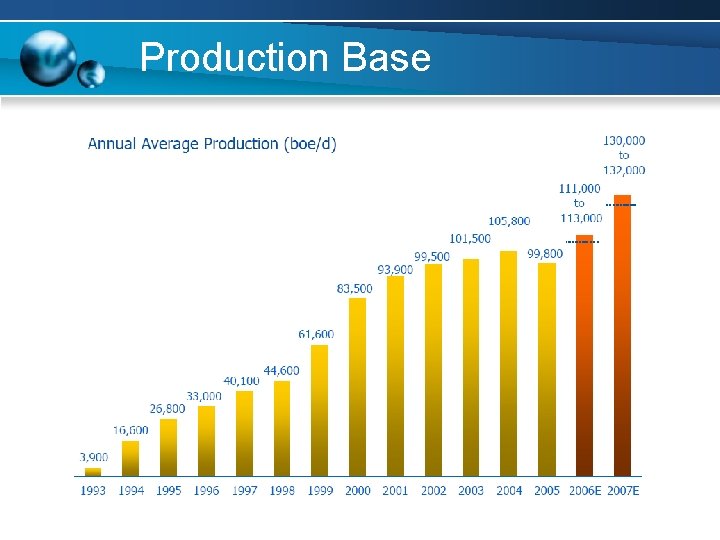
Production Base
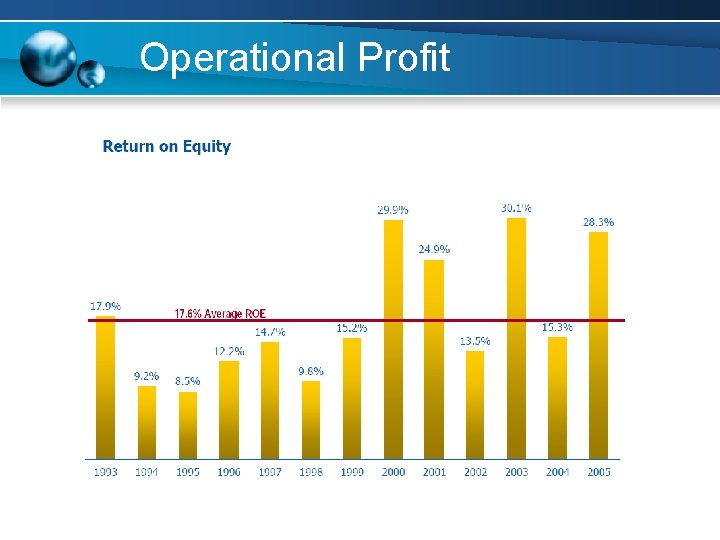
Operational Profit
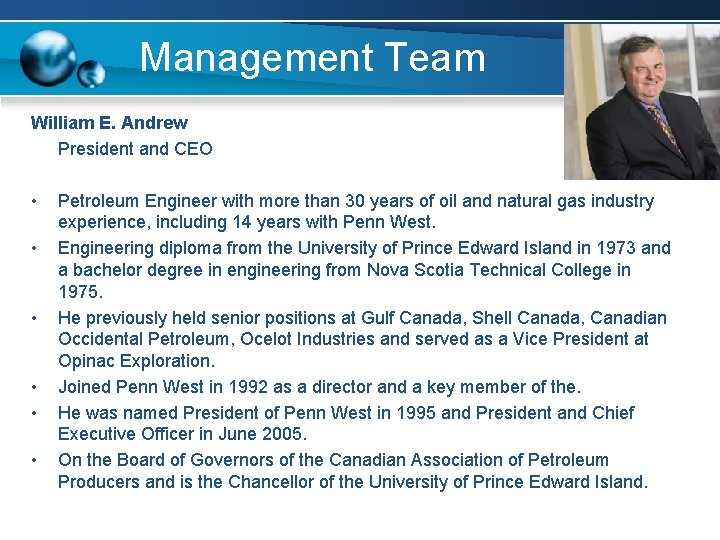
Management Team William E. Andrew President and CEO • • • Petroleum Engineer with more than 30 years of oil and natural gas industry experience, including 14 years with Penn West. Engineering diploma from the University of Prince Edward Island in 1973 and a bachelor degree in engineering from Nova Scotia Technical College in 1975. He previously held senior positions at Gulf Canada, Shell Canada, Canadian Occidental Petroleum, Ocelot Industries and served as a Vice President at Opinac Exploration. Joined Penn West in 1992 as a director and a key member of the. He was named President of Penn West in 1995 and President and Chief Executive Officer in June 2005. On the Board of Governors of the Canadian Association of Petroleum Producers and is the Chancellor of the University of Prince Edward Island.
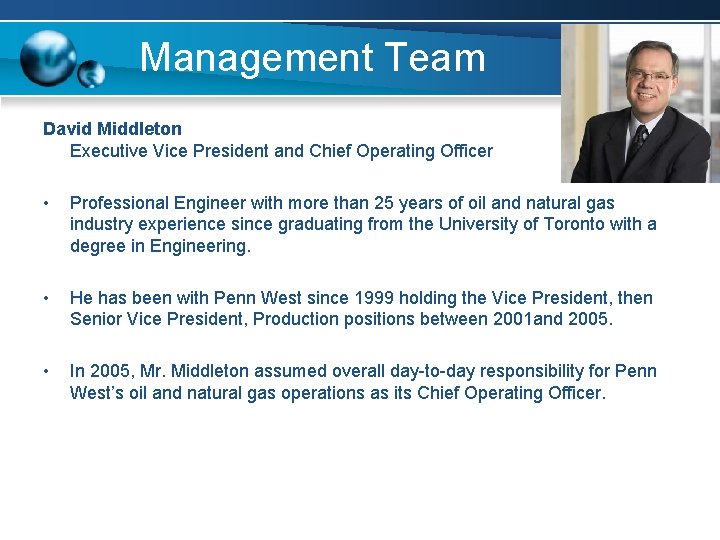
Management Team David Middleton Executive Vice President and Chief Operating Officer • Professional Engineer with more than 25 years of oil and natural gas industry experience since graduating from the University of Toronto with a degree in Engineering. • He has been with Penn West since 1999 holding the Vice President, then Senior Vice President, Production positions between 2001 and 2005. • In 2005, Mr. Middleton assumed overall day-to-day responsibility for Penn West’s oil and natural gas operations as its Chief Operating Officer.
Management Team Todd Takeyasu Senior Vice President, and Chief Financial Officer • Chartered Accountant and a Certified Internal Auditor with more than 23 years of oil and natural gas industry and public accounting experience. • He has been with Penn West since 1994 in various positions including Financial Controller, Treasurer from 2001 to 2005 and Vice President, Finance until 2006 when he was promoted to Chief Financial Officer. • He is a 1983 business school graduate of the University of Lethbridge.
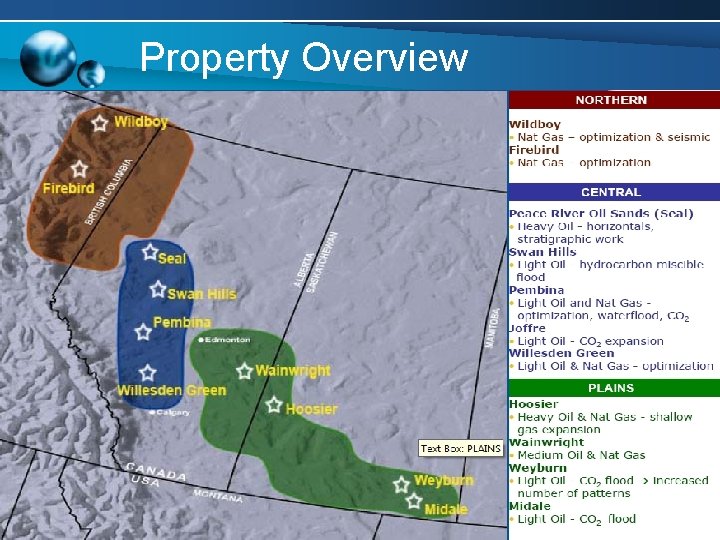
Property Overview
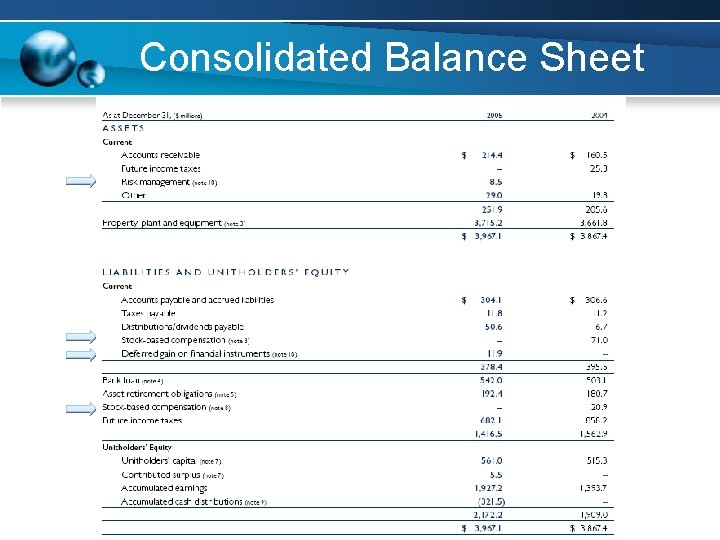
Consolidated Balance Sheet
Consolidated Income Statement
Statements of Cash Flow
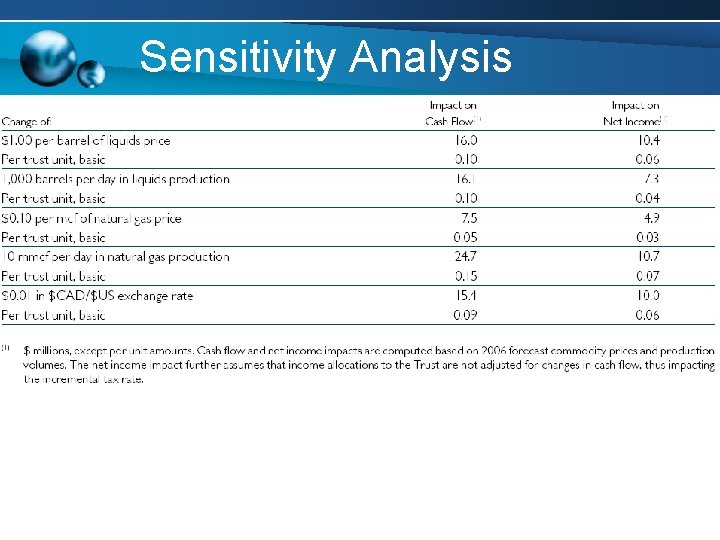
Sensitivity Analysis
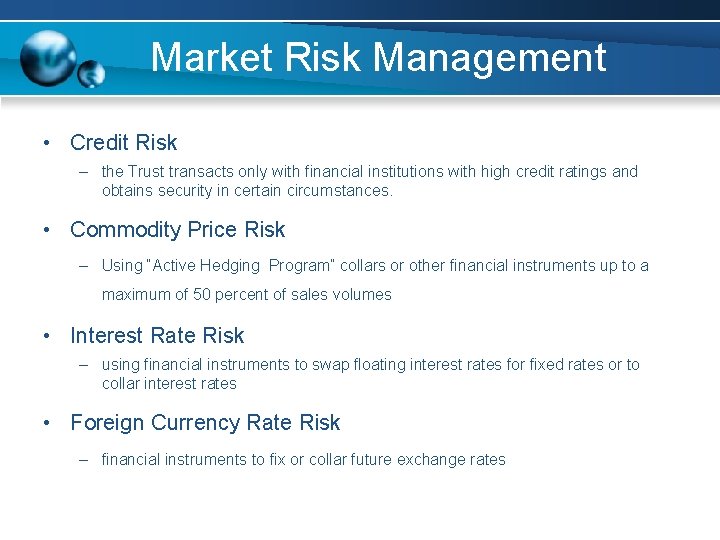
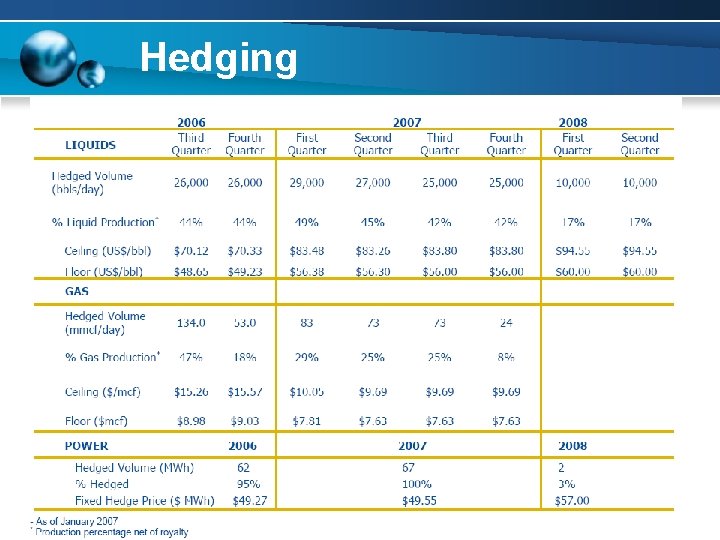
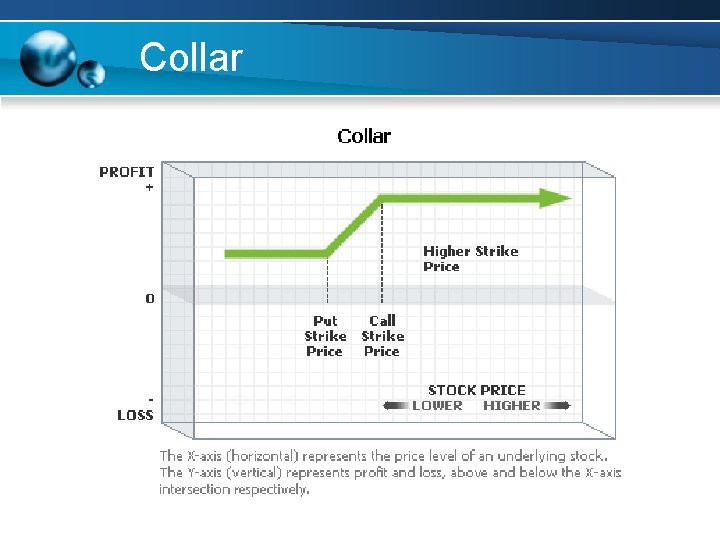
Market Risk Management • Credit Risk – the Trust transacts only with financial institutions with high credit ratings and obtains security in certain circumstances. • Commodity Price Risk – Using “Active Hedging Program” collars or other financial instruments up to a maximum of 50 percent of sales volumes • Interest Rate Risk – using financial instruments to swap floating interest rates for fixed rates or to collar interest rates • Foreign Currency Rate Risk – financial instruments to fix or collar future exchange rates
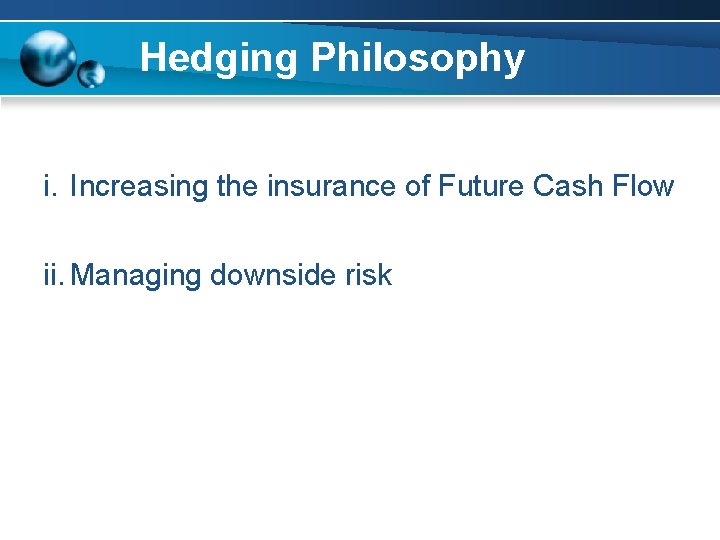
Hedging Philosophy i. Increasing the insurance of Future Cash Flow ii. Managing downside risk
Hedging
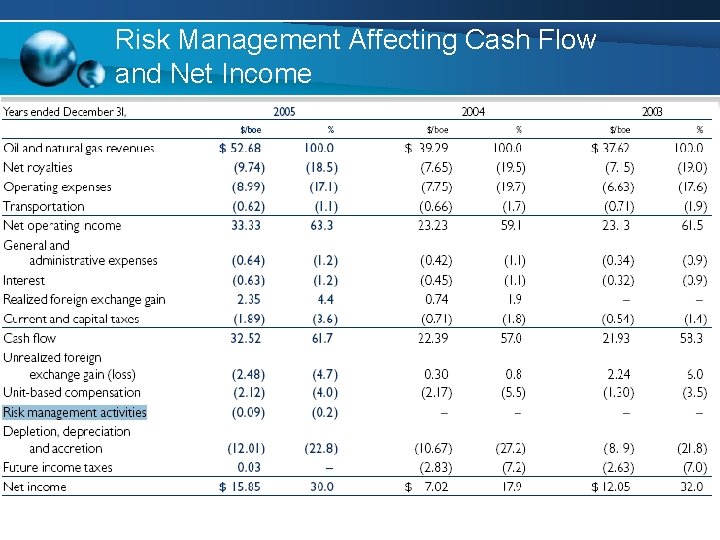
Risk Management Affecting Cash Flow and Net Income
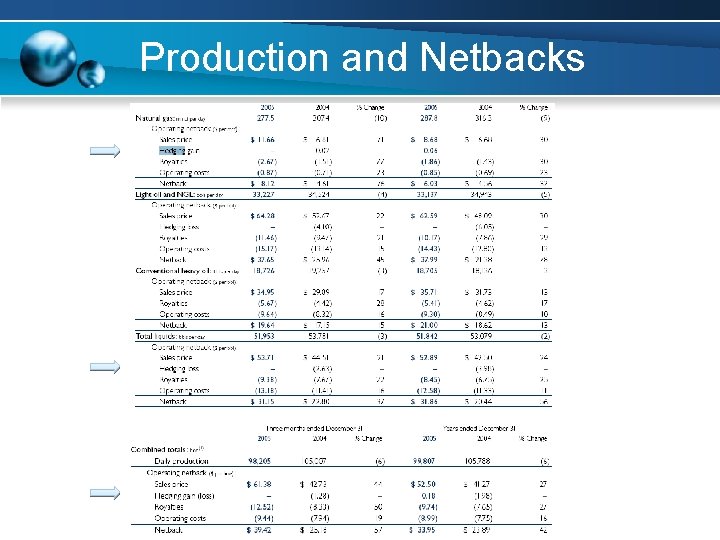
Production and Netbacks
Foreign Exchange • During Q 1 2005, the Trust converted US$205 million of its US denominated borrowings to Canadian dollars at an average exchange rate of $0. 829 CAD/USD resulting in a realized foreign exchange gain of $63 million. • In May 2005, the Trust converted its remaining US$85 million of US denominated borrowings to Canadian dollars at an average exchange rate of $0. 803 CAD/USD and realized an additional $23 million foreign exchange gain
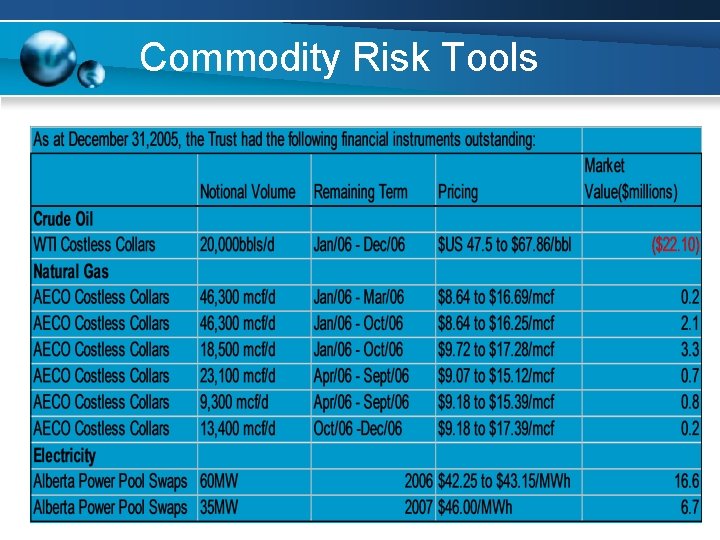
Commodity Risk Tools
Collar
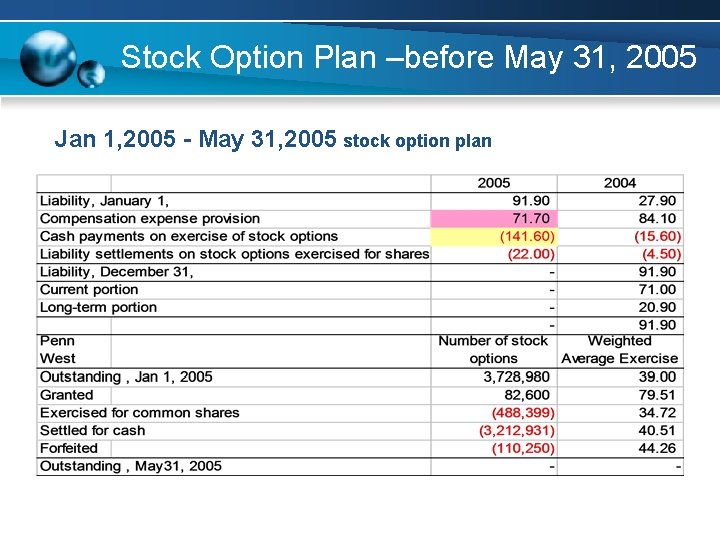
Stock Option Plan –before May 31, 2005 Before May 31, 2005 Stock Option Plan • Stock option plan for the benefits of employees and directors • Stock options vested over a five-year period, and if unexercised, expired six years from the date of grant. • Cash settlement alternatives or unit shares • Stock compensation costs were recorded based on changes to the share price at the end of each quarter and any changes to the number of outstanding options • Pursuant to the plan of arrangement, all stock options outstanding on the date of conversion were settled for cash of $84. 77 per share or by issuing shares.
Stock Option Plan –before May 31, 2005 Jan 1, 2005 - May 31, 2005 stock option plan
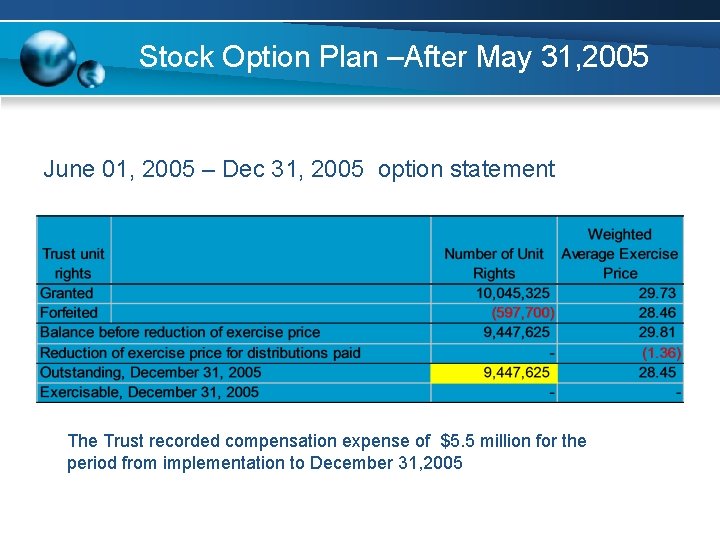
Stock Option Plan- after May 31, 2005 • After May 2005, Replace old plan with Trust unit rights incentive plan • The number of trust units reserved for issuance shall not at any time exceed 10 percent of the aggregate number of issued and outstanding trust units of the Trust • Unit right exercise prices are equal to the market price for the trust units based on the five-day weighted average market price prior to the date the unit rights are granted • If certain conditions are met, the exercise price per unit is reduced by deducting from the grant price the aggregate of all distributions, on a per unit basis, paid by the Trust after the grant date • Rights granted under the plan vested over a five year period and expire six year after the date of the grant • The compensation expense is based on the fair value of rights issued and is amortized over the remaining vesting periods on a straight line basis
Stock Option Plan –After May 31, 2005 June 01, 2005 – Dec 31, 2005 option statement The Trust recorded compensation expense of $5. 5 million for the period from implementation to December 31, 2005
Black-Scholes Option Pricing Black-Scholes option pricing model assumptions:
Employee Trust Unit Savings Plan • Employees may elect to contribute up to 10 percent of their salary and contributions are used to fund the acquisition of trust unit • The Trust matches employee contributions at a rate of $1. 5 for each $1. 0 contributed • Trust units may be issued from treasury at the five-day weighted average month-end market price or purchased in the open market
Employee Trust Unit Savings Plan • During 2005, 20, 355 employer contribution shares (equivalent to 61, 065 trust units) were purchased in the open market at an average price of $81. 48 per share ($27. 16 per equivalent trust unit) and a total cost of 1. 7 million and 21, 905 shares (equivalent to 65, 715 trust units ) were issued from treasury. • Potential dilution of unit holder’s value