Acoustics Sound Measurements Dr Hassan Hassoon ALDelfi ARCH


 in the static pressure")


 is similar in concept to the")


 • Adding Noise Exposure Durations to Determine Compliance")
 • Sound Level (d. BA, Slow Response)")


- Slides: 41
Acoustics Sound Measurements Dr. Hassan Hassoon ALDelfi ARCH 426
Objectives • 1‐ To Highlight Acoustics’ fundamentals and terminologies. • 2‐ To discuss aspects for applications in built environment. • 3‐ Acoustical Design and Treatment
Sound pressure Sound Pressure : is any deviation( dynamic pressure) in the static pressure of the ambient transmission medium as shown: Sound pressure diagram: 1. silence; 2. audible sound; 3. atmospheric pressure; 4. sound pressure-dynamic pressure
A, B and C Standard filters Countours Standard filter contours are used to make the instrument more nearly approximate the normal human ear. The different contours were intended to match the ear at different sound intensities
Sound Pressure Level Measuring scales Measured or Estimated Sound Pressure Level d. B Resulting with d. B(A) filter Resulting with d. B(B) filter Resulting with d. B(C) filter d. B(A) filter d. B(B) filter d. B(C) filter Octave Band Center Frequency (Hz) 125 250 500 1000 2000 31. 25 62. 5 4000 8000 30 54 60 64 53 48 43 39 32 0 27. 8 43. 9 55. 4 49. 8 48 44. 2 40 30. 9 13 45 56 63 53 48 43 38 29 27 ‐ 39. 4 ‐ 17 ‐ 3 53. 2 ‐ 26. 2 ‐ 9 ‐ 0. 8 59. 8 ‐ 16. 1 ‐ 4 ‐ 0. 2 64 ‐ 8. 6 ‐ 1 0 53 ‐ 3. 2 0 0 48 0 0 0 42. 8 1. 2 0 ‐ 0. 2 38. 2 1 ‐ 0. 8 29 ‐ 1. 1 ‐ 3
Sound Pressure Level The human ear can hear a broad range of sound pressures. Because of this, the sound pressure level (SPL) is measured in decibels (d. B) on a logarithmic scale that compresses the values into a manageable range. In contrast, direct pressure is measured in Pascals (N/ N/m 2) SPL is calculated as 10 times the logarithm of the square of the ratio of the instantaneous pressure fluctuations (above and below atmospheric pressure) to the reference pressure: SPL = 10 × log 10(P/Pref)2 P is the instantaneous sound pressure, in units Pa or N/m 2 and Pref = 20 x 10‐ 6 is the reference pressure Reference pressure defined as the quietest noise a healthy young person can hear (20 µPa).
Example If a piece of equipment has a sound pressure of 2 Pa, what will be the resulting sound pressure level ? SPL = 10 × log 10(P/Pref)2 SPL = 20 × log 10(P/Pref) Substitute in above SPL = 20 log 10 (2/0. 00002) = 20 log 10(100, 000) = 20 × 5. 0 = 100 d. B
Sound Power Level • Sound Power Level (Lw) is similar in concept to the wattage of a light bulb. . In fact, Lw or (SWL)is measured in watts (W). Unlike Lp (SPL). Lw does not depend on the distance from the noise source. The sound power level is calculated using the following equation: SWL=Lw = 10 × log 10(W/Wref) Where W is the acoustic power in watts and Wref is the reference acoustic power, 10‐ 12
Example The sound power level associated with a typical face‐to‐face conversati on, which may have a sound power of 0. 00001 W, is calculated: SWL= Lw = 10 × log 10(0. 00001/10‐ 12) = 70 d. B
Sound Wave • In a sound wave, the complementary variable to sound pressure is the particle velocity. Together they determine the sound intensity of the wave. • Sound intensity, denoted I and measured in W/m 2 in SI units, is defined by I = pv………. W/m 2 • p is the sound pressure; N/m 2 • v is the particle velocity. m/S
Noise: is defined as the unwanted sound which causes unpleasant and discomfort to ears. • Noise can come from many places, types of noise sources are: 1‐Gadgets like food mixer, grinder, vacuum cleaner, washing machine and dryer, cooler, air conditioners, can be very noisy and injurious to health. Others include loud speakers of sound systems and TVs, ipads and ear phones. Another example may be your neighbor’s dog barking all night everyday at every shadow it sees, disturbing everyone else in the apartment. 2‐Social events: Places of discos, parties and other social events also create a lot of noise for the people living in that area. In many market areas, people sell with loud speakers, others shout offers and try to get customers to buy their goods. It is important to note that whey these events are not often, they can be called 'Nuisance' rather than noise pollution. ( ISAAJ)
3‐Commercial and industrial activities: Printing presses, manufacturing industries, construction sites, contribute to noise pollutions in large cities. In many industries, it is a requirement that people always wear earplugs to minimize their exposure to heavy noise. People who work with lawn mowers, tractors and noisy equipment are also required to wear noise‐proof gadgets. 4‐Transportation: Think of aero planes flying over houses close to busy airports like Dubai Baghdad, and Erbil Airports, over ground and underground trains, vehicles on road—these are constantly making a lot of noise and people always struggle to cope with them.
Nuisance : A few good examples of nuisance include: • Barking dogs • Building and construction site noise (please note however that noisy Work is permitted between 8 am and 6 pm Sunday to Thursday, and 8 am to 1 pm on Saturdays) • DIY noise during anti‐social hours • Burglar / car alarms • Noisy deliveries at unreasonable hours • Parties, Nightclubs and pubs • Loud music / television / computer games • Industrial processes (dry cleaners, factories etc) • Kitchen extract / air conditioning units • Open‐air event and street performers
Room Acoustics: • There are many factors that influence the sound in a given space: • Room Size: the longer dimension should contain the low frequency wave for good listening, larger size larger loudspeaker and low size smaller size loudspeaker. f = c / λ = wave speed c (m/s) / wavelength λ (m). The formula for time is: T (period) = 1 / f (frequency). λ = c / f = wave speed c (m/s) / frequency f (Hz). The unit hertz (Hz) was once called cps = cycles per second. the speed of sound is 343. 2 metres or 1, 236 km/h
Materials • Rigidity And Mass: the more rigid/massive the walls, floor and ceilings in our listening rooms, the less diaphragmatic action and the tighter, more defined and powerful the bass. *(flexture ) Our goal then, is to reduce the amount of diaphragmatic action in the listening room. We can accomplish this task by increasing the mass and rigidity of all surfaces within the listening environment • Reflectivity Live and Dead Rooms: In simple terms, reflectivity is the apparent "liveness" of a room. Professionals prefer the term reverb time( reverberation time) or Rt-60. Rt‐ 60 defined, is the amount of time (in seconds) it takes for a pulsed tone to decay to a level 6 Od. B below the original intensity. A live room has a great deal of reflectivity, and hence a long Rt‐ 60. A dead room has little reflectivity and a short Rt‐ 60.
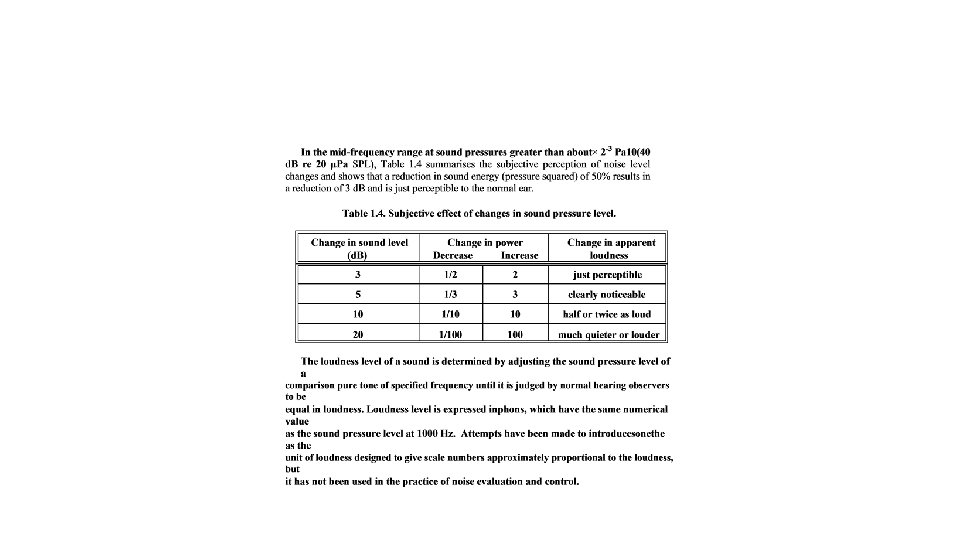
Combining and Averaging Sound Levels Decibels are measured using a logarithmic scale, which means decibels cannot be added arithmetically. For example, if two noise sources are each producing 90 d. B right next to each other, the combined noise level will be 93 d. B, as opposed to 180 d. B. The following equation should be used to calculate the sum of sound pressure levels, sound intensity levels, or sound power levels: Total L = Total SPL = =10 x 9. 3=93 d. B Often, using this equation to quickly sum sound levels when there is no calculator or computer available is difficult. The following table can be used to estimate a sum of various sound levels.
Combining Sound Levels • Difference Between Two Levels to Be Added • Amount to Add to Higher Level to Find the Sum 0– 1 d. B 3 d. B 2– 4 d. B 2 d. B 5– 9 d. B 10 d. B Difference in Levels d. B to be added to the higher level 0 to 1 3 2 to 4 2 5 to 9 1 10 to higher 0 Example: There are three noise sources immediately adjacent to one another, each producing a sound level of 95 d. B. The combined sound level can be found using the table above. Ans: The difference between the first two noise sources is 0 d. B, which means the sum will be 95 + 3 = 98 d. B. The difference between (98 d. B ) and the remaining noise source (95 d. B) is 3, which means the sum will be 98 + 2 = 100 d. B.
Occupational Safety and Health Administration (OSHA) • Adding Noise Exposure Durations to Determine Compliance with OSHA Standards The Act created the Occupational Safety and Health Administration (OSHA), which sets and enforces protective workplace safety and health standards. OSHA also provides information, training and assistance to workers and employers. • Under OSHA standards, workers are not permitted to be exposed to an 8‐hour TWA equal to or greater than 90 d. BA ( Time Weighted Average). OSHA uses a 5‐d. BA exchange rate, meaning the noise level doubles with each additional 5 d. BA. The following chart shows how long workers are permitted to be exposed to specific noise levels:
• Permissible Duration (Hours per Day) • Sound Level (d. BA, Slow Response) 16 85 8 90 4 95 2 100 1½ 102 1 105 ½ 110 ¼ or less 115 Permissible Duration ( Hours per Day) Sound Level d. BA 16 85 8 90 4 95 2 (1/4) 100 (115)
Combining Low and High Sound Levels •
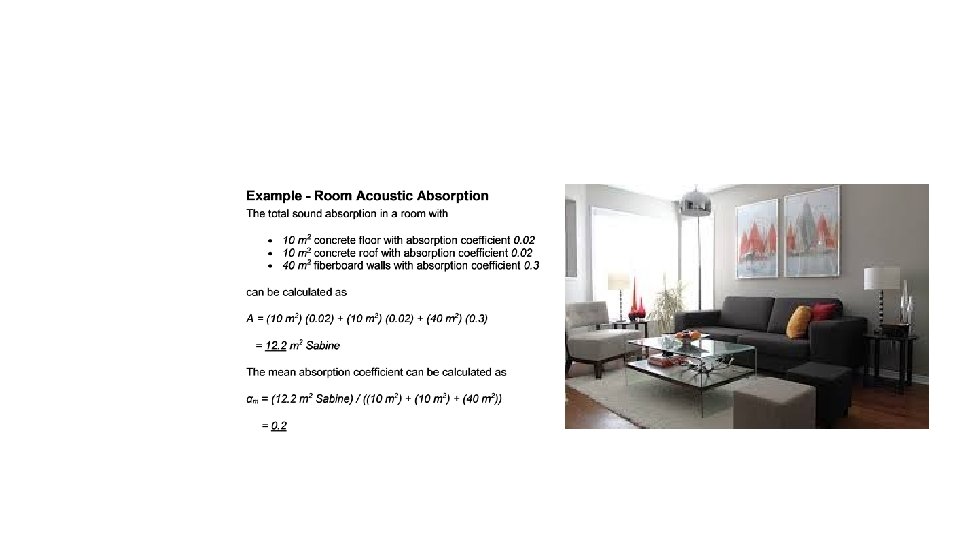
Sound Propagation & Room Attenuation for Sound Levels: • • Reverberation Time ‐ Sound Reverberation Time indicates the time it takes until the sound pressure level in a room is decreased with 60 d. B • • Directivity Coefficient and Sound Attenuation ‐ The attenuation in a room depends on the location of the source and the receiver, and the room constant • • Room Absorption Characteristics ‐ Mean absorption coefficients and reverberation times for some typical rooms • • Room Attenuation in Direct Sound Fields ‐ Room size ‐ absorption characteristics and attenuation in direct sound fields • • Sound Intensity ‐ Sound intensity level is the acoustic power of sound per unit of area in relation to a fixed reference • • Sound Absorption Coefficients for some common Materials ‐ Sound absorption coefficients for some common materials as plaster walls, brickwork, plywood panels etc. . . • • Sound Pressure ‐ Sound Pressure is the force of sound on a surface area perpendicular to the direction of sound
Sound Absorption Materials • The sound absorption coefficient is the ratio of absorbed sound intensity in an actual material to the incident sound intensity and can be expressed as • α = Ia / Ii • Room attenuation ( Lp‐LN) depends on location of source and receiver ‐ and the room constant R • For a continuing sound source the sound level in a room is the sum of Direct and Reverberant Sound. The sound pressure for a receiver can be expressed as • Lp = LN + 10 log (D / (4 π r 2) + 4 / R) (1) • where • Lp = received sound pressure level (d. B) or SPL • LN = sound power level from source (d. B) or SWL • D = directivity coefficient as shown in figure below • R = room constant (m 2 Sabine), OR R = Σ Si αi / (1‐ αm) or R = A / (1‐ αm) …. (2) • π = 3. 14. . . , A= sound absorption in m 2 sabine, Si αi individual service area and absorption coefficient respectively. • r = distance from source (m)
Directivity coefficient - D The figure below can be used to approximate the Directivity coefficient ‐ D ‐ for typical locations of the receiver and the sound source D ‐ directivity coefficient
Attenuation Between Source and Receiver Noise and Attenuation - Noise is usually defined as unwanted sound - noise, noise generation, silencers and attenuation in HVAC systems. The given equation of Lp can be transformed to express the difference between the received sound pressure level and emitted sound power level ‐ the attenuation ‐ as: Lp ‐ LN = 10 log (D / (4 π r 2) + 4 / R) (2) • The room constant express the acoustic property of a room. • R = A / (1‐ αm) OR R = Σ Si αi / (1‐ αm) (3) and αm= A/S • αi…… depends on frequency
The sound absorption coefficient indicates how much of the sound is absorbed in the actual material. The absorption coefficient can be expressed as: α = Ia / Ii (1) where Ia = sound intensity absorbed (W/m 2) Ii = incident sound intensity (W/m 2) Concrete block, coarse 0. 3 ‐ 0. 4 Concrete block, painted 0. 05 ‐ 0. 07 Cork sheet, 6 mm 0. 1 ‐ 0. 2 Fiberboard on battens, 12 mm 0. 3 ‐ 0. 4 Floor, concrete or terrazzo 0. 02 Floor, linoleum, asphalt, rubber or cork tiles on concrete 0. 03 Floor, wood 0. 06 ‐ 0. 1 Hardwood 0. 3 Glass, large panes heavy plate 0. 03 ‐ 0. 05 Glass, ordinary windows 0. 1 ‐ 0. 2 Gypsum board, 12 mm 0. 04 ‐ 0. 07 Mineral wool, 100 mm 0. 65 Persons, each 2. 0 ‐ 5. 0 Plaster walls 0. 01 ‐ 0. 03 Plywood panel, 3 mm 0. 01 ‐ 0. 02 Polystyrene, expanded on 50 mm battens 0. 35 Polystyrene, expanded rigid backing 0. 15 Polyurethane foam, flexible 0. 95 Rubber sheet, 6 mm porous 0. 1 ‐ 0. 2 Slag wool or glass silk, 50 mm 0. 8 ‐ 0. 9 Snow 0. 75 Wood wool cement on battens, 25 mm 0. 6 ‐ 0. 07
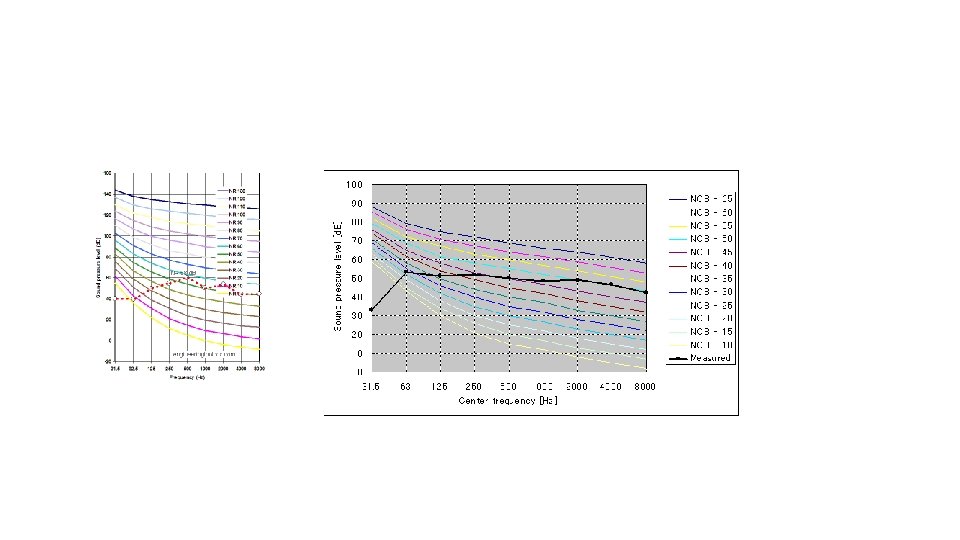
Room Acoustical Properties • Room acoustics and acoustic properties ‐ decibel A, B and C weighing curves or Scales‐ Noise Rating (NR) curves, Loudness in PHON, Noise Criteria Curve (NC), sound transmission, sound pressure, sound intensity and sound attenuation.
Some Typical Sound Levels Sources at 1 m Rifle Threshold of pain Pneumatic hammer 6 d. B = double the Pa Street traffic Talking Library TV Studio Threshold of hearing Sound Pressure 200 Pa 2 Pa 1 Pa 0. 2 Pa 0. 002 Pa 0. 00002 Pa Lp re 20 µPa * (SPL) 140 d. B 120 d. B 100 d. B 94 d. B 80 d. B 60 d. B 40 d. B 20 d. B
THE EQUAL LOUDNESS COUNTOURS
A, B and C Standard filters Countours Standard filter contours are used to make the instrument more nearly approximate the normal human ear. The different contours were intended to match the ear at different sound intensities
Sound Pressure Level Measuring scales Measured or Estimated Sound Pressure Level d. B Resulting with d. B(A) filter Resulting with d. B(B) filter Resulting with d. B(C) filter d. B(A) filter d. B(B) filter d. B(C) filter Octave Band Center Frequency (Hz) 125 250 500 1000 2000 31. 25 62. 5 4000 8000 30 54 60 64 53 48 43 39 32 0 27. 8 43. 9 55. 4 49. 8 48 44. 2 40 30. 9 13 45 56 63 53 48 43 38 29 27 ‐ 39. 4 ‐ 17 ‐ 3 53. 2 ‐ 26. 2 ‐ 9 ‐ 0. 8 59. 8 ‐ 16. 1 ‐ 4 ‐ 0. 2 64 ‐ 8. 6 ‐ 1 0 53 ‐ 3. 2 0 0 48 0 0 0 42. 8 1. 2 0 ‐ 0. 2 38. 2 1 ‐ 0. 8 29 ‐ 1. 1 ‐ 3
AIR-HANDLING UNIT
AHU SCHEMATIC
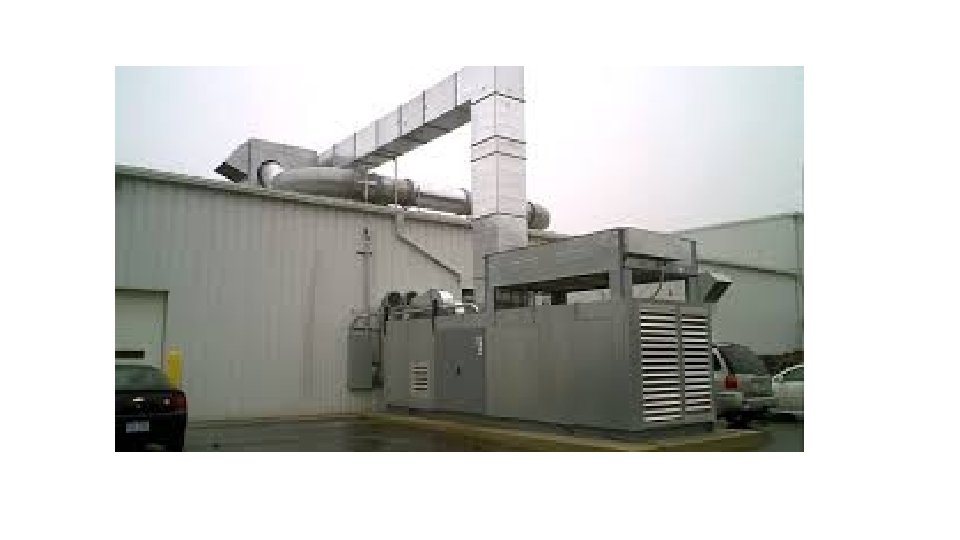
Example - Acoustic Calculation of a Ventilation System
Noise pollution prevention and control tips • noise and nuisance Construction of soundproof rooms for noisy machines in industrial and manufacturing installations must be encouraged. This is also important for residential building—noisy machines should be installed far from sleeping and living rooms, like in a basement or garage. • noise and nuisance Use of horns with jarring sounds, motorbikes with damaged exhaust pipes, noisy trucks to be banned. • noise and nuisance Noise producing industries, airports, bus and transport terminals and railway stations to sighted far from where living places.
Wall and ceiling acoustic treatment The most common are the 500 series of compressed Fiberglas panels. These can be covered with an openweave cloth and used either as spot treatment for reflection control or general room deadening.
THANKS