Dr Mona Hassan Ahmed Hassan Prof Biostatistics What

Dr. Mona Hassan Ahmed Hassan Prof. Biostatistics


What to do before sitting to PC? Statistical Software How to generate and interpret results?

Data Coding Transformation of qualitative information into Numbers OR Symbols

Data Preparation Either the information is transferred from the original record to a “coding sheet” Ser. Column Ser. Code Column Ser. Code Column Age Age Sex Sex MS MS MS Educ. Coding form Code

ID 1 1. Date of Interview 10/1/2008 2. What is your date of Birth? 25/8/1986 3. What sex are you? Male (m) Female (f) 4. What is your marital status? Single (1) Married (2) Widowed (3) Divorced (4) 5. What is your height (cm)? 160 6. What is your weight (kg)? 58 Code 1 10/01/2008 25/08/1986 f 1 160 58

Coding by more than one person l Precise instructions should be developed for coders l Coders, must be trained l check for inter-coder reliability

Sorting of the questionnaires 1 -100 101 -200

Describing the Sample measures of central tendency and variability. l The appropriate measure of central tendency and variability will depend upon the variables level of measurement and the shape of the distribution. l

Scales of measurement Interval Nominal Ratio Ordinal

Scales of Measurement Ali Samy Ramy Nominal Symbols Assigned to Runners Finish Ordinal Rank Order of Winners Finish 3 rd place Interval Ratio Performance Rating on a 0 to 10 Scale Time to Finish, in Seconds 2 nd place 1 st place 3 7 9 15. 2 14. 1 13. 4

Scales of Measurement

Shapes of Distribution Mean Median Mode 68% within mean+SD 95% within mean+2 SD 99% within mean+3 SD

Right-skewed distribution Mode Median Mean If Mean > Median Positive or right skewness (long right tail) It arises when the mean is increased by some unusually high values

Left-skewed distribution Mean Median Mode If Mean < Median Negative or left skewness (long left tail). Negative skewness occurs when the mean is reduced by some extremely low values.

Inference Developing and Testing a Hypothesis differences in frequency distributions of nominal level variables chi-square associations or correlations between variables, bivariate correlations differences between groups with respect to the distribution of interval/ratio level data. t -tests

The most popular statistical packages 1 SAS 2 3 4 5 6 7 8 9 10 SPSS STATA Epi Info SUDAAN S-PLUS Med. Calc Excel Statistica Minitab Sample size
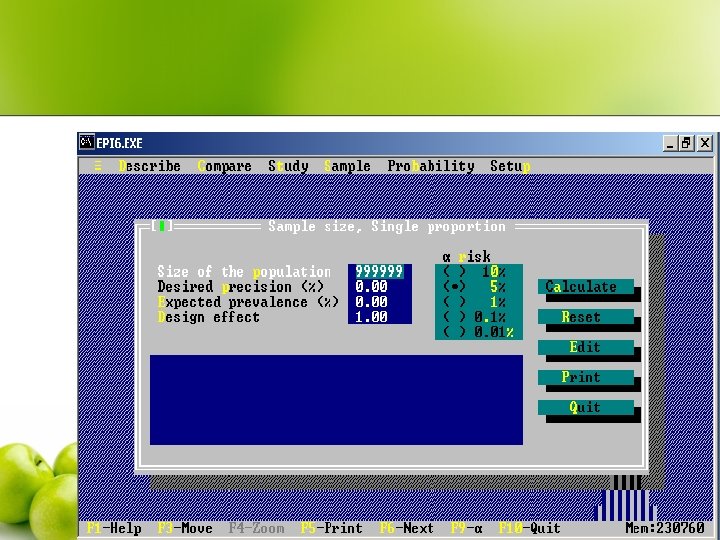
 to Calculate Sample Size")
Using Epitable (Under Epi. Info) to Calculate Sample Size

SPSS Statistical Packages Sciences FOR Social

Creating a Data File in SPSS l l l l l ID Gender Male Female Date of Birth Educational Level (years) Employment Category 1 Clerical 2 Custodial 3 Manager Current Salary $ Beginning Salary $ Months since Hire Previous Experience (months) Minority Classification 0 No 1 Yes

Data Entry Excel Access Word Any Statistical software

Data entry
 1")
Data cleaning l General data check: Printout l Quick data check (Frequency tables) 1 - Wild codes check (invalid codes) 2 - Completeness check: ensure that all cases collected are represented in the data file without replication

Simple frequency Data check

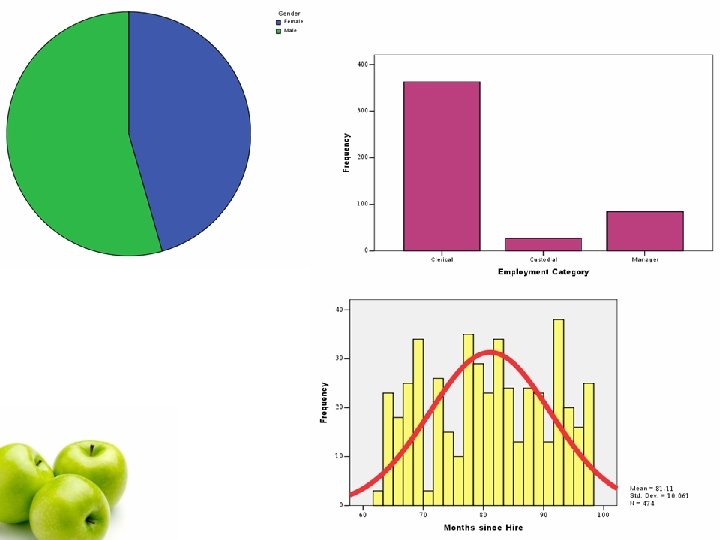
Perform Descriptive Statistics

Descriptive

Conduct Simple Correlations and regression

Correlation

Regression

Scatter
")
t- test (Two independent groups)
")
t- test (Two independent groups)
")
t- test (Two independent groups)
")
Paired t- test (Dependent groups)

Chi-Square test

- Slides: 38