a Set of Tools in Stress Testing scenario


 Fixed income(bp) Date U.")


, GMM(Mark, 1988) • 단순이동평균 이용:")
 변수 ADF PP ZA /$ -1. 549 -1.")
 변수 분기점 /$ 1997. 11. 13 KOPSI 1996. 12. 3")


효과 분석방법 • cross correlation coefficients: Forbes and Rigobon(2002) • GARCH: Edwards(1998) •")

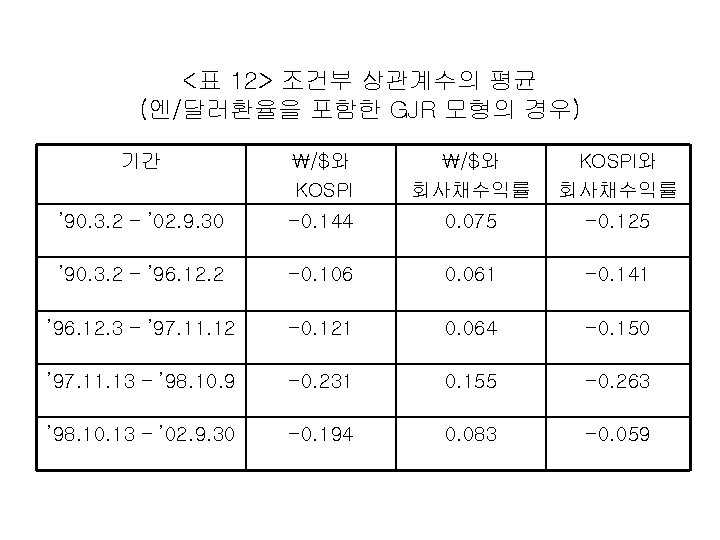
 변동성의 범위 표본수 상관계수의 평균")
 변동성의 범위 표본수 상관계수의 평균")
 변동성의 범위 표본수 상관계수의 평균")
- Slides: 44
○ a Set of Tools in Stress Testing • scenario analysis • stressing models, volatility, and correlations • policy responses
○ October 1987 Market Crash: Changes in Market Variables Equities(%) Fixed income(bp) Date U. S. , S$P Japan, Nikkei U. K. , FTSE Germany, Fed DAX Funds Oct 19 -20. 4 -2. 4 -9. 1 -9. 4 Oct 20 5. 3 -14. 9 -11. 4 -1. 4 Currencies(%) 3 -mo T-Bill 30 yr T-Bond Yen/$ DM/$ -0. 14 -0. 52 0. 01 -0. 2 -1. 3 -0. 77 -0. 62 -0. 76 1. 5 1. 7
○ Comparison of Forecast Losses on a $ 1 Million Portfolio Key Variables Period Event Size Position Key Variable Philippine peso 11 Jul. 1997 -5. 50 Japanese equities 23 Jan. 1995 U. S. equities Stress Loss Narrow Predicted Actual $40, 700 -$3, 070 $43 $190 -5. 23 $72, 120 -$2, 700 -$7, 730 -$11, 700 27 Oct. 1997 -4. 93 $136, 470 -$6, 650 -$5, 330 -$5, 420 U. K Bond 29 Dec. 1994 -4. 84 $122, 910 -$2, 640 -$3, 550 -$3, 030 U. S. Bond 20 Feb, 1996 -4. 86 $122, 970 -$1, 210 -$7, 070 -$10, 380
Risk and Number of Securities
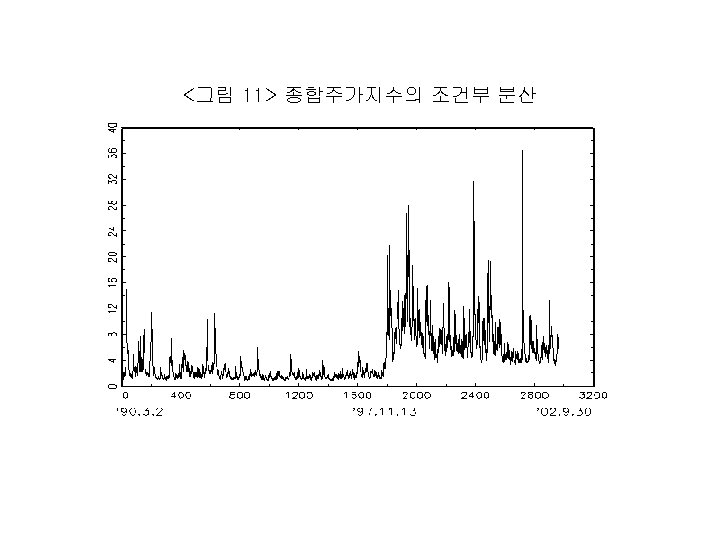
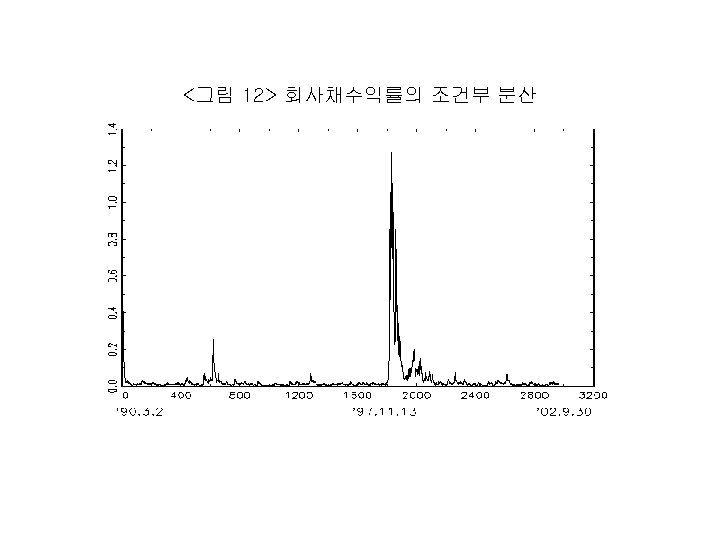
○ 변동성 측정방법 • 조건부 이분산 시계열모형: GARCH(Bollerslev, 1986), GMM(Mark, 1988) • 단순이동평균 이용: Poterba and Summers(1986) • stochastic volatility 모형: Engle and Mustafa(1992) • inter-period high and low price 이용: Schwert(1990) • bid-ask spread 이용: Brock and Kleiden(1990) • survey data의 cross-sectional dispersion 이용: Rich, Raymond, and Butler(1990)
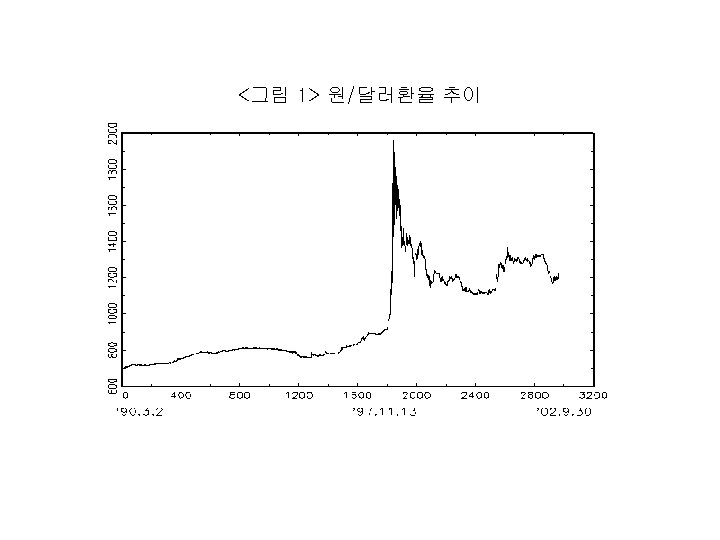
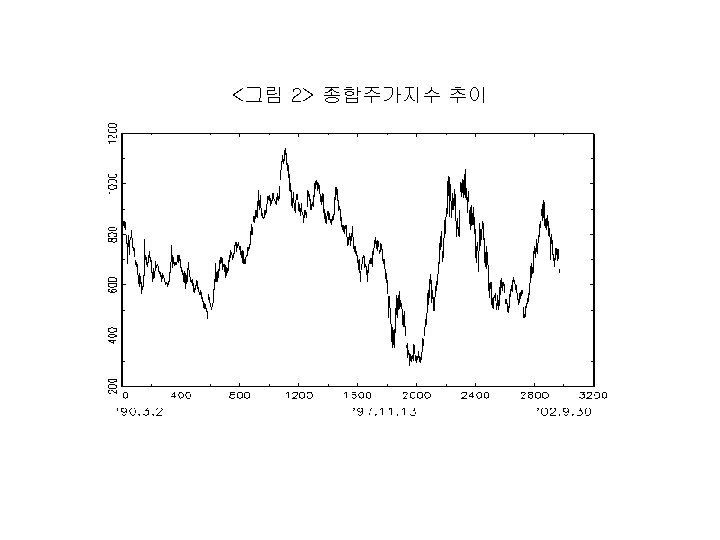
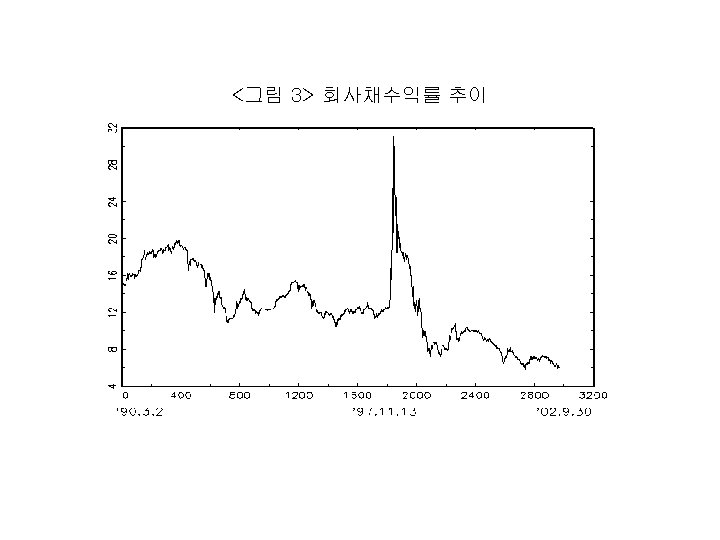
<표 1> 단위근 검정(추세를 가진 경우) 변수 ADF PP ZA /$ -1. 549 -1. 009 -3. 877*(0. 607) KOPSI -2. 215 -2. 217 -3. 066(0. 526) 회사채수익률 -2. 743 -2. 324 -3. 303(0. 657)
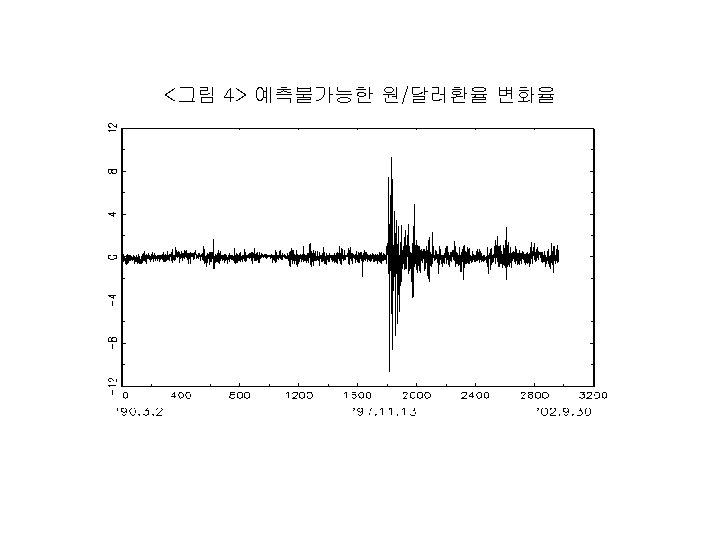
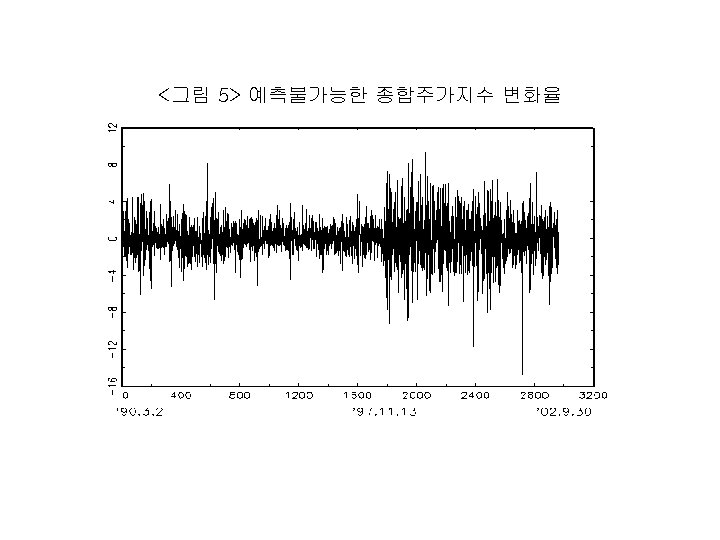
<표 2> Bai-Perron 검정(m=1) 변수 분기점 /$ 1997. 11. 13 KOPSI 1996. 12. 3 회사채수익률 1998. 10. 13
<표 3> 기초통계량 /$ KOSPI 회사채 수익률 YEN/$ Dow Jones 연방기금 금리 평균 0. 019 (0. 017) -0. 011 (0. 039) -0. 003 (0. 004) -0. 007 [0. 014) 0. 036 (0. 019)+ -0. 002 (0. 050) 표준편차 0. 936 2. 115 0. 235 0. 762 1. 060 0. 272 왜도 0. 082 -0. 101 0. 744 -0. 908 -0. 429 0. 782 첨도 162. 897 6. 896 115. 087 12. 959 8. 214 27. 886 최고치 17. 248 10. 024 3. 900 4. 699 6. 155 2. 830 최저치 -20. 346 -14. 667 -3. 900 -8. 967 -7. 650 -2. 700 QM(10) 11. 011 [0. 357] 11. 624 [0. 311] 11. 090 [0. 351] 7. 737 [0. 654] 7. 910 [0. 638] 44. 002 [0. 000] Q 2(10) 2647. 442 [0. 000] 753. 468 [0. 000] 4053. 470 [0. 000] 140. 470 [0. 000] 439. 979 [0. 000] 836. 384 [0. 000]
Different Views of Payoff Distribution
○ 파급(전염)효과 분석방법 • cross correlation coefficients: Forbes and Rigobon(2002) • GARCH: Edwards(1998) • co-integrating vector: Longin and Solink(1995) • specific cross-country transmission channels: Forbes(2000)
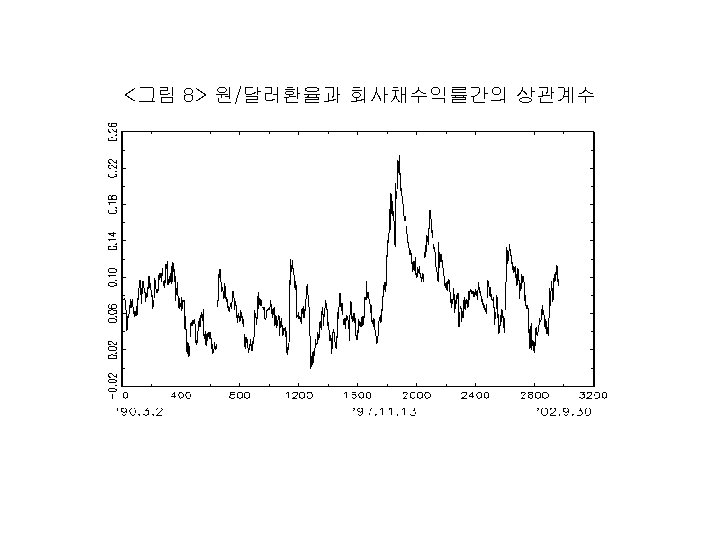
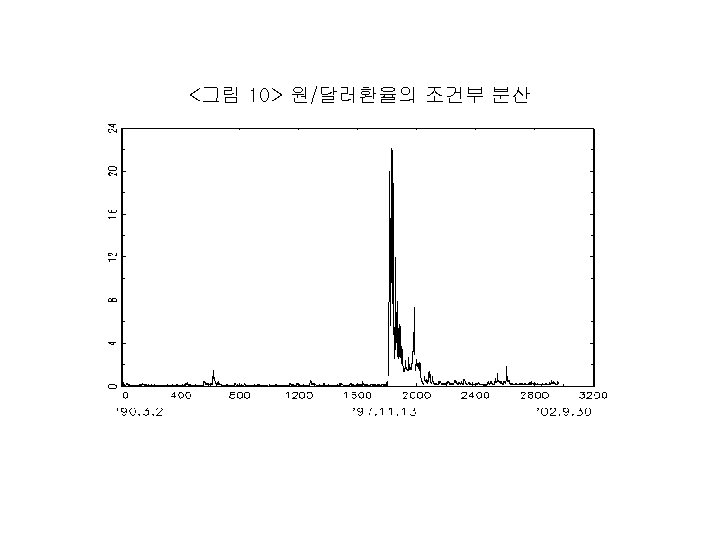
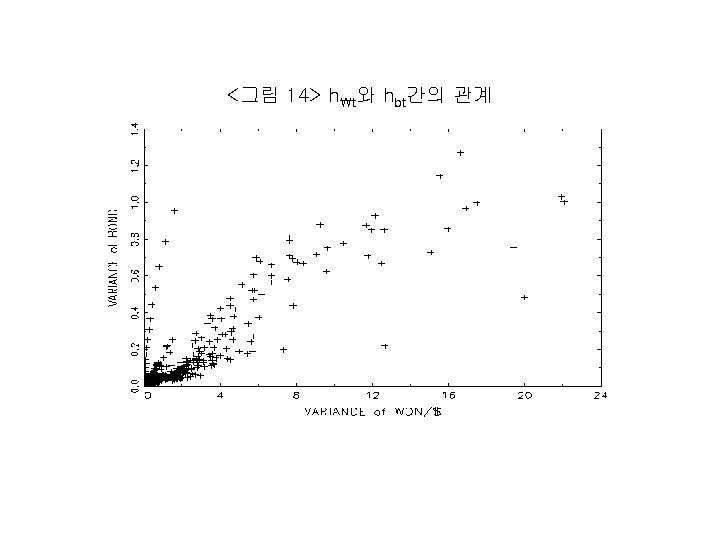
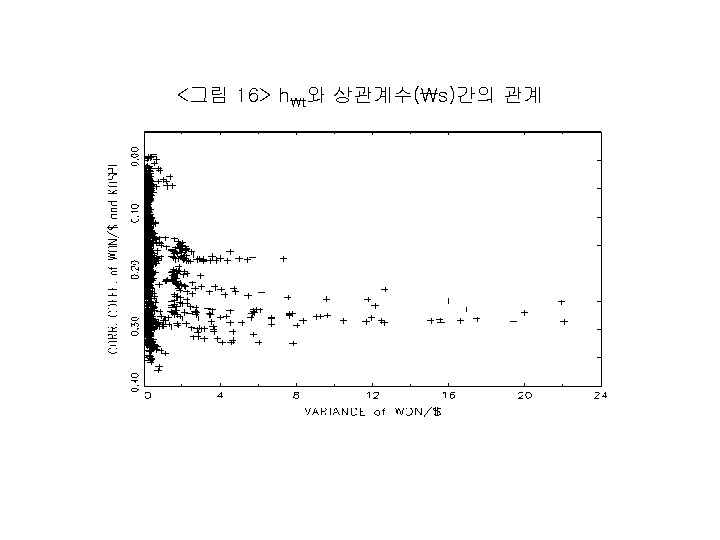
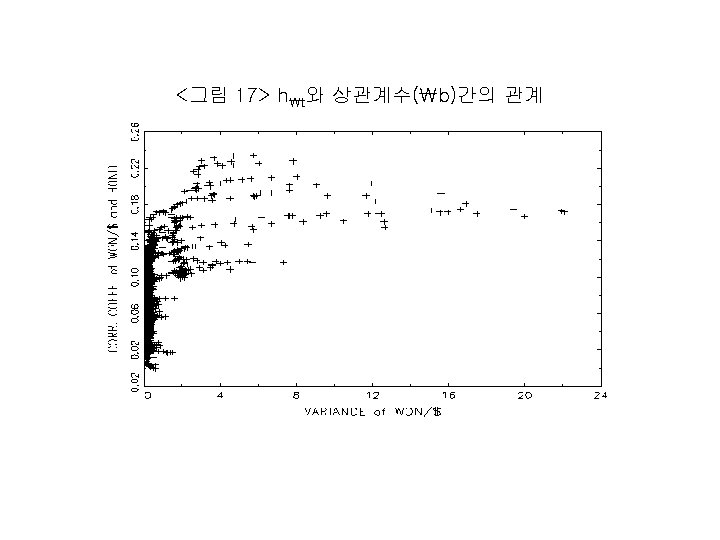
<표 14> 원/달러환율 변동성과 상관계수(엔/달러환율을 포함한 GJR 모형의 경우) 변동성의 범위 표본수 상관계수의 평균 /$와 KOSPI /$와 회사채수익률 ht ≤ 0. 060 662 -0. 107 0. 061 0. 060 < ht ≤ 0. 104 648 -0. 115 0. 064 0. 104 < ht ≤ 0. 148 435 -0. 143 0. 066 0. 148 < ht ≤ 0. 192 334 -0. 150 0. 073 0. 192 < ht ≤ 0. 236 202 -0. 146 0. 072 0. 236 < ht ≤ 0. 280 127 -0. 174 0. 078 0. 280 < ht ≤ 0. 325 82 -0. 171 0. 073 0. 325 < ht ≤ 0. 369 59 -0. 212 0. 075 0. 369 < ht ≤ 0. 413 41 -0. 218 0. 098 0. 413 < ht 371 -0. 220 0. 129
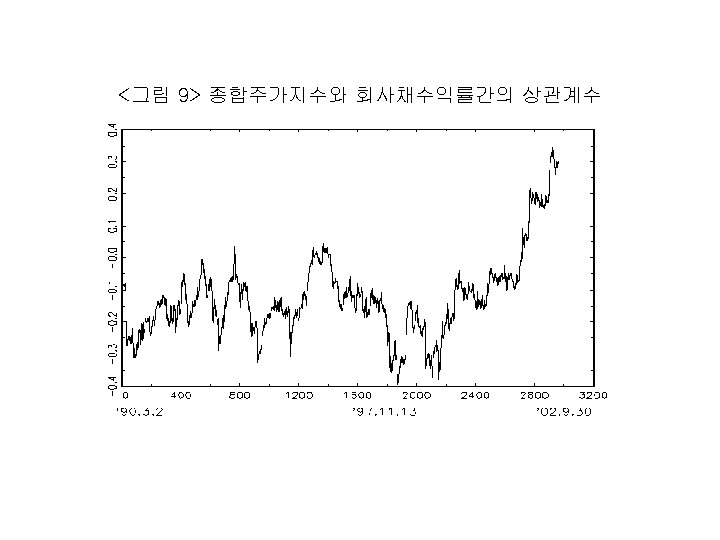
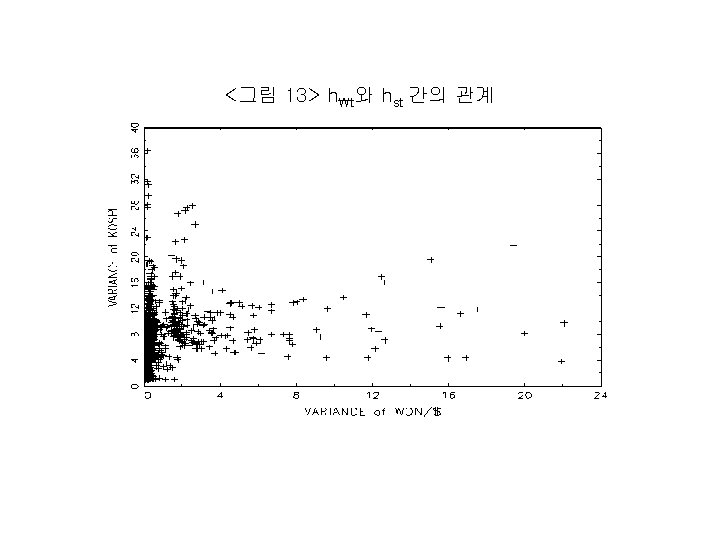
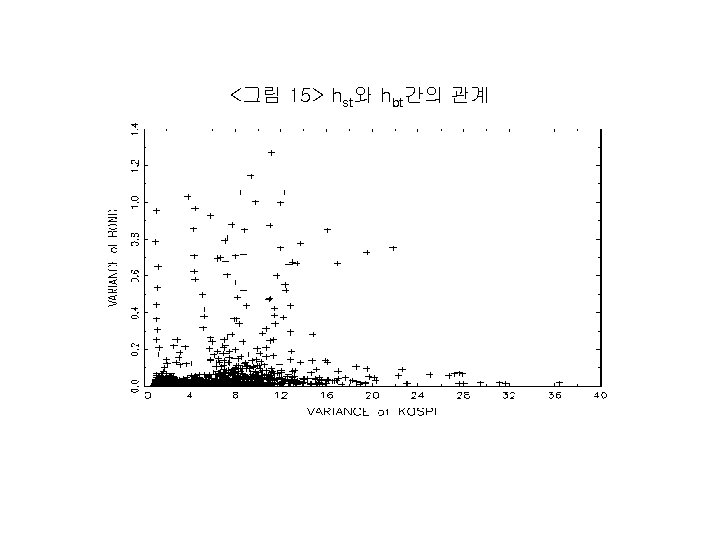
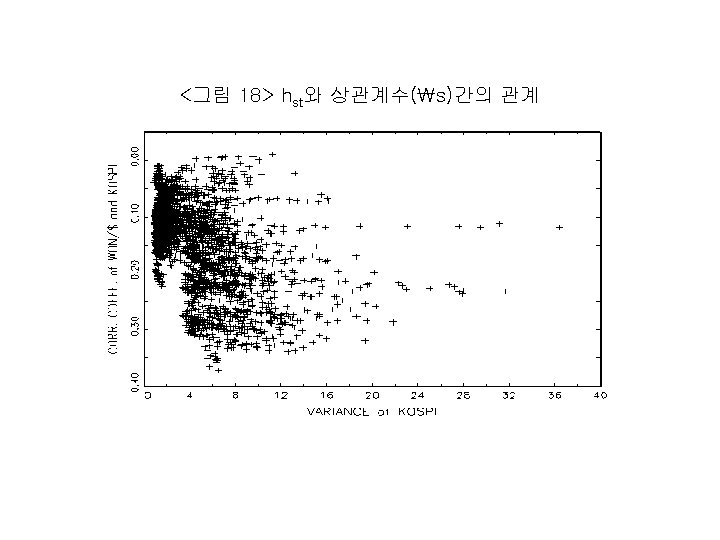
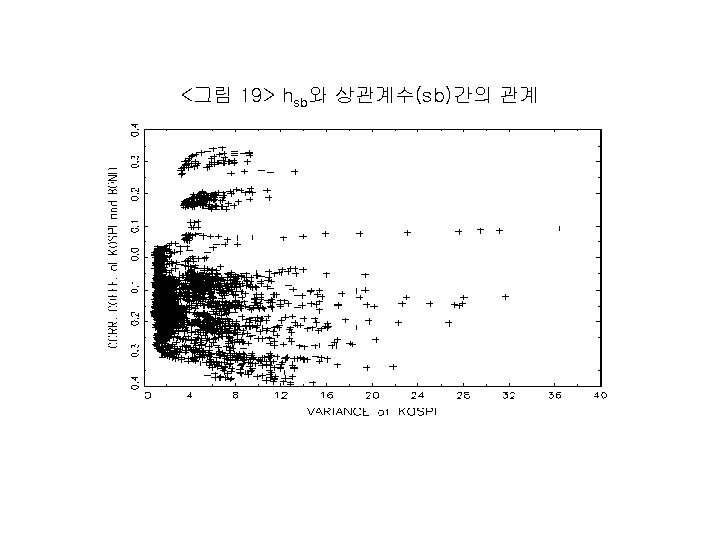
<표 15> KOSPI 변동성과 상관계수(엔/달러환율을 포함한 GJR 모형의 경우) 변동성의 범위 표본수 상관계수의 평균 /$와 KOSPI와 회사채수익률 hst ≤ 1. 574 766 -0. 113 -0. 121 1. 574 < hst ≤ 2. 287 571 -0. 107 -0. 149 2. 287 < hst≤ 2. 999 207 -0. 104 -0. 154 2. 999 < hst ≤ 3. 711 124 -0. 114 -0. 100 3. 711 < hst≤ 4. 423 184 -0. 175 -0. 033 4. 423 < hst≤ 5. 135 182 -0. 178 -0. 079 5. 135 < hst≤ 5. 847 168 -0. 175 -0. 077 5. 847 < hst≤ 6. 559 145 -0. 182 -0. 084 6. 559 < hst≤ 7. 272 123 -0. 169 -0. 133 7. 272 < hst 491 -0. 209 -0. 167
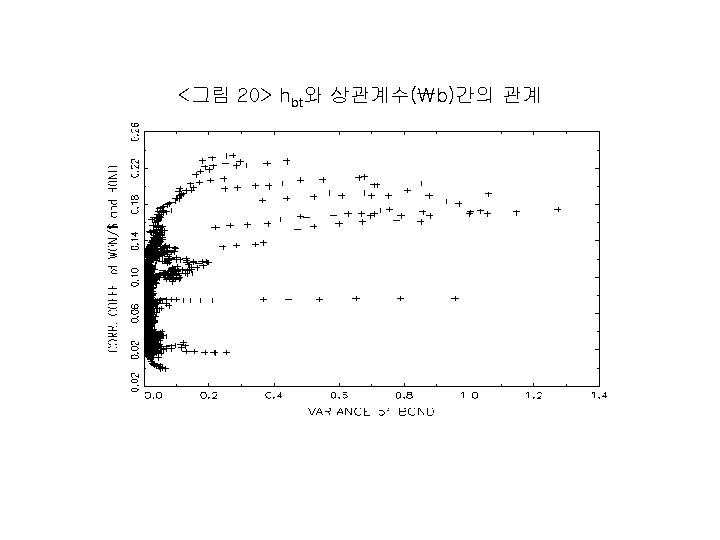
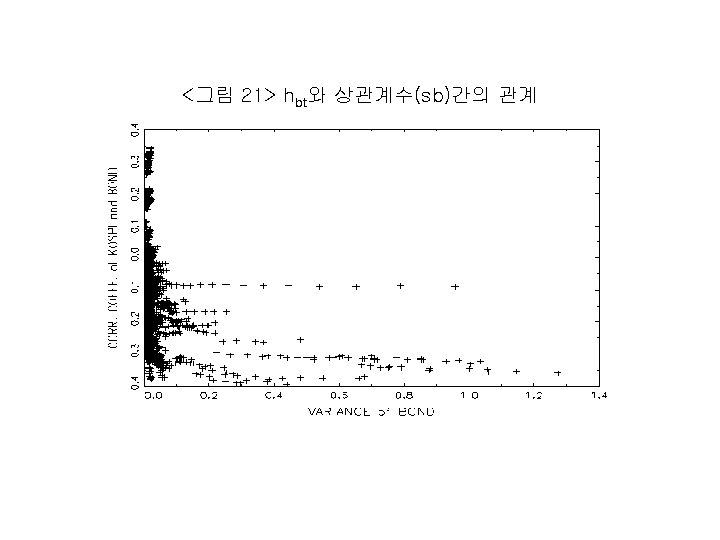
<표 16> 회사채수익률 변동성과 상관계수(엔/달러환율을 포함한 GJR 모형의 경우) 변동성의 범위 표본수 상관계수의 평균 /$와 회사채수익률 KOSPI와 회사채수익률 hbt≤ 0. 006 550 0. 107 -0. 092 0. 006 < hbt≤ 0. 010 844 0. 115 -0. 108 0. 010 < hbt≤ 0. 015 565 0. 143 -0. 107 0. 015 < hbt≤ 0. 019 261 0. 150 -0. 098 0. 019 < hbt≤ 0. 023 152 0. 146 -0. 139 0. 023 < hbt≤ 0. 027 85 0. 174 -0. 138 0. 027 < hbt≤ 0. 032 74 0. 171 -0. 148 0. 032 < hbt≤ 0. 036 45 0. 212 -0. 178 0. 036 < hbt≤ 0. 040 49 0. 218 -0. 185 0. 040 < hbt 336 0. 220 -0. 228