9 Tests of Hypotheses for a Single Sample
- Slides: 40
9 Tests of Hypotheses for a Single Sample 1
9 -1 Hypothesis Testing 9 -1. 1 Statistical Hypotheses Statistical hypothesis testing and confidence interval estimation of parameters are the fundamental methods used at the data analysis stage of a comparative experiment, in which the engineer is interested, for example, in comparing the mean of a population to a specified value. Definition © John Wiley & Sons, Inc. Applied Statistics and Probability for Engineers, by Montgomery and Runger.
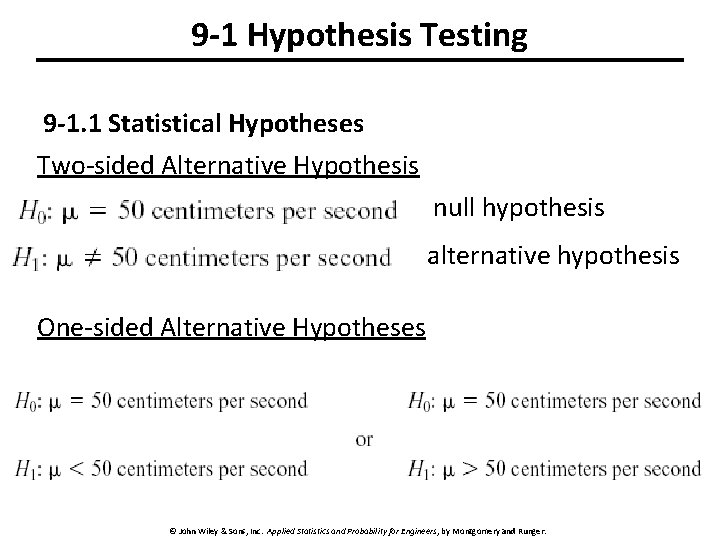
9 -1 Hypothesis Testing 9 -1. 1 Statistical Hypotheses For example, suppose that we are interested in the burning rate of a solid propellant used to power aircrew escape systems. • Now burning rate is a random variable that can be described by a probability distribution. • Suppose that our interest focuses on the mean burning rate (a parameter of this distribution). • Specifically, we are interested in deciding whether or not the mean burning rate is 50 centimeters per second. © John Wiley & Sons, Inc. Applied Statistics and Probability for Engineers, by Montgomery and Runger.
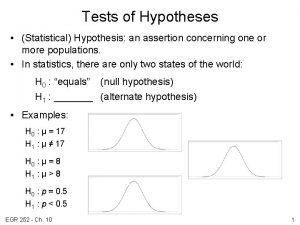
9 -1 Hypothesis Testing 9 -1. 1 Statistical Hypotheses Two-sided Alternative Hypothesis null hypothesis alternative hypothesis One-sided Alternative Hypotheses © John Wiley & Sons, Inc. Applied Statistics and Probability for Engineers, by Montgomery and Runger.
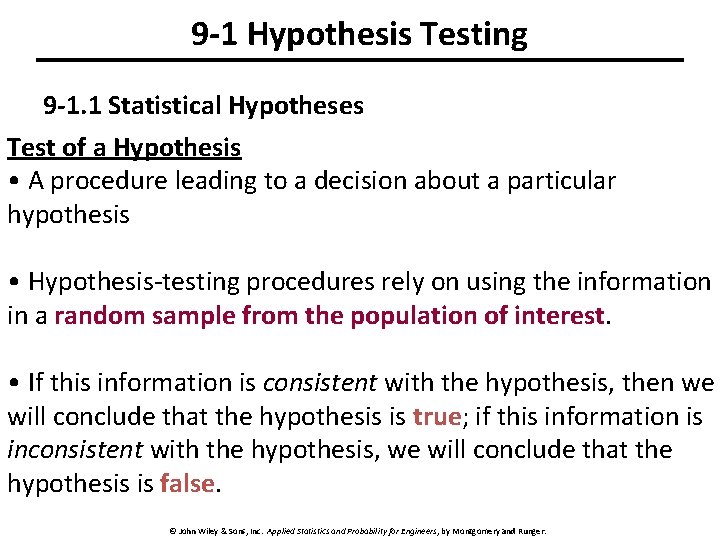
9 -1 Hypothesis Testing 9 -1. 1 Statistical Hypotheses Test of a Hypothesis • A procedure leading to a decision about a particular hypothesis • Hypothesis-testing procedures rely on using the information in a random sample from the population of interest. • If this information is consistent with the hypothesis, then we will conclude that the hypothesis is true; if this information is inconsistent with the hypothesis, we will conclude that the hypothesis is false. © John Wiley & Sons, Inc. Applied Statistics and Probability for Engineers, by Montgomery and Runger.
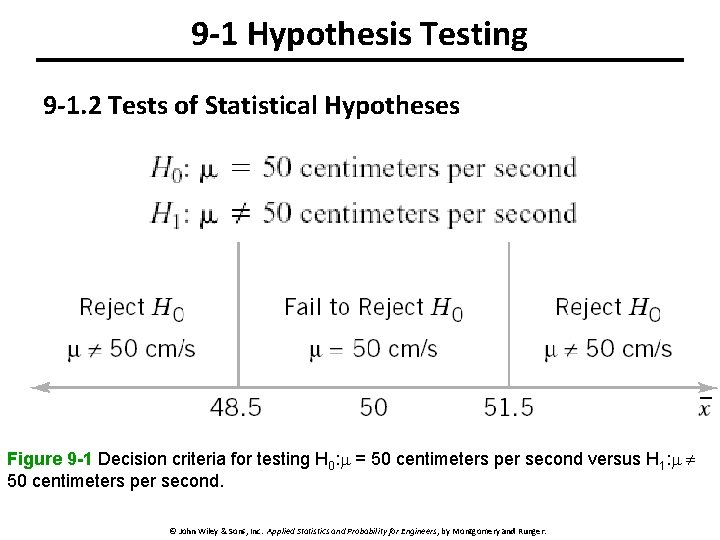
9 -1 Hypothesis Testing 9 -1. 2 Tests of Statistical Hypotheses Figure 9 -1 Decision criteria for testing H 0: = 50 centimeters per second versus H 1: 50 centimeters per second. © John Wiley & Sons, Inc. Applied Statistics and Probability for Engineers, by Montgomery and Runger.
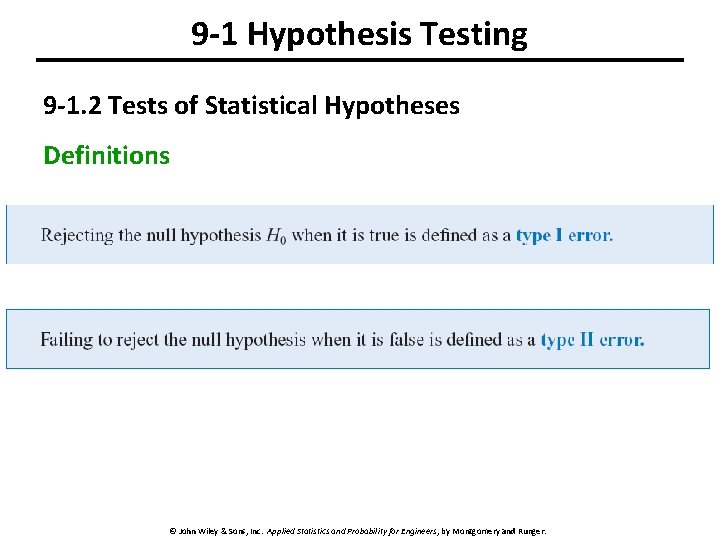
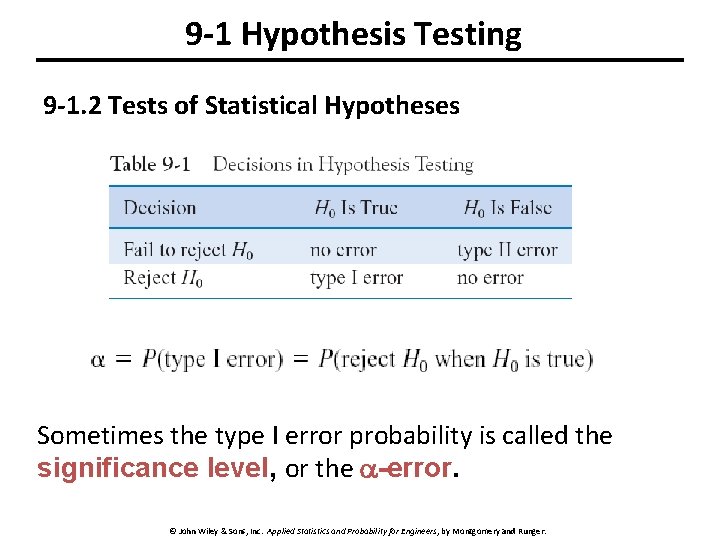
9 -1 Hypothesis Testing 9 -1. 2 Tests of Statistical Hypotheses Definitions © John Wiley & Sons, Inc. Applied Statistics and Probability for Engineers, by Montgomery and Runger.
9 -1 Hypothesis Testing 9 -1. 2 Tests of Statistical Hypotheses Sometimes the type I error probability is called the significance level, or the -error. © John Wiley & Sons, Inc. Applied Statistics and Probability for Engineers, by Montgomery and Runger.
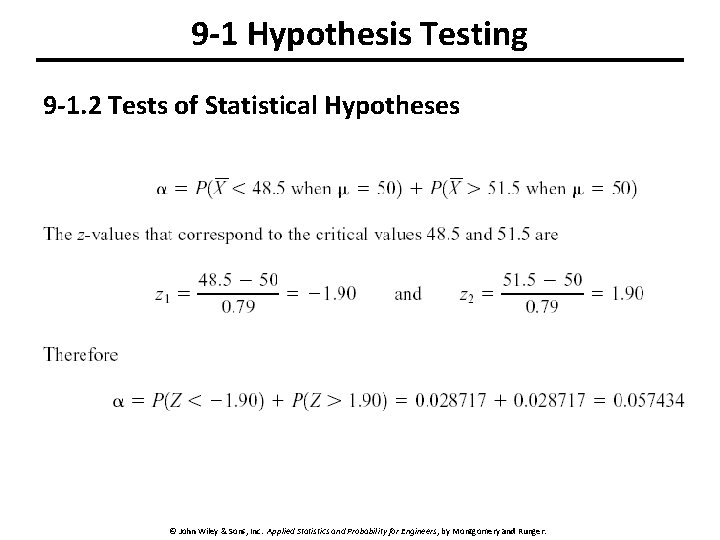
9 -1 Hypothesis Testing 9 -1. 2 Tests of Statistical Hypotheses © John Wiley & Sons, Inc. Applied Statistics and Probability for Engineers, by Montgomery and Runger.
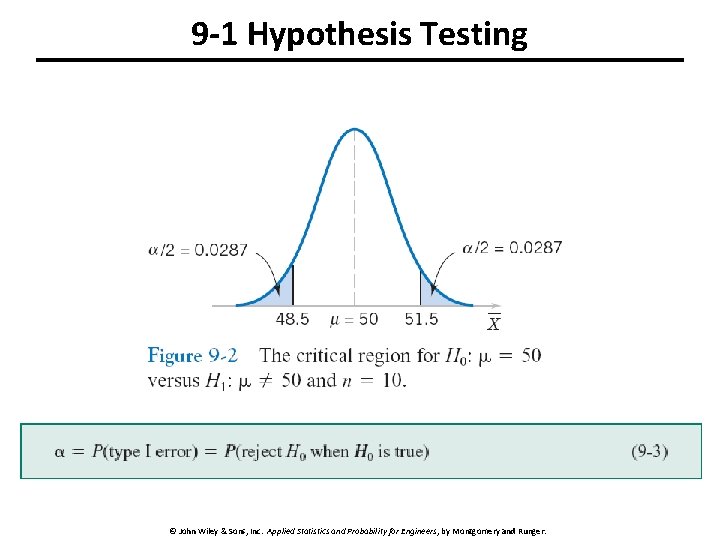
9 -1 Hypothesis Testing © John Wiley & Sons, Inc. Applied Statistics and Probability for Engineers, by Montgomery and Runger.
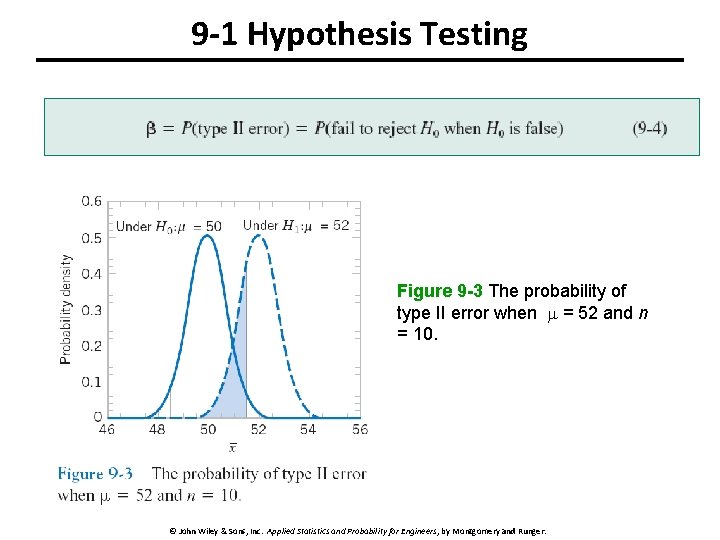
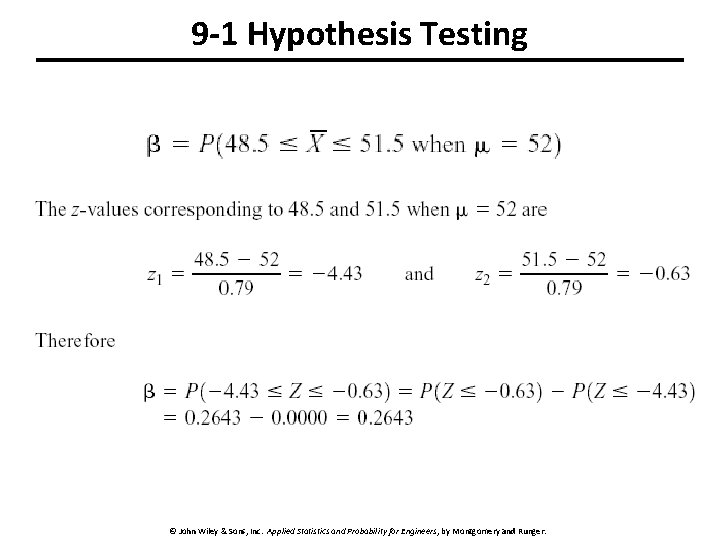
9 -1 Hypothesis Testing Figure 9 -3 The probability of type II error when = 52 and n = 10. © John Wiley & Sons, Inc. Applied Statistics and Probability for Engineers, by Montgomery and Runger.
9 -1 Hypothesis Testing © John Wiley & Sons, Inc. Applied Statistics and Probability for Engineers, by Montgomery and Runger.
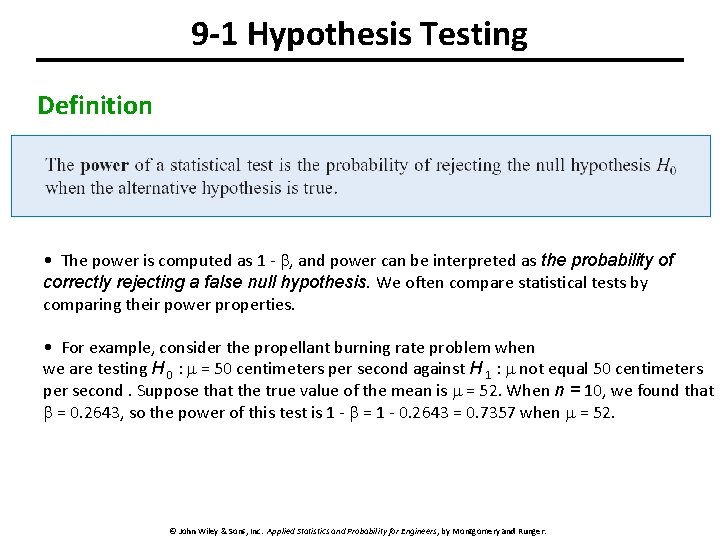
9 -1 Hypothesis Testing Definition • The power is computed as 1 - b, and power can be interpreted as the probability of correctly rejecting a false null hypothesis. We often compare statistical tests by comparing their power properties. • For example, consider the propellant burning rate problem when we are testing H 0 : = 50 centimeters per second against H 1 : not equal 50 centimeters per second. Suppose that the true value of the mean is = 52. When n = 10, we found that b = 0. 2643, so the power of this test is 1 - b = 1 - 0. 2643 = 0. 7357 when = 52. © John Wiley & Sons, Inc. Applied Statistics and Probability for Engineers, by Montgomery and Runger.
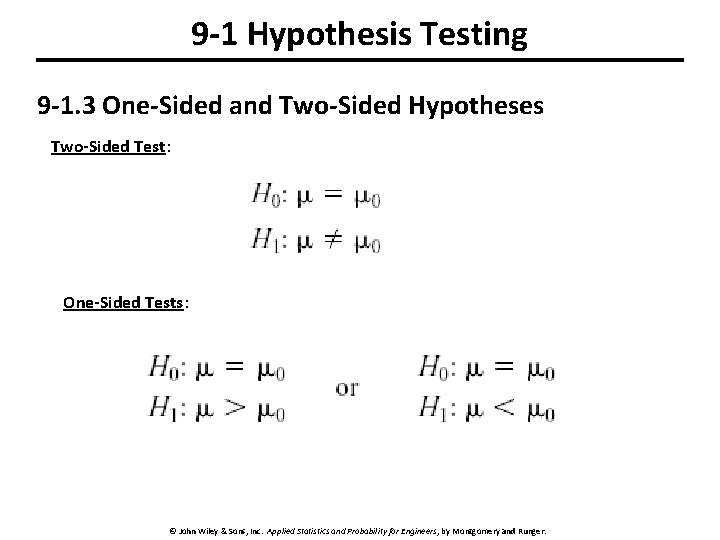
9 -1 Hypothesis Testing 9 -1. 3 One-Sided and Two-Sided Hypotheses Two-Sided Test: One-Sided Tests: © John Wiley & Sons, Inc. Applied Statistics and Probability for Engineers, by Montgomery and Runger.
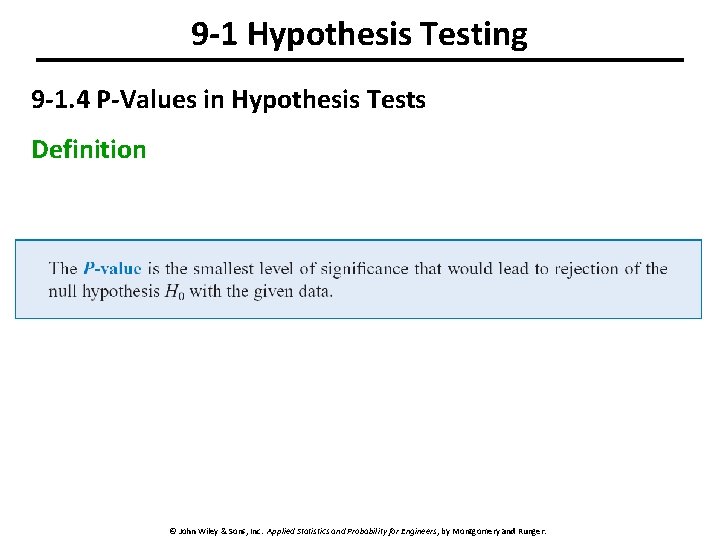
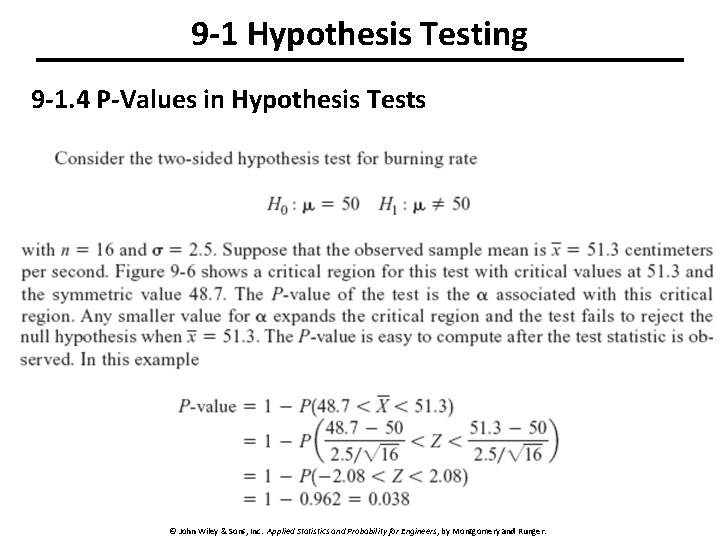
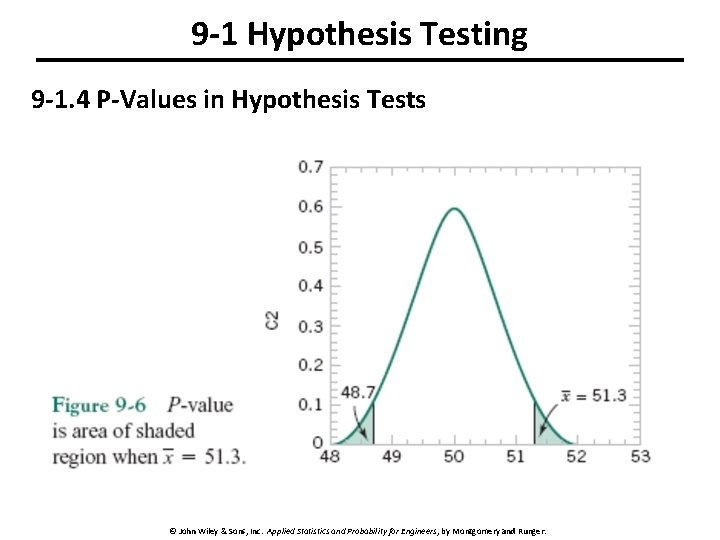
9 -1 Hypothesis Testing 9 -1. 4 P-Values in Hypothesis Tests Definition © John Wiley & Sons, Inc. Applied Statistics and Probability for Engineers, by Montgomery and Runger.
9 -1 Hypothesis Testing 9 -1. 4 P-Values in Hypothesis Tests © John Wiley & Sons, Inc. Applied Statistics and Probability for Engineers, by Montgomery and Runger.
9 -1 Hypothesis Testing 9 -1. 4 P-Values in Hypothesis Tests © John Wiley & Sons, Inc. Applied Statistics and Probability for Engineers, by Montgomery and Runger.
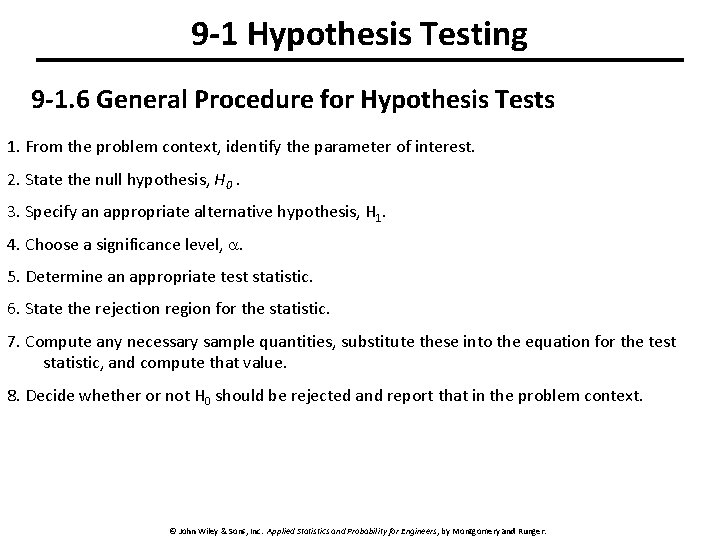
9 -1 Hypothesis Testing 9 -1. 6 General Procedure for Hypothesis Tests 1. From the problem context, identify the parameter of interest. 2. State the null hypothesis, H 0. 3. Specify an appropriate alternative hypothesis, H 1. 4. Choose a significance level, . 5. Determine an appropriate test statistic. 6. State the rejection region for the statistic. 7. Compute any necessary sample quantities, substitute these into the equation for the test statistic, and compute that value. 8. Decide whether or not H 0 should be rejected and report that in the problem context. © John Wiley & Sons, Inc. Applied Statistics and Probability for Engineers, by Montgomery and Runger.
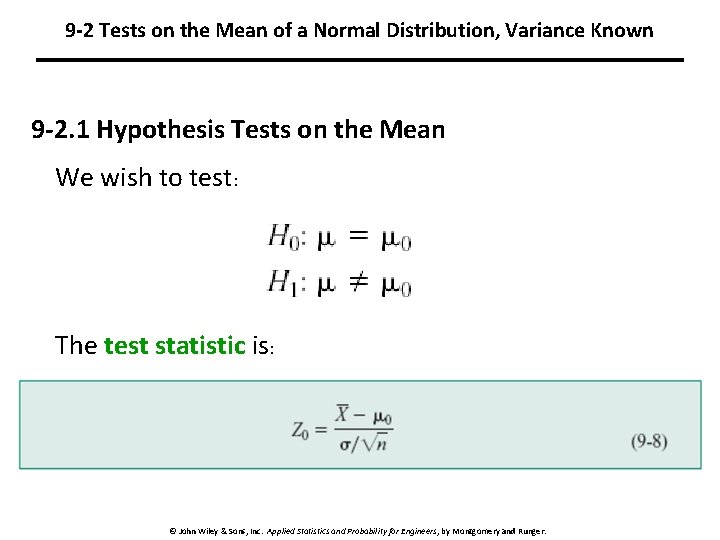
9 -2 Tests on the Mean of a Normal Distribution, Variance Known 9 -2. 1 Hypothesis Tests on the Mean We wish to test: The test statistic is: © John Wiley & Sons, Inc. Applied Statistics and Probability for Engineers, by Montgomery and Runger.
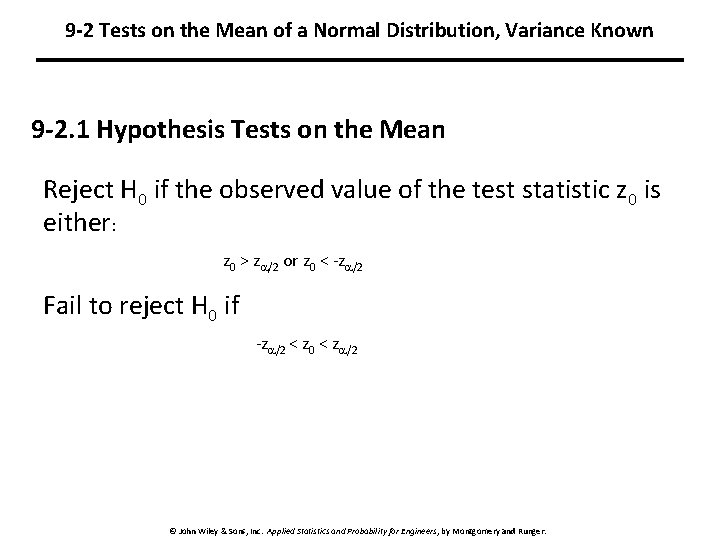
9 -2 Tests on the Mean of a Normal Distribution, Variance Known 9 -2. 1 Hypothesis Tests on the Mean Reject H 0 if the observed value of the test statistic z 0 is either: z 0 > z /2 or z 0 < -z /2 Fail to reject H 0 if -z /2 < z 0 < z /2 © John Wiley & Sons, Inc. Applied Statistics and Probability for Engineers, by Montgomery and Runger.
9 -2 Tests on the Mean of a Normal Distribution, Variance Known © John Wiley & Sons, Inc. Applied Statistics and Probability for Engineers, by Montgomery and Runger.
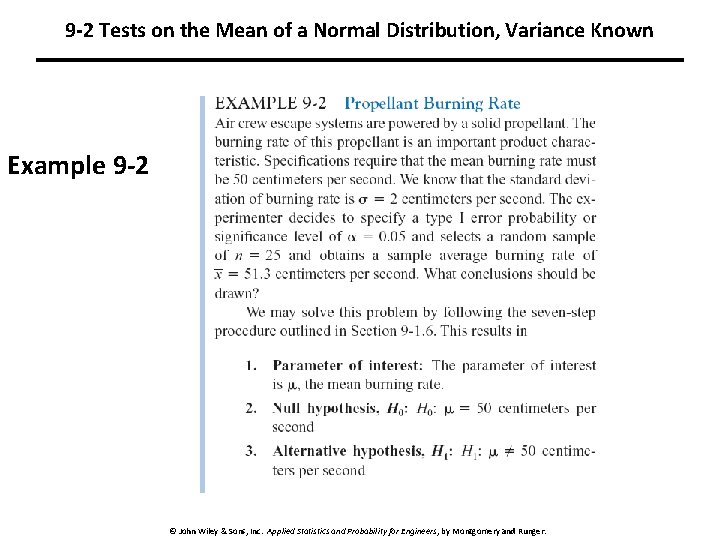
9 -2 Tests on the Mean of a Normal Distribution, Variance Known Example 9 -2 © John Wiley & Sons, Inc. Applied Statistics and Probability for Engineers, by Montgomery and Runger.
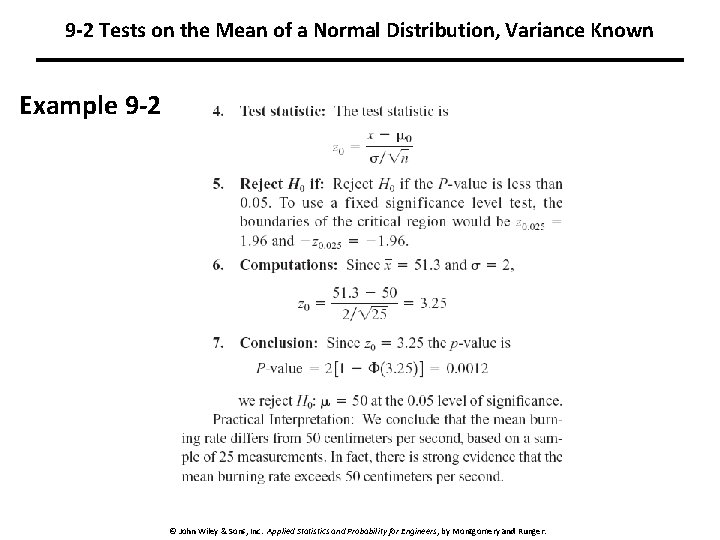
9 -2 Tests on the Mean of a Normal Distribution, Variance Known Example 9 -2 © John Wiley & Sons, Inc. Applied Statistics and Probability for Engineers, by Montgomery and Runger.
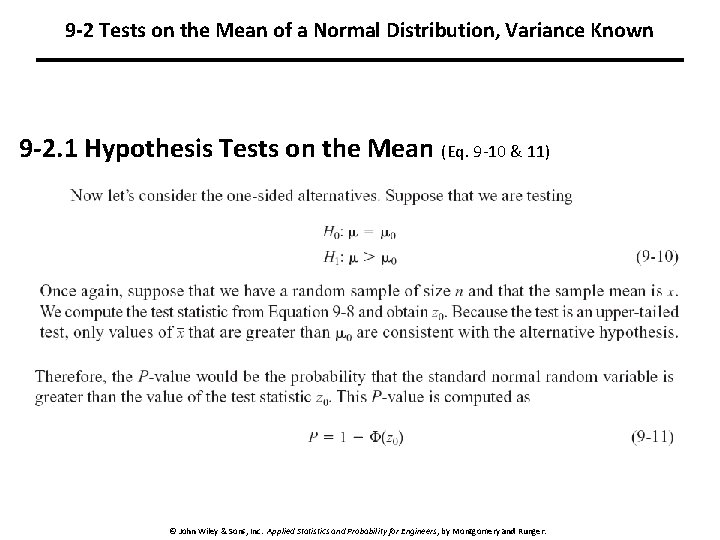
9 -2 Tests on the Mean of a Normal Distribution, Variance Known 9 -2. 1 Hypothesis Tests on the Mean (Eq. 9 -10 & 11) © John Wiley & Sons, Inc. Applied Statistics and Probability for Engineers, by Montgomery and Runger.
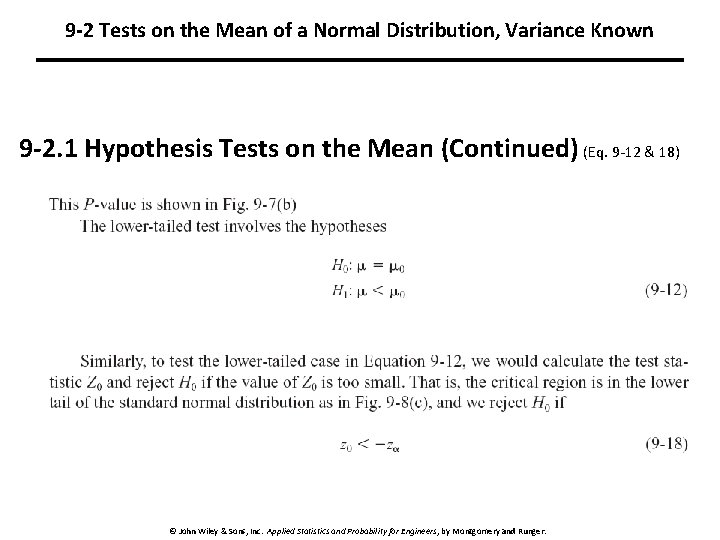
9 -2 Tests on the Mean of a Normal Distribution, Variance Known 9 -2. 1 Hypothesis Tests on the Mean (Continued) (Eq. 9 -12 & 18) © John Wiley & Sons, Inc. Applied Statistics and Probability for Engineers, by Montgomery and Runger.
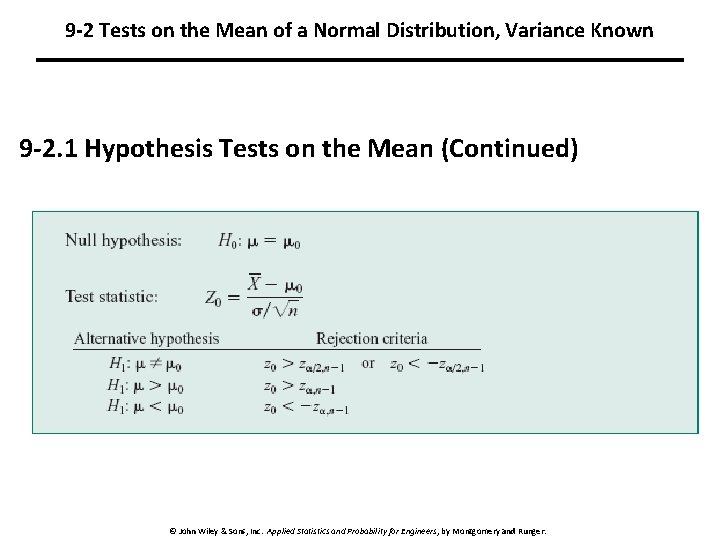
9 -2 Tests on the Mean of a Normal Distribution, Variance Known 9 -2. 1 Hypothesis Tests on the Mean (Continued) © John Wiley & Sons, Inc. Applied Statistics and Probability for Engineers, by Montgomery and Runger.
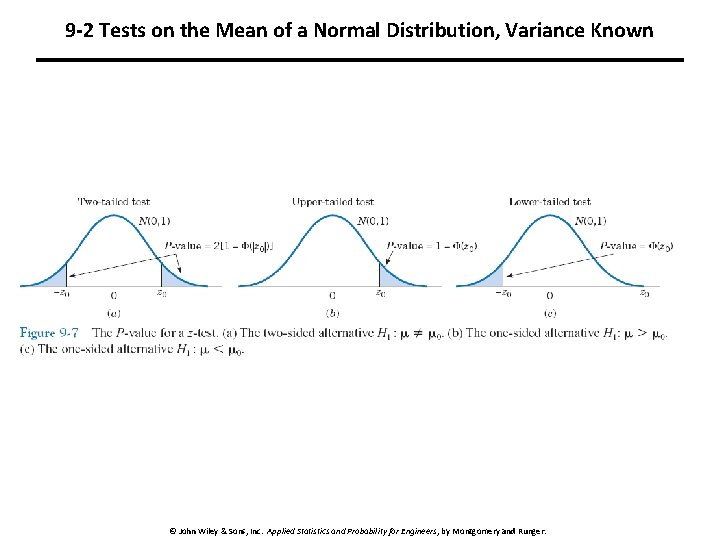
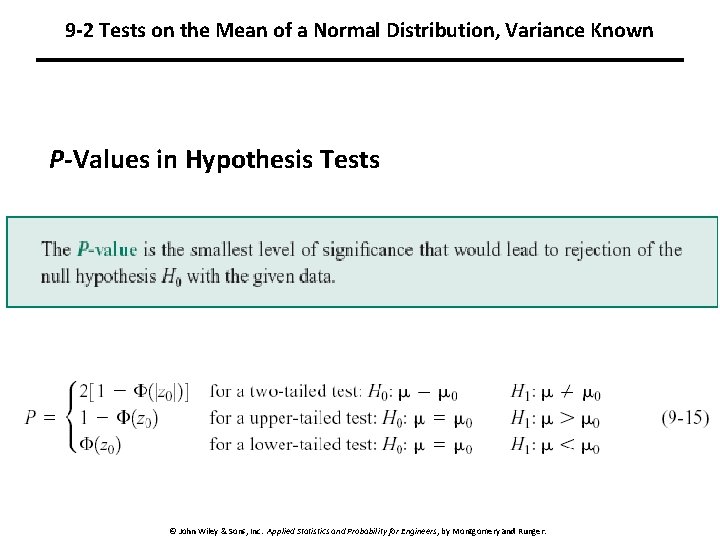
9 -2 Tests on the Mean of a Normal Distribution, Variance Known P-Values in Hypothesis Tests © John Wiley & Sons, Inc. Applied Statistics and Probability for Engineers, by Montgomery and Runger.
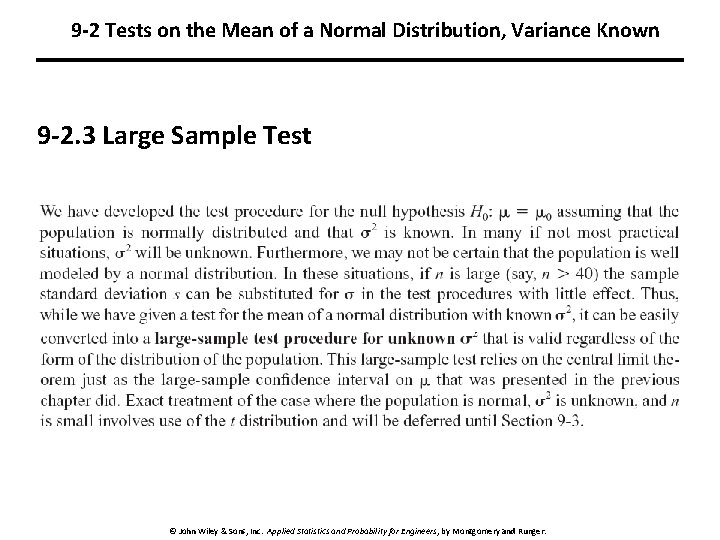
9 -2 Tests on the Mean of a Normal Distribution, Variance Known 9 -2. 3 Large Sample Test © John Wiley & Sons, Inc. Applied Statistics and Probability for Engineers, by Montgomery and Runger.
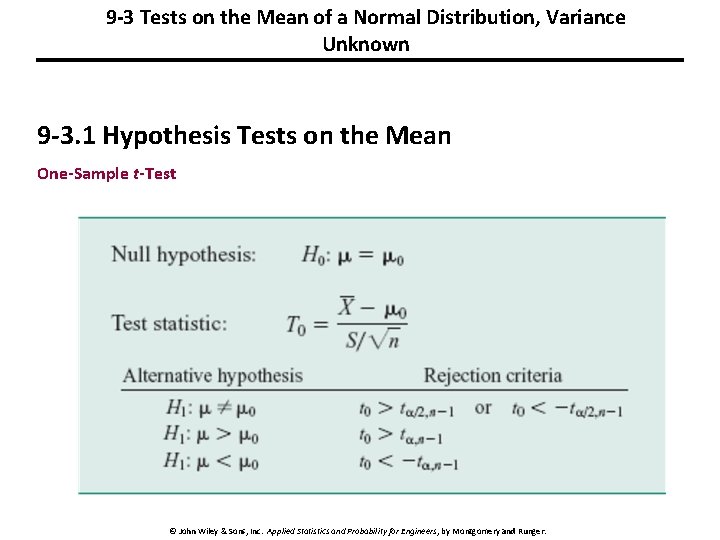
9 -3 Tests on the Mean of a Normal Distribution, Variance Unknown 9 -3. 1 Hypothesis Tests on the Mean One-Sample t-Test © John Wiley & Sons, Inc. Applied Statistics and Probability for Engineers, by Montgomery and Runger.
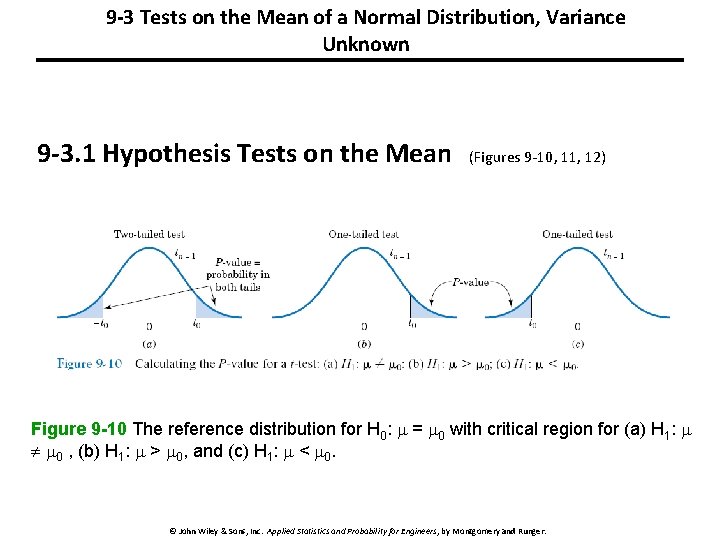
9 -3 Tests on the Mean of a Normal Distribution, Variance Unknown 9 -3. 1 Hypothesis Tests on the Mean (Figures 9 -10, 11, 12) Figure 9 -10 The reference distribution for H 0: = 0 with critical region for (a) H 1: 0 , (b) H 1: > 0, and (c) H 1: < 0. © John Wiley & Sons, Inc. Applied Statistics and Probability for Engineers, by Montgomery and Runger.
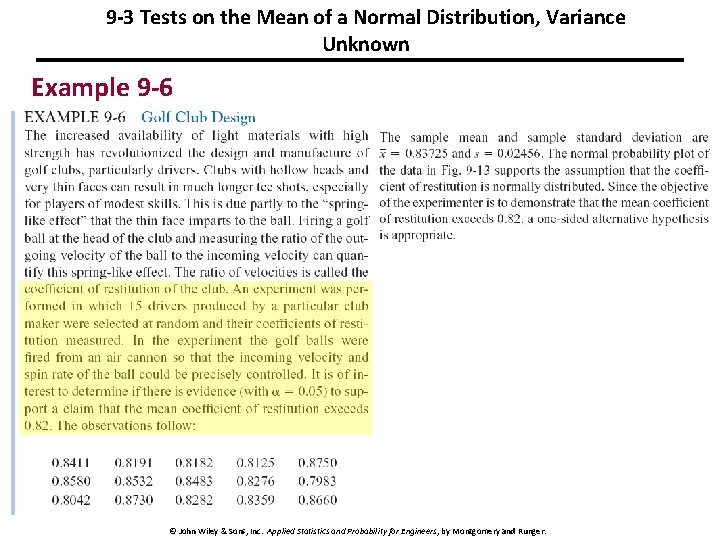
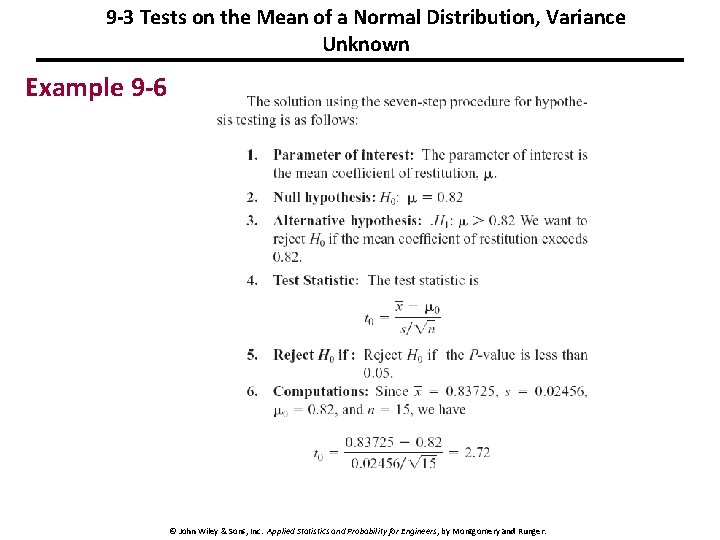
9 -3 Tests on the Mean of a Normal Distribution, Variance Unknown Example 9 -6 © John Wiley & Sons, Inc. Applied Statistics and Probability for Engineers, by Montgomery and Runger.
9 -3 Tests on the Mean of a Normal Distribution, Variance Unknown Example 9 -6 © John Wiley & Sons, Inc. Applied Statistics and Probability for Engineers, by Montgomery and Runger.
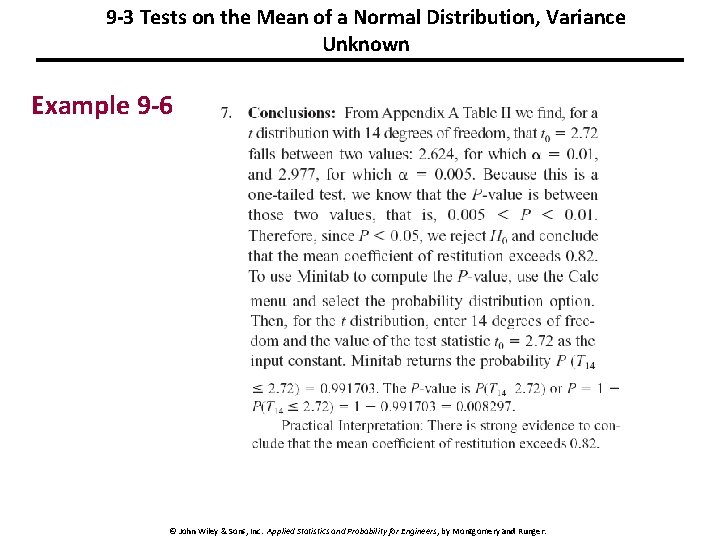
9 -3 Tests on the Mean of a Normal Distribution, Variance Unknown Example 9 -6 © John Wiley & Sons, Inc. Applied Statistics and Probability for Engineers, by Montgomery and Runger.
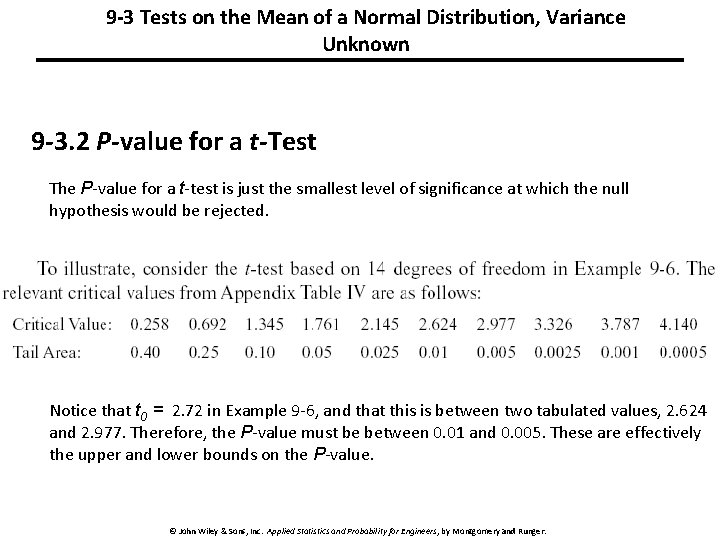
9 -3 Tests on the Mean of a Normal Distribution, Variance Unknown 9 -3. 2 P-value for a t-Test The P-value for a t-test is just the smallest level of significance at which the null hypothesis would be rejected. Notice that t 0 = 2. 72 in Example 9 -6, and that this is between two tabulated values, 2. 624 and 2. 977. Therefore, the P-value must be between 0. 01 and 0. 005. These are effectively the upper and lower bounds on the P-value. © John Wiley & Sons, Inc. Applied Statistics and Probability for Engineers, by Montgomery and Runger.
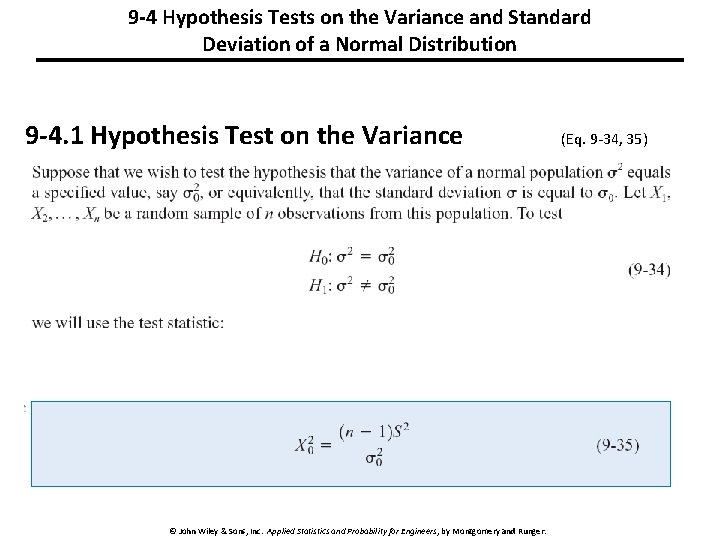
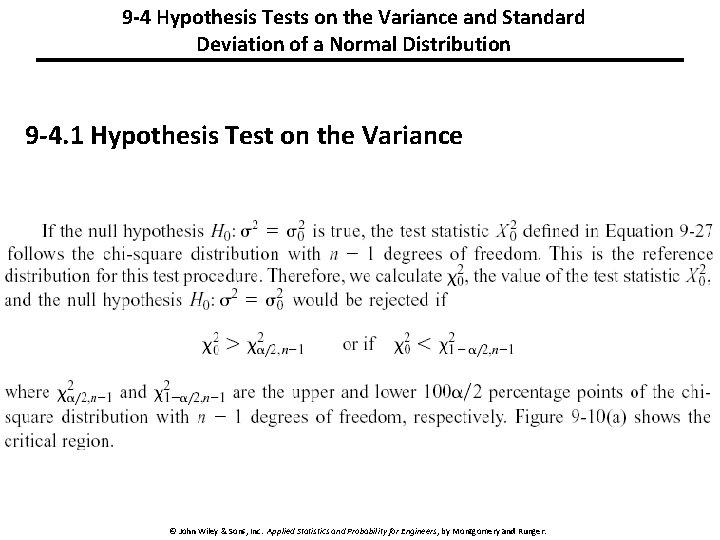
9 -4 Hypothesis Tests on the Variance and Standard Deviation of a Normal Distribution 9 -4. 1 Hypothesis Test on the Variance © John Wiley & Sons, Inc. Applied Statistics and Probability for Engineers, by Montgomery and Runger. (Eq. 9 -34, 35)
9 -4 Hypothesis Tests on the Variance and Standard Deviation of a Normal Distribution 9 -4. 1 Hypothesis Test on the Variance © John Wiley & Sons, Inc. Applied Statistics and Probability for Engineers, by Montgomery and Runger.
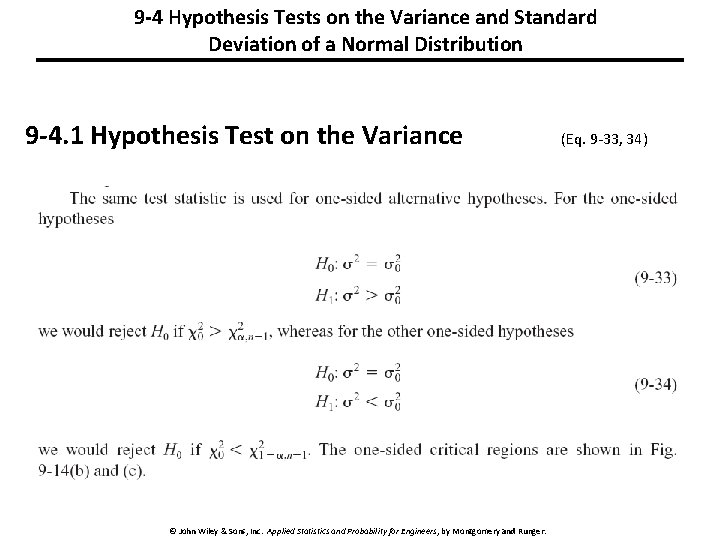
9 -4 Hypothesis Tests on the Variance and Standard Deviation of a Normal Distribution 9 -4. 1 Hypothesis Test on the Variance © John Wiley & Sons, Inc. Applied Statistics and Probability for Engineers, by Montgomery and Runger. (Eq. 9 -33, 34)
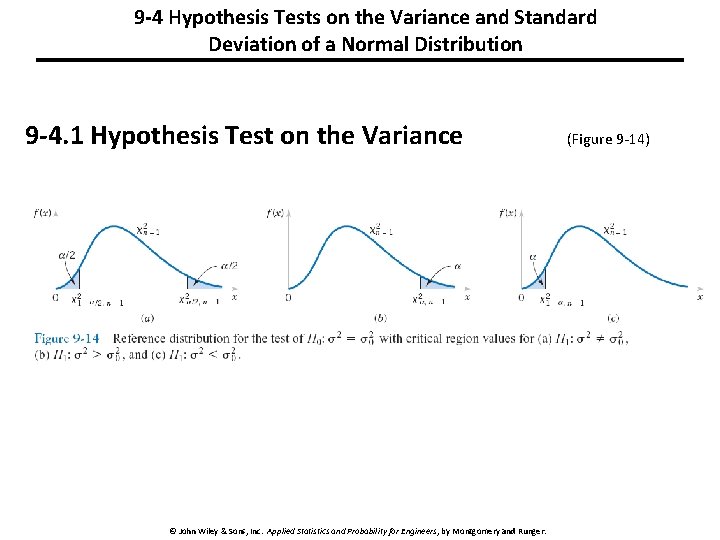
9 -4 Hypothesis Tests on the Variance and Standard Deviation of a Normal Distribution 9 -4. 1 Hypothesis Test on the Variance © John Wiley & Sons, Inc. Applied Statistics and Probability for Engineers, by Montgomery and Runger. (Figure 9 -14)
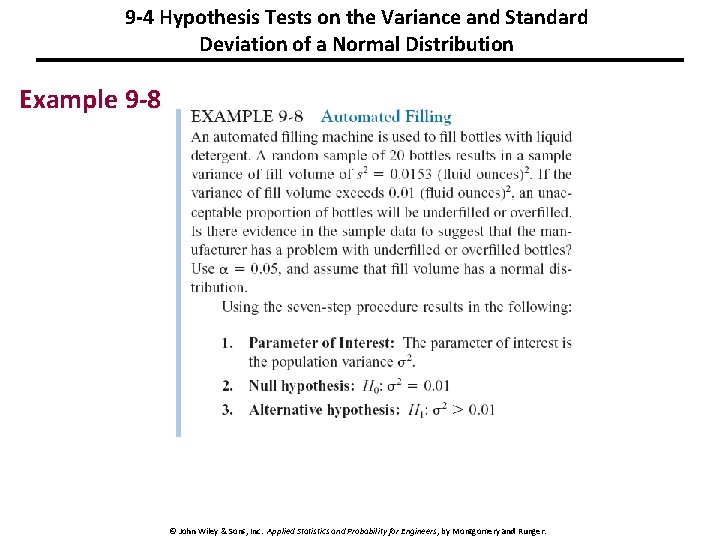
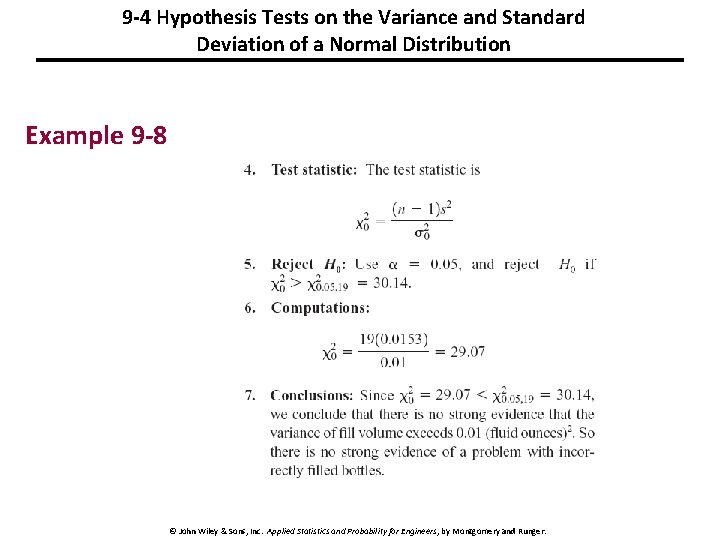
9 -4 Hypothesis Tests on the Variance and Standard Deviation of a Normal Distribution Example 9 -8 © John Wiley & Sons, Inc. Applied Statistics and Probability for Engineers, by Montgomery and Runger.
9 -4 Hypothesis Tests on the Variance and Standard Deviation of a Normal Distribution Example 9 -8 © John Wiley & Sons, Inc. Applied Statistics and Probability for Engineers, by Montgomery and Runger.