1 SII effects on asset management CFA UK


- Slides: 28
1 SII effects on asset management CFA UK 31 October 2012 Servaas Houben Maarten Koppenens
2 Agenda • The Va. R framework ▫ Return on capital in Solvency II • The current landscape ▫ ▫ Risk free rate in insurance Spread components Solvency II framework Sovereign credit risk • Opportunities for asset managers ▫ Return on capital optimisation ▫ Hedging and de-risking
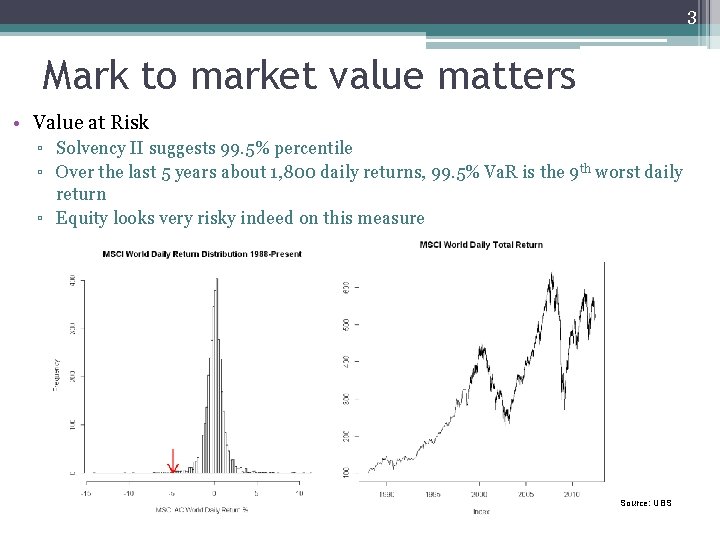
3 Mark to market value matters • Value at Risk ▫ Solvency II suggests 99. 5% percentile ▫ Over the last 5 years about 1, 800 daily returns, 99. 5% Va. R is the 9 th worst daily return ▫ Equity looks very risky indeed on this measure Source: UBS
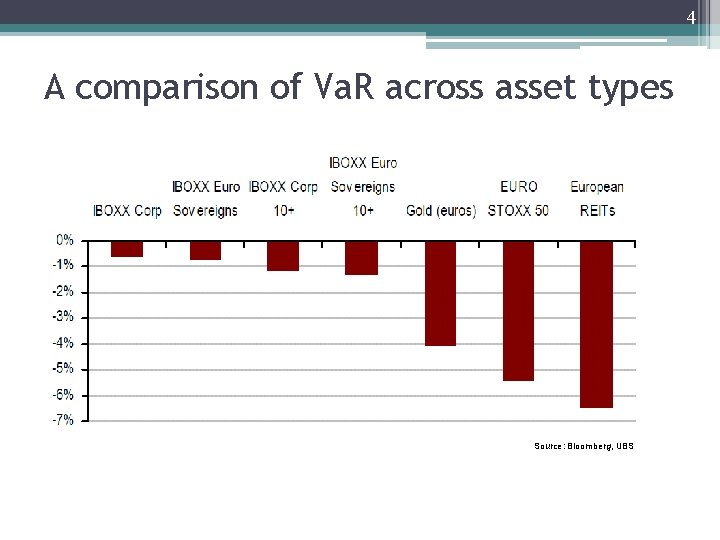
4 A comparison of Va. R across asset types Source: Bloomberg, UBS
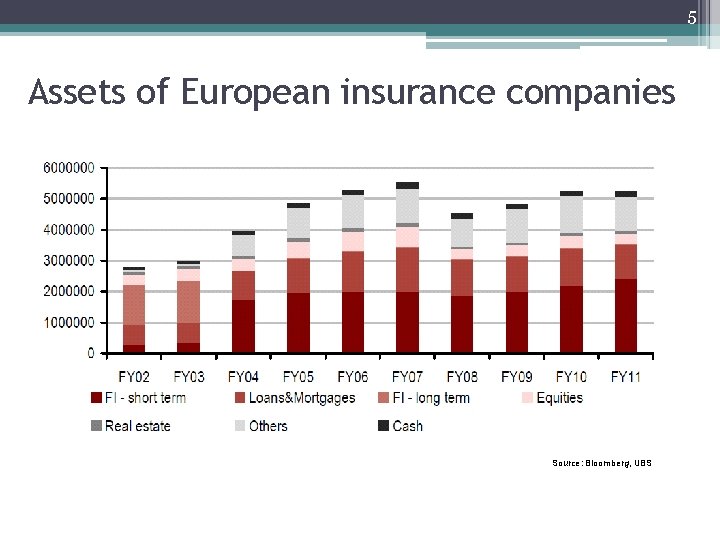
5 Assets of European insurance companies Source: Bloomberg, UBS
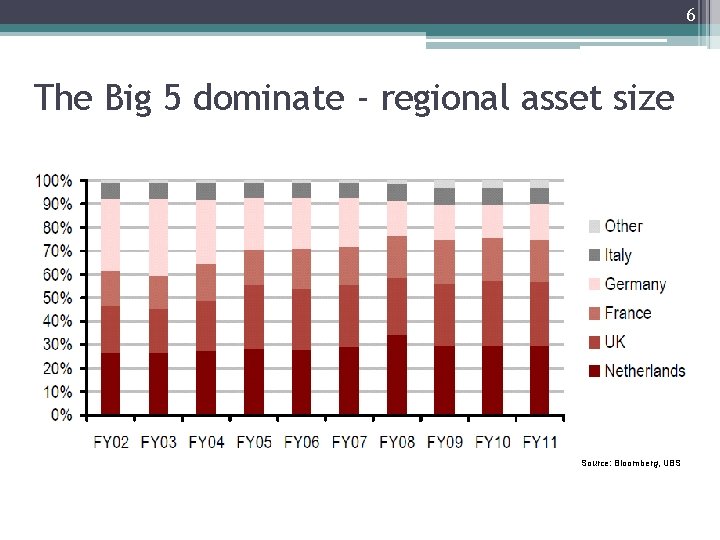
6 The Big 5 dominate - regional asset size Source: Bloomberg, UBS
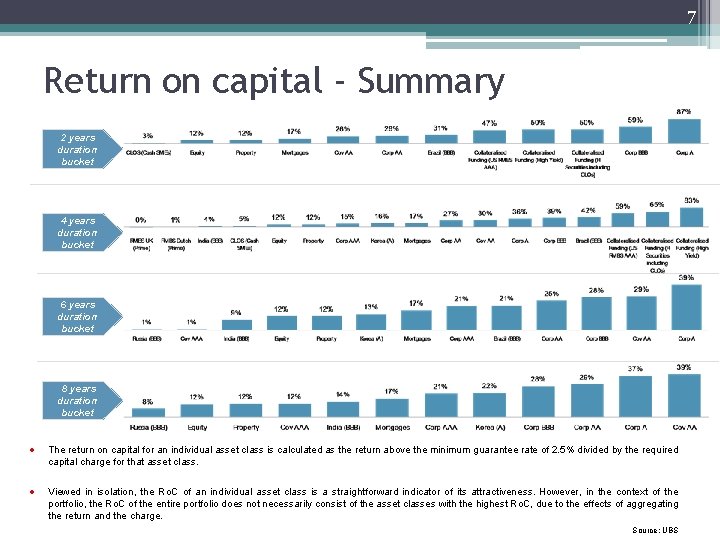
7 Return on capital - Summary 2 years duration bucket 4 years duration bucket 6 years duration bucket 8 years duration bucket · The return on capital for an individual asset class is calculated as the return above the minimum guarantee rate of 2. 5% divided by the required capital charge for that asset class. · Viewed in isolation, the Ro. C of an individual asset class is a straightforward indicator of its attractiveness. However, in the context of the portfolio, the Ro. C of the entire portfolio does not necessarily consist of the asset classes with the highest Ro. C, due to the effects of aggregating the return and the charge. Source: UBS
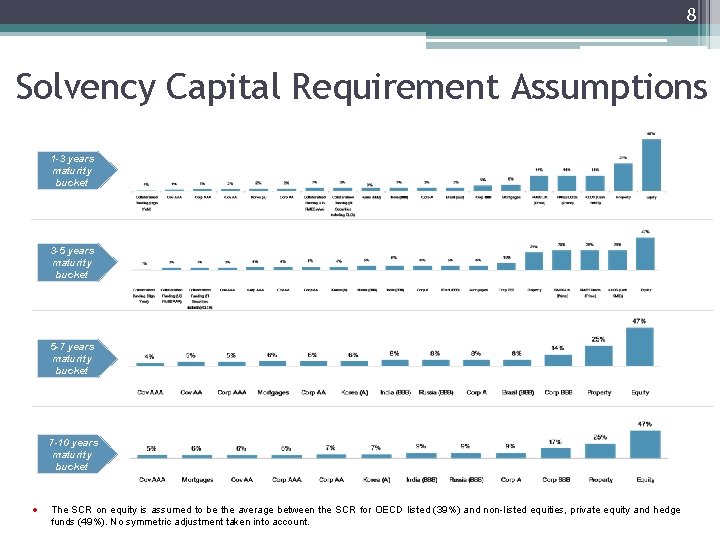
8 Solvency Capital Requirement Assumptions 1 -3 years maturity bucket 3 -5 years maturity bucket 5 -7 years maturity bucket 7 -10 years maturity bucket · The SCR on equity is assumed to be the average between the SCR for OECD listed (39%) and non-listed equities, private equity and hedge funds (49%). No symmetric adjustment taken into account.
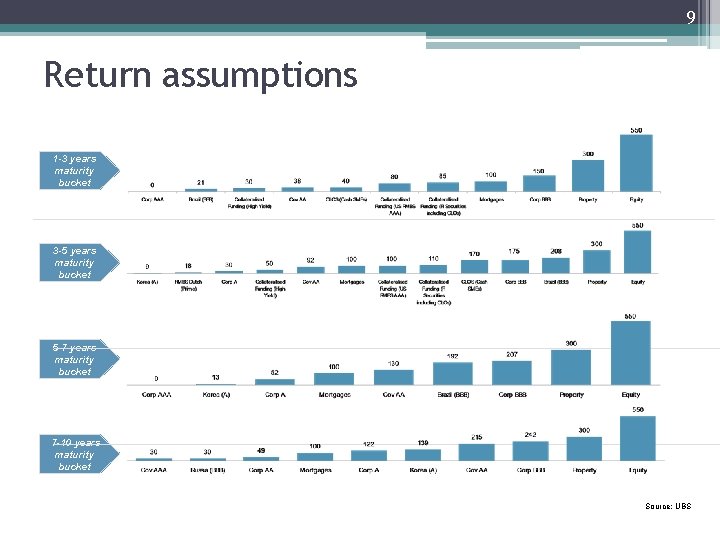
9 Return assumptions 1 -3 years maturity bucket 3 -5 years maturity bucket 5 -7 years maturity bucket 7 -10 years maturity bucket Source: UBS
10 Risk free rate concept - 1 • Several options for risk free curve: ▫Swap curve with credit adjustment ▫Government curve ▫Corporate bond curves ▫Collateralised AAA curves • Swap curves and government curves are most common, but are they also truly risk free?
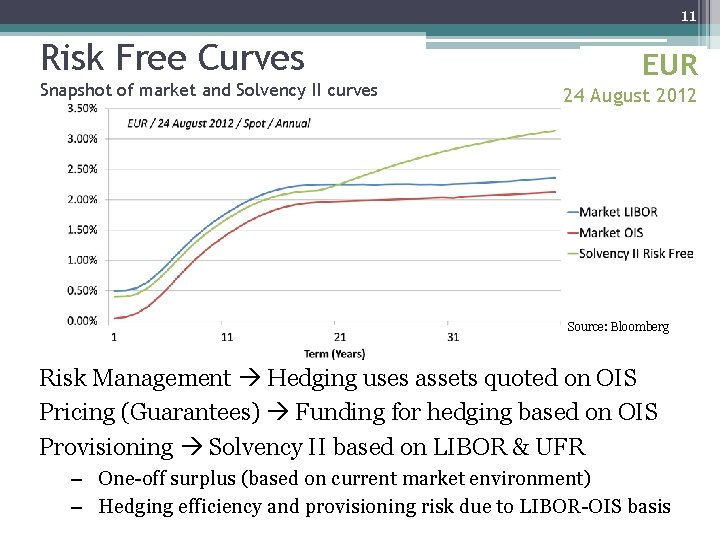
11 Risk Free Curves Snapshot of market and Solvency II curves EUR 24 August 2012 Source: Bloomberg Risk Management Hedging uses assets quoted on OIS Pricing (Guarantees) Funding for hedging based on OIS Provisioning Solvency II based on LIBOR & UFR – One-off surplus (based on current market environment) – Hedging efficiency and provisioning risk due to LIBOR-OIS basis
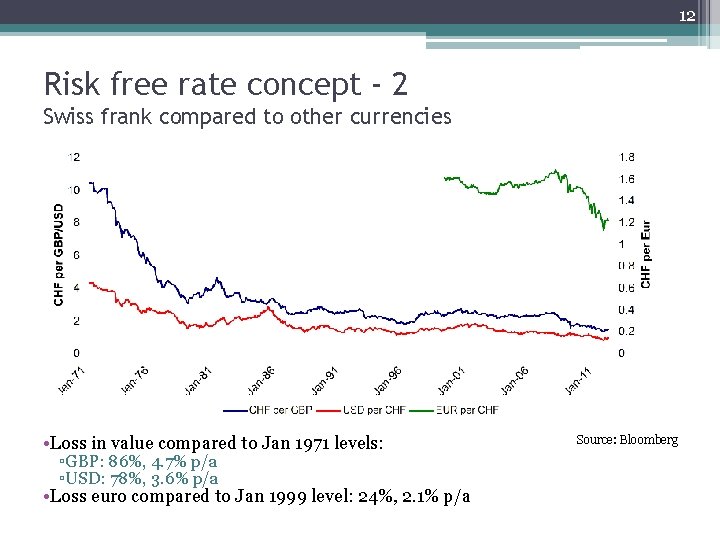
12 Risk free rate concept - 2 Swiss frank compared to other currencies • Loss in value compared to Jan 1971 levels: ▫GBP: 86%, 4. 7% p/a ▫USD: 78%, 3. 6% p/a • Loss euro compared to Jan 1999 level: 24%, 2. 1% p/a Source: Bloomberg
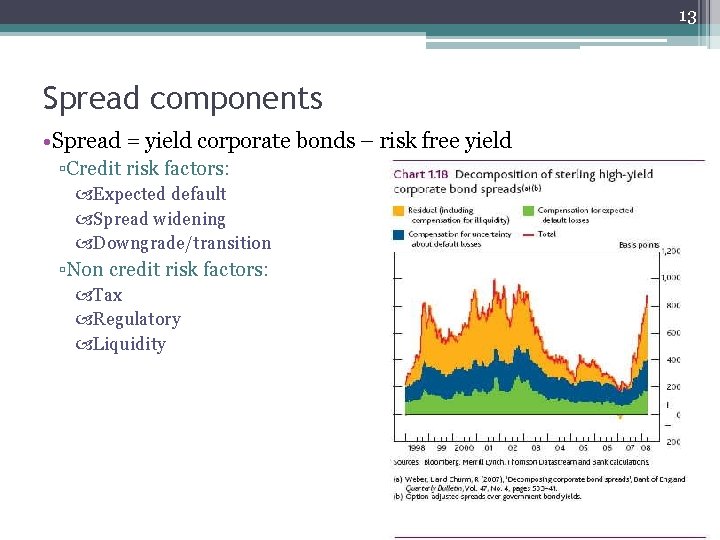
13 Spread components • Spread = yield corporate bonds – risk free yield ▫Credit risk factors: Expected default Spread widening Downgrade/transition ▫Non credit risk factors: Tax Regulatory Liquidity
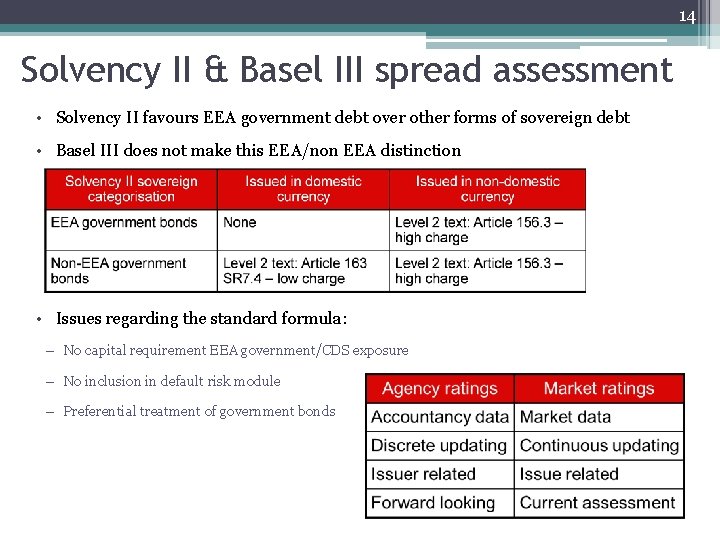
14 Solvency II & Basel III spread assessment • Solvency II favours EEA government debt over other forms of sovereign debt • Basel III does not make this EEA/non EEA distinction • Issues regarding the standard formula: – No capital requirement EEA government/CDS exposure – No inclusion in default risk module – Preferential treatment of government bonds
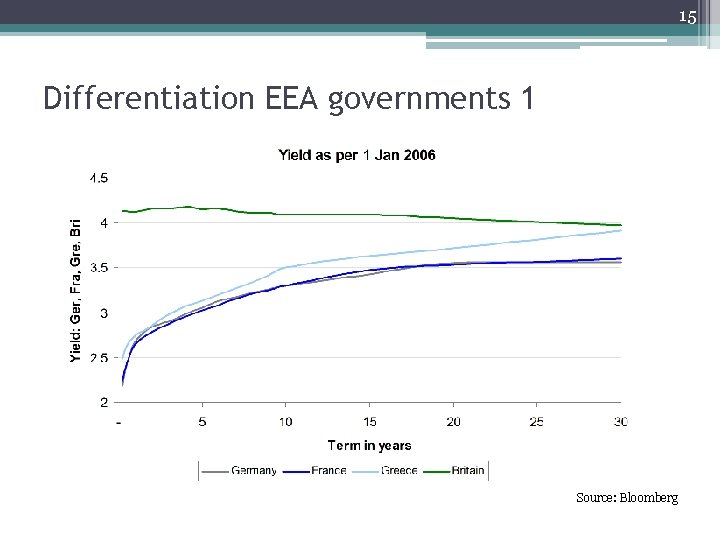
15 Differentiation EEA governments 1 Source: Bloomberg
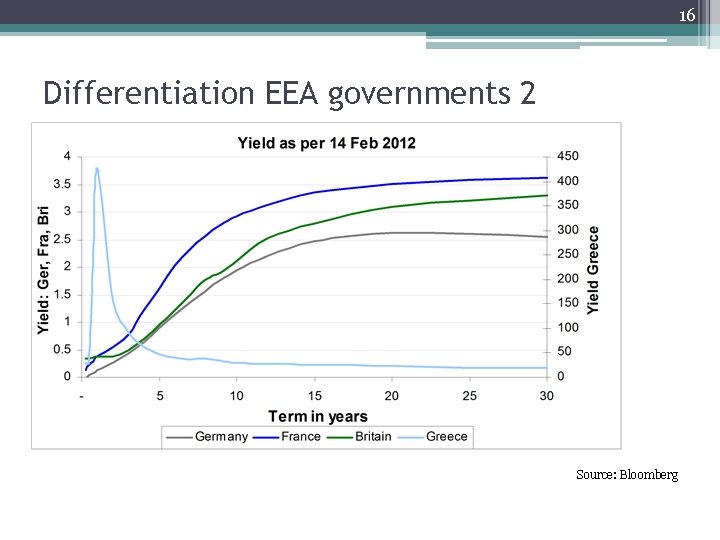
16 Differentiation EEA governments 2 Source: Bloomberg
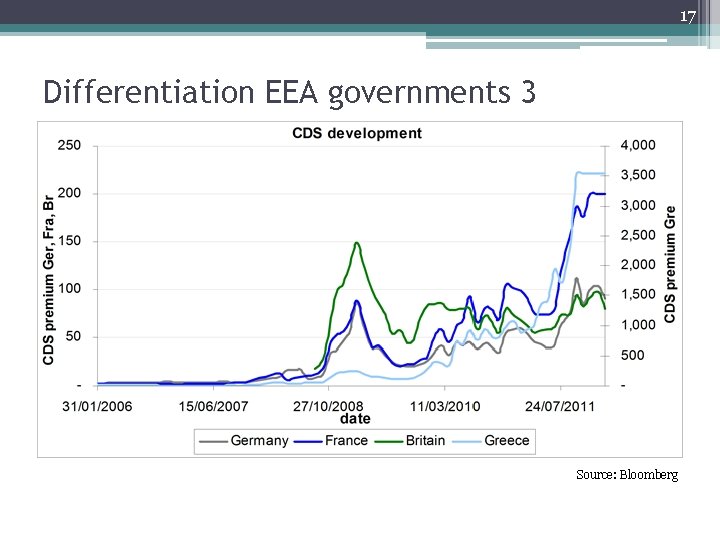
17 Differentiation EEA governments 3 Source: Bloomberg
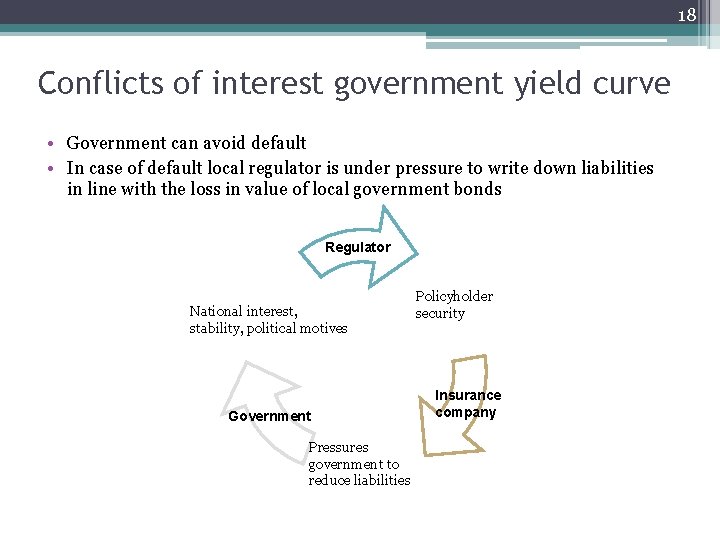
18 Conflicts of interest government yield curve • Government can avoid default • In case of default local regulator is under pressure to write down liabilities in line with the loss in value of local government bonds Regulator National interest, stability, political motives Government Pressures government to reduce liabilities Policyholder security Insurance company
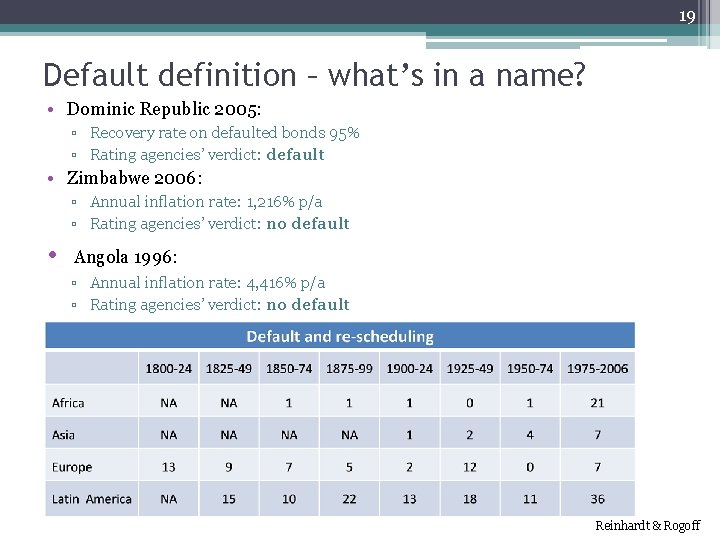
19 Default definition – what’s in a name? • Dominic Republic 2005: ▫ Recovery rate on defaulted bonds 95% ▫ Rating agencies’ verdict: default • Zimbabwe 2006: ▫ Annual inflation rate: 1, 216% p/a ▫ Rating agencies’ verdict: no default • Angola 1996: ▫ Annual inflation rate: 4, 416% p/a ▫ Rating agencies’ verdict: no default Reinhardt & Rogoff
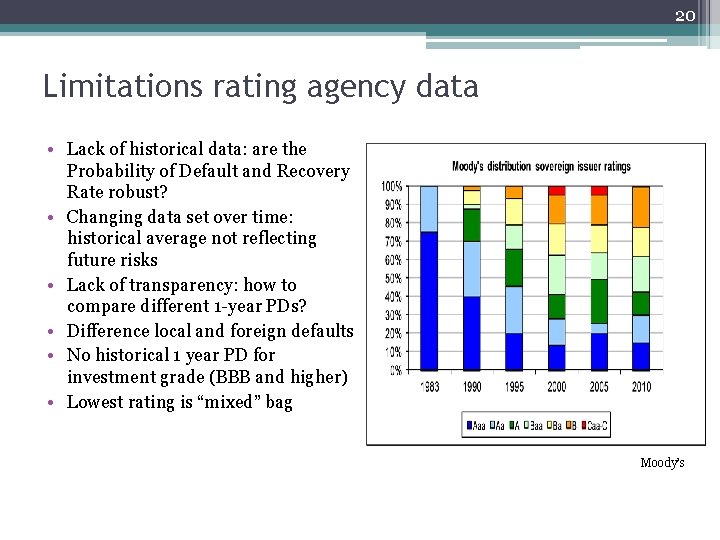
20 Limitations rating agency data • Lack of historical data: are the Probability of Default and Recovery Rate robust? • Changing data set over time: historical average not reflecting future risks • Lack of transparency: how to compare different 1 -year PDs? • Difference local and foreign defaults • No historical 1 year PD for investment grade (BBB and higher) • Lowest rating is “mixed” bag Moody’s
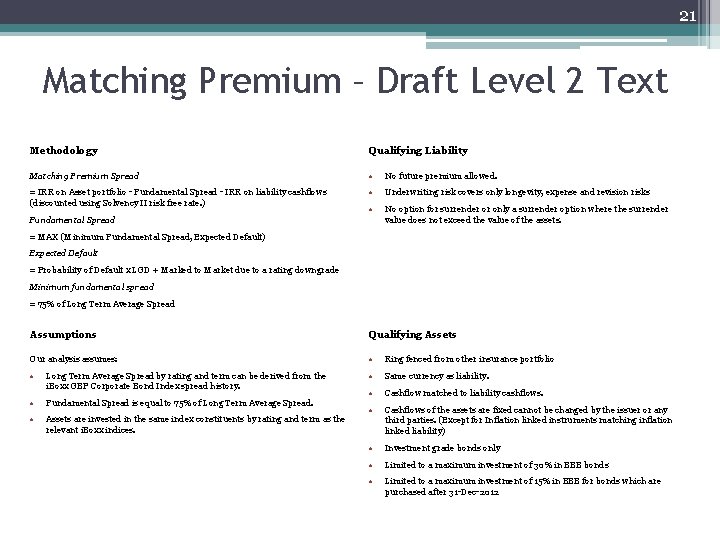
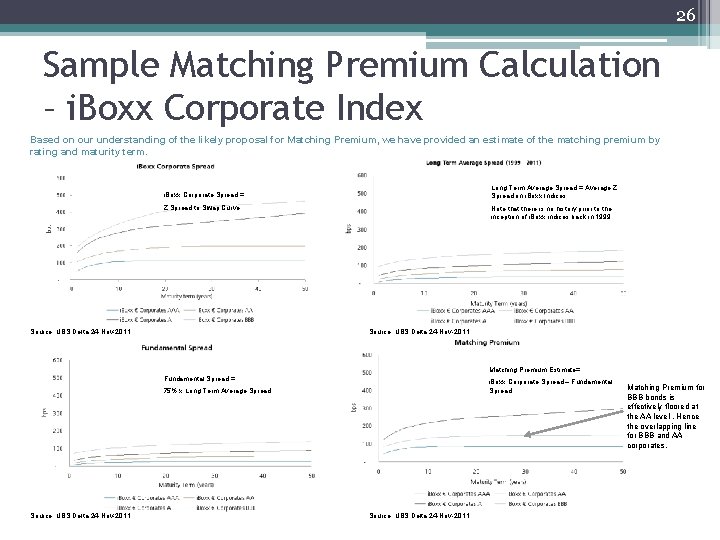
21 Matching Premium – Draft Level 2 Text Methodology Qualifying Liability Matching Premium Spread • No future premium allowed. = IRR on Asset portfolio - Fundamental Spread - IRR on liability cashflows (discounted using Solvency II risk free rate. ) • Underwriting risk covers only longevity, expense and revision risks • No option for surrender or only a surrender option where the surrender value does not exceed the value of the assets. Fundamental Spread = MAX (Minimum Fundamental Spread, Expected Default) Expected Default = Probability of Default x LGD + Marked to Market due to a rating downgrade Minimum fundamental spread = 75% of Long Term Average Spread Assumptions Qualifying Assets Our analysis assumes: • Ring fenced from other insurance portfolio • Long Term Average Spread by rating and term can be derived from the i. Boxx GBP Corporate Bond Index spread history. • Same currency as liability. • Fundamental Spread is equal to 75% of Long Term Average Spread. • Cashflow matched to liability cashflows. • Assets are invested in the same index constituents by rating and term as the relevant i. Boxx indices. • Cashflows of the assets are fixed cannot be changed by the issuer or any third parties. (Except for Inflation linked instruments matching inflation linked liability) • Investment grade bonds only • Limited to a maximum investment of 30% in BBB bonds • Limited to a maximum investment of 15% in BBB for bonds which are purchased after 31 -Dec-2012
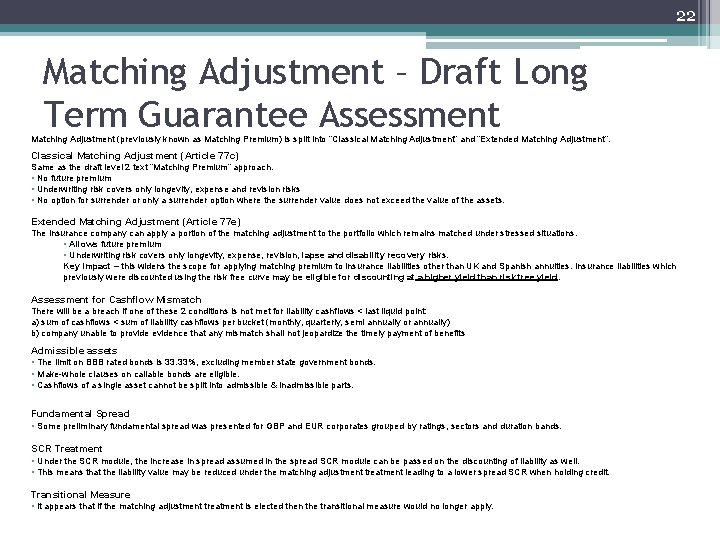
22 Matching Adjustment – Draft Long Term Guarantee Assessment Matching Adjustment (previously known as Matching Premium) is split into “Classical Matching Adjustment” and “Extended Matching Adjustment”. Classical Matching Adjustment (Article 77 c) Same as the draft level 2 text “Matching Premium” approach. • No future premium • Underwriting risk covers only longevity, expense and revision risks • No option for surrender or only a surrender option where the surrender value does not exceed the value of the assets. Extended Matching Adjustment (Article 77 e) The insurance company can apply a portion of the matching adjustment to the portfolio which remains matched under stressed situations. • Allows future premium • Underwriting risk covers only longevity, expense, revision, lapse and disability recovery risks. Key Impact – this widens the scope for applying matching premium to insurance liabilities other than UK and Spanish annuities. Insurance liabilities which previously were discounted using the risk free curve may be eligible for discounting at a higher yield than risk free yield. Assessment for Cashflow Mismatch There will be a breach if one of these 2 conditions is not met for liability cashflows < last liquid point: a) sum of cashflows < sum of liability cashflows per bucket (monthly, quarterly, semi annually or annually) b) company unable to provide evidence that any mismatch shall not jeopardize the timely payment of benefits Admissible assets • The limit on BBB rated bonds is 33. 33%, excluding member state government bonds. • Make-whole clauses on callable bonds are eligible. • Cashflows of a single asset cannot be split into admissible & inadmissible parts. Fundamental Spread • Some preliminary fundamental spread was presented for GBP and EUR corporates grouped by ratings, sectors and duration bands. SCR Treatment • Under the SCR module, the increase in spread assumed in the spread SCR module can be passed on the discounting of liability as well. • This means that the liability value may be reduced under the matching adjustment treatment leading to a lower spread SCR when holding credit. Transitional Measure • It appears that if the matching adjustment treatment is elected then the transitional measure would no longer apply.
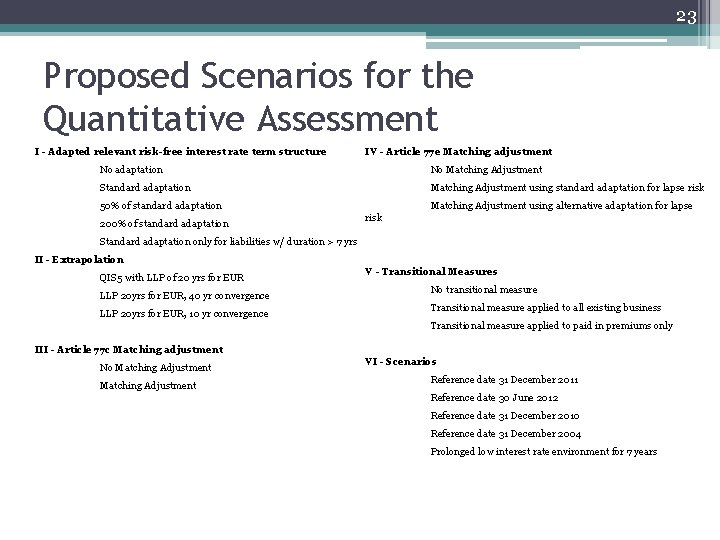
23 Proposed Scenarios for the Quantitative Assessment I - Adapted relevant risk-free interest rate term structure IV - Article 77 e Matching adjustment No adaptation No Matching Adjustment Standard adaptation Matching Adjustment using standard adaptation for lapse risk 50% of standard adaptation 200% of standard adaptation Matching Adjustment using alternative adaptation for lapse risk Standard adaptation only for liabilities w/ duration > 7 yrs II - Extrapolation QIS 5 with LLP of 20 yrs for EUR LLP 20 yrs for EUR, 40 yr convergence LLP 20 yrs for EUR, 10 yr convergence V - Transitional Measures No transitional measure Transitional measure applied to all existing business Transitional measure applied to paid in premiums only III - Article 77 c Matching adjustment No Matching Adjustment VI - Scenarios Reference date 31 December 2011 Reference date 30 June 2012 Reference date 31 December 2010 Reference date 31 December 2004 Prolonged low interest rate environment for 7 years
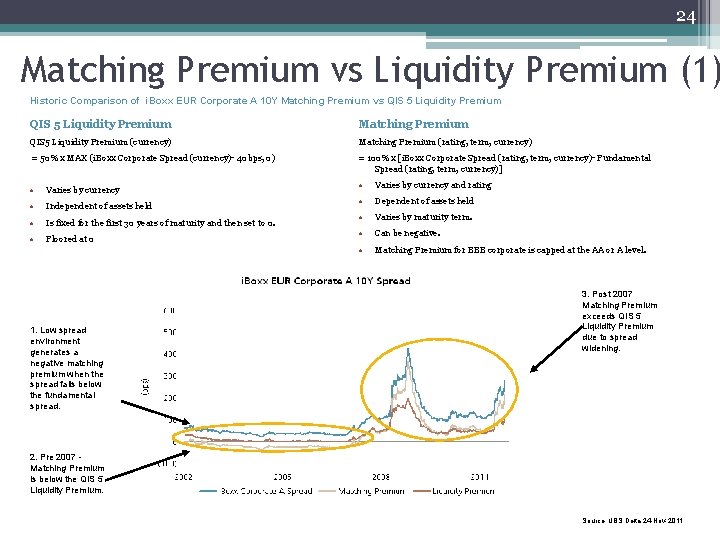
24 Matching Premium vs Liquidity Premium (1) Historic Comparison of i. Boxx EUR Corporate A 10 Y Matching Premium vs QIS 5 Liquidity Premium Matching Premium QIS 5 Liquidity Premium (currency) Matching Premium (rating, term, currency) = 50% x MAX (i. Boxx Corporate Spread (currency)- 40 bps, 0) = 100% x [i. Boxx Corporate Spread (rating, term, currency)- Fundamental Spread (rating, term, currency)] • Varies by currency • Independent of assets held • Is fixed for the first 30 years of maturity and then set to 0. • Floored at 0 1. Low spread environment generates a negative matching premium when the spread falls below the fundamental spread. • Varies by currency and rating • Dependent of assets held • Varies by maturity term. • Can be negative. • Matching Premium for BBB corporate is capped at the AA or A level. 3. Post 2007 Matching Premium exceeds QIS 5 Liquidity Premium due to spread widening. 2. Pre 2007 - Matching Premium is below the QIS 5 Liquidity Premium. Source: UBS Delta 24 -Nov-2011
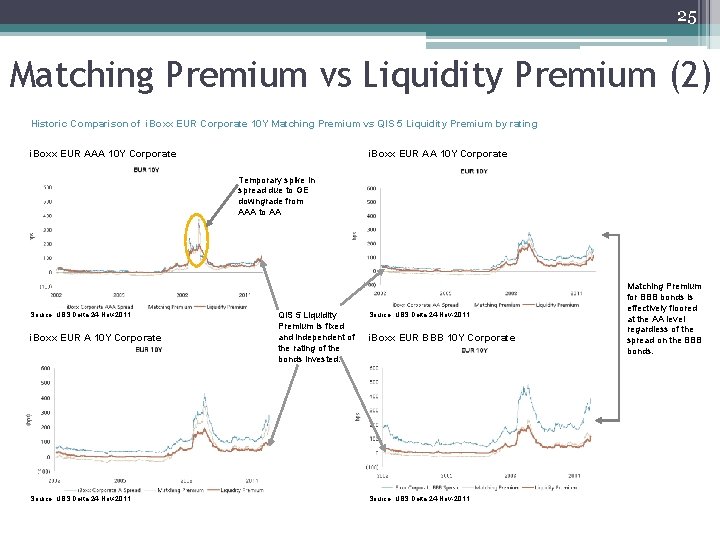
25 Matching Premium vs Liquidity Premium (2) Historic Comparison of i. Boxx EUR Corporate 10 Y Matching Premium vs QIS 5 Liquidity Premium by rating i. Boxx EUR AAA 10 Y Corporate i. Boxx EUR AA 10 Y Corporate Temporary spike in spread due to GE downgrade from AAA to AA Source: UBS Delta 24 -Nov-2011 i. Boxx EUR A 10 Y Corporate Source: UBS Delta 24 -Nov-2011 QIS 5 Liquidity Premium is fixed and independent of the rating of the bonds invested. Source: UBS Delta 24 -Nov-2011 i. Boxx EUR BBB 10 Y Corporate Source: UBS Delta 24 -Nov-2011 Matching Premium for BBB bonds is effectively floored at the AA level regardless of the spread on the BBB bonds.
26 Sample Matching Premium Calculation – i. Boxx Corporate Index Based on our understanding of the likely proposal for Matching Premium, we have provided an estimate of the matching premium by rating and maturity term. Long Term Average Spread = Average Z Spread on i. Boxx Indices. i. Boxx Corporate Spread = Z Spread to Swap Curve Source: UBS Delta 24 -Nov-2011 Note that there is no history prior to the inception of i. Boxx indices back in 1999. Source: UBS Delta 24 -Nov-2011 Matching Premium Estimate= Fundamental Spread = i. Boxx Corporate Spread – Fundamental Spread 75% x Long Term Average Spread Source: UBS Delta 24 -Nov-2011 Matching Premium for BBB bonds is effectively floored at the AA level. Hence the overlapping line for BBB and AA corporates.
27 About us Servaas Houben heads the risk scenario generation team at Prudential, London. He studied econometrics in the Netherlands and worked in life insurance for the first four years of his career. Following this, he worked in Dublin and London. Besides actuarial, Servaas completed the CFA and FRM qualifications, and regularly writes on his blog, for CFA digest and Dutch actuarial magazines. • Email: servaashouben@gmail. com • Blog: http: //actuaryabroad. wordpress. com • Tel: +44 (0) 207 548 2774 Maarten Koppenens joined UBS in April 2010 and is responsible for Dutch insurance solutions focusing on accounting and regulatory frameworks, liability management and optimalisation of asset allocation. Prior to joining UBS, Maarten worked at Swiss Re as a marketing actuary focusing on de-risking of insurance liabilities. Besides being a qualified actuary, Maarten holds a degree in econometrics and an MBA. • Email: maarten. koppenens@ubs. com • +44 (0) 207 567 4357
28 References & contact details • Churm & Panigirtzoglou, Decomposing credit spreads, Bank of England working paper no 253 • Kahneman, Thinking fast and slow, 3 November 2011 • Moody’s, Corporate Default and Recovery Rates, 1983 -2010, February 28, 2011 • Moody’s, Narrowing the gap – a clarification of Moody's approach to local versus foreign currency government bond ratings, February 2010 • Moody’s, Sovereign Default and Recovery Rates, 1983 -2010, May 10, 2011 • Reinhart & Rogoff, This time is different: A Panoramic View of Eight Centuries of Financial Crises, April 16, 2008 • Remolona, Scatigna, Wu, A ratings-based approach to measuring sovereign credit risk, International Journal of Finance and Economics volume 13 (2008) • S&P, Sovereign Defaults And Rating Transition Data, 2010 Update, 23 Feb 2011 • Webber – bank of England, Decomposing corporate bond spreads, 2007 Q 4