WORKSHOP ON GHG H E Jonathan Mueke Deputy


 40% of urban trips are")

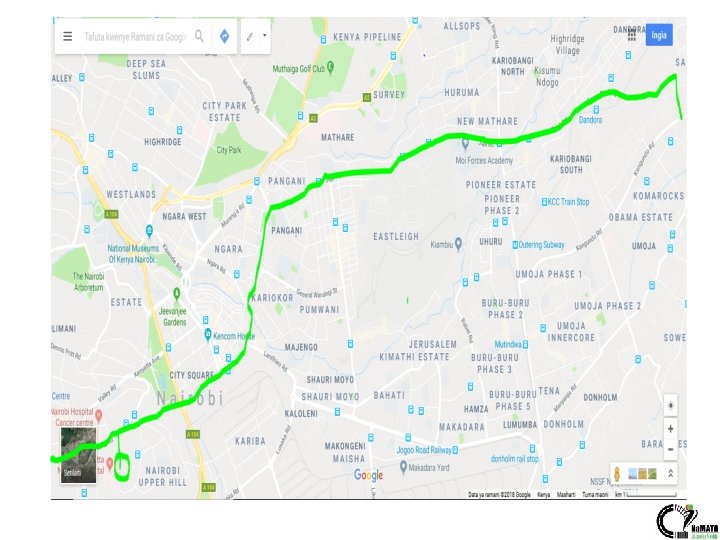
 Thika Super Highway")
")


 Draft final design (with BRT)")


")

- Slides: 43
WORKSHOP ON GHG H. E Jonathan Mueke Deputy Governor Nairobi City County Email: info@nairobi. go. ke Web : www. Nairobi. go. ke J. K. MWANGI Na. MATA 1
NAIROBI – BRT PROJECT
Overview • CURRENT SITUATION • DEFINING THE PROJECT • IDENTIFYING GHG EFFECTS • ESTIMATING GHG REDUCTIONS •
Modal split in Nairobi Source: JICA Study Team (JST) 40% of urban trips are made on foot NMT – current situation 4
Mode and person trip modal split Traffic composition on our roads Mobility problems are primarily related to PT and NMT because only a very small percentage of population (5%) have access to private cars
Current Status New Museum Hill Rd/ Chiromo Rd Junction (evening peak) Thika Super Highway (morning peak) 6
Access to car vs Equity While only a small proportion of Nairobi residents (5%) have access to private cars, a sample traffic composition analysis on major arterials into the city reveals that private cars constitute about 70% of the traffic. This reflects a very inefficient use of road space that completely lacks social equity. For sustainable mobility, the transport system must achieve 3 objectives viz- Economy, Equity & Environment
Increased car use & congestion The main reasons for increased car use in the city are: – Poor public transport system. – Lack of effective deterrents for car use. – People’s attitude towards public transport and NMT. As a result of increased car use, severe traffic congestion is encountered on all major roads that lead to the City Centre – with it comes air pollution.
Planned Rapid transit network for Nairobi Appr 54 km of BRT corridor are in various stages of planning and design
LINE 1
` STATUS JKIA turn Off to Likoni (Lot 1) Draft final design (with BRT) completed. Go. K funding Likoni to James Gichuru (Lot 2) Draft final design (without BRT) completed. Go. K funding Concept design study including BRT on-going. Procurement process for detailed design study on-going. WB funding James Gichuru to Rironi (Lot 3) Final design completed for road upgrading with median reserve for BRT. Go. K funding Funding to be identified for specific BRT study Line 2 Simba Bomas – Ruiru Langata Road – Thika Road To be identified Line 3 Chui Njiru – Show Ground Ngong Road - Juja Road On-going (same study as for Line 4 West). Feasibility phase completed in 2017. Detailed design in 2018. EU funding West (Mbagathi Road) Same study as for Line 3 - Feasibility study done, Detailed design in 2018. EU funding East (Jogoo Road) Draft final design completed. Af. DB funding Line 1 Ndovu Kangemi – Imara Line 4 Kifaru Mama Lucy – T-Mall Line 5 Nyati Balozi - Imara Design review of current upgrading works on going to allow for further BRT insertion. Af. DB funding Outer Ring road 11 Korean Consultant has submitted draft Feasibility study report.
Outline of steps 1. Define the action 2. Identify effects 3. Quantify effects 4. Report results
DEFINING THE PROJECT Defining the Nairobi BRT project Nairobi is currently developing the first phase of a Bus Rapid Transit System Action description for the city. Na. MATA proposes to transform its transportation within the city by construction of five Bus Rapid Transit (BRT) Corridors which are at different stages of implementation from design to procurement for implementation. Action objectives • To promote a shift to public transport • To provide an environmentally friendly transport system • To improve air quality in the city and reduce GHG emissions • Increase mobility for the city • Provide cheap, flexible and quick to implement public transport
DEFINING THE PROJECT Defining the Nairobi BRT City Nairobi Title of action BRT Phase II Sector Transport Action category Activity On-road Action Public transport Type of action Infrastructure program Status of action Planned Geographic coverage Line 3 - Chui Line - Starts at Njiru and terminates at showground. Implementing Na. MATA organisation(s) Implementation 2019 - 2020 period Assessment 2021 - 2030 period Type of Ex-ante assessment Year of 2017 assessment
Identifying GHG effects
IDENTIFYING GHG EFFECTS Map a causal chain A causal chain is a conceptual diagram tracing the process by which the project leads to GHG effects through a series of interlinked logical and sequential stages of cause and-effect relationships. Mapping the causal chain helps to: • identify effects previously not identified • visually show a policy/action leads to changes in emissions • enhance policy design and effectiveness • communicate to stakeholders
IDENTIFYING GHG EFFECTS Causal chain for BRT project
IDENTIFYING GHG EFFECTS Identifying significant GHG effects Primary source / sink category Jurisdiction Likelihood Magnitude Include Reduced emissions from use of matatus, conventional buses and private cars On-road transportation Within city boundary Likely Moderate ✓ Increased emissions from fueling buses On-road transportation Within city boundary Very likely Major ✓ Within city boundary Unlikely Minor Within city boundary Possible Minor Within city boundary Unlikely Minor Unlikely Moderate GHG effect name Increased/reduced emissions from manufacturing (due to changes in disposable Stationary Energy income) Reduced emissions from reduced idling time On-road transportation Increased GHG emissions from private On-road vehicles (rebound effect) transportation Reduced emissions from car /taxi Stationary manufacturing Energy Outside city boundary Increased emissions from material production Stationary for constructing BRT infrastructure Energy Within city boundary Very likely Moderate (included by reported separately) Increased emissions from bus manufacturing Stationary Energy Outside city boundary Likely Moderate Increased emissions due to increased idling times On-road transportation Within city boundary Likely Minor ✓
Estimating emission reductions
ESTIMATING GHG EFFECTS Estimating emission reductions The purpose of this session is to: • Highlight the steps followed to estimate emission reductions from the project • Identify parameters/data required to estimate emissions
ESTIMATING GHG EFFECTS Steps Estimate baseline emissions Estimate scenario emissions Subtract baseline emissions from scenario emissions • Baseline scenario: A reference case that represents the conditions most likely to occur in the absence of the action being assessed • Policy scenario: A scenario that represents the conditions most likely to occur in the presence of the action being assessed (same as the baseline scenario except that it includes the action being assessed)
ESTIMATING GHG EFFECTS Defining the BRT baseline and policy scenario Baseline scenario • No BRT being implemented. Passengers use a mix of transportation modes. Policy scenario • Implementation of the BRT. Passengers are transported in the BRT that partially displaces the existing transport system.
ESTIMATING GHG EFFECTS Estimating emission reductions from the BRT • The causal chain helps to identify significant GHG effects from the BRT that needs to be estimated. • Significant effects identified from the previous presentation were: Reduced emissions from use of other transport modes Increased GHG emissions from fuel use in BRT GHG effect #2 buses Increased GHG emissions from production of GHG effect #3 materials for BRT construction GHG effect #1 • GHG effect #1 can be broken down into reduced emissions from: • minibus taxis (matatus) • private vehicles • conventional (older) buses • taxis
ESTIMATING GHG EFFECTS GHG effects in baseline and policy scenarios GHG effect Description Inclusion in estimation Baseline scenario Policy scenario #1. 1 Emissions from use of minibus taxis (matatus) Emissions from passengers using Included. minibus taxis in the absence of Estimated values. the BRT Not necessary, passengers shift to BRT. #1. 2 Emissions from use of private cars Emissions from passengers using Included. private cars in the absence of the Estimated values. BRT Not necessary, passengers shift to BRT. #1. 3 Emissions from use of conventional buses Emissions from passengers using Included. conventional buses in the Estimated values. absence of the BRT Not necessary, passengers shift to BRT. #2. Emissions from BRT buses Emissions from use of BRT based Not included, in estimated vehicle km travelled BRT does not exist. Included. Estimated values. Emissions from production of materials for BRT construction Included. Estimated values. #3 Emissions from materials production Not necessary. BRT does not exist.
ESTIMATING GHG EFFECTS GHG effect #1 Emissions from use of minibus taxis/conventional buses and private cars/taxis GHG emissions = Fuel efficiency * Emissions factor * Trip distance * 1/occupancy rate * Modal share * No. of BRT passengers Where: Fuel efficiency of alternative mode (litres/km) Emissions factor Trip distance 1 / occupancy rate Modal share No. of passengers using BRT Fuel consumed per km travelled (litres/km) of alternative mode in absence of the BRT Emissions factor fuel type (kg. CO 2 e/litre) Average distance travelled by alternative mode per vehicle (km) Daily occupancy rate of alternative mode Percentage of passengers transported by the project (BRT) in year that without the BRT would have used minibus taxis, conventional bus or private car Total number of passengers estimated to be transported by the project (BRT) per year
ESTIMATING GHG EFFECTS – GHG EFFECT 1 Fuel efficiency factors used
ESTIMATING GHG EFFECTS – GHG EFFECT 1 Emission factors: convert activity data into a mass of GHG emissions Fuel Gasoline Diesel Units 2017 - 2030 kg. CO 2 e/litre 2, 30 2, 68 Source/ assumptions UK Defra
ESTIMATING GHG EFFECTS – GHG EFFECT 1 Trip distance: The average distance travelled per trip per transport mode i. e. one-way between an origin and destination Vehicle Passenger cars Matatus Conventional buses Units km km km 2017 - 2030 10 15 15
ESTIMATING GHG EFFECTS – GHG EFFECT 1 Occupancy rate: The number of people traveling travelling per transport mode per trip Vehicle Passenger cars Taxis Matatus Conventional buses Units # # # 2017 – 2030 1, 7 4 25 # 45
ESTIMATING GHG EFFECTS – GHG EFFECT 1 Modal shift to BRT Modal shift: % of passengers shifting from other modes of transport to the BRT Vehicle Units 2019 2020 2025 2030 Passenger cars/ taxis % 8% 9% 12% Matatus Conventional buses % % 55% 6% Source / Assumptions Derived from Jo’burg BRT modal shift 15% survey, amended to consider modal share of Nairobi compared to Jo’burg 55% 6% Walking / cycling % 31% 30% 28% 24% Total % 100%
ESTIMATING GHG EFFECTS – GHG EFFECT 1 Number of BRT passengers Estimated number of passengers to use the BRT Line 3 based on traffic and passenger counts in the corridor. Parameter Passengers per day Operating days per annum Passengers per annum 2019 2020 2025 2030 281250 295673 338942 375000 365 102 656 250 365 107 920 673 365 111 079 327 365 114 237 981 Source MRTS Harmonisation Study, pg 7 -3
ESTIMATING GHG EFFECTS – GHG EFFECT 2 GHG effect #2 Emission from fuel use of BRT GHG emissions = Average fuel efficiency of BRT buses * Emission factor for diesel * Total estimated km travelled by BRT buses (Distance of BRT corridor * No. of trips per year) Where: Average fuel efficiency of Litres of fuel consumed per km travelled in BRT buses (litres/km) Emission factor for diesel Emissions factor per litre of diesel consumed (kg. CO 2 e/l) Distance of BRT corridor (21, 7 km) No. of trips per year Based on number of bus services trips per year
ESTIMATING GHG EFFECTS – GHG EFFECT 2 GHG effect #2: No. of trips per year = No. of passengers per day / (Bus capacity/Occupancy rate) * 365 Parameter Number of trips Passengers per day Capacity Occupancy rate Base year Baseline scenario Units 2019 2020 2025 2030 # 3017 3459 3827 journeys 2870 per day #passeng 281250 295673 338942 375000 ers 140 140 70% 70% Source / Assumptions determine based on passengers per day, bus capacity and occupancy rates MRTS Harmonisation Study, pg 7 -3 MRTS Harmonisation Study, pg 7 -2
Updated ESTIMATING GHG EFFECTS – GHG EFFECT 3 GHG effect #3: Emissions from material production for bus lanes GHG emissions = ΣM ( QM * EFM * L) M = Materials used (cement, asphalt and steel) QM = Quantity of material used (tonnes/km) EFM = Emission factor per tonne of material used (t. CO 2 e/tonne) L = Total length of the bus lane (km)
ESTIMATING GHG EFFECTS – GHG EFFECT 3 GHG effect #3: Emissions from material production for bus lanes GEI = ΣL (EFL * L) GEI = Emissions (t. CO 2 e) M Cement Bitumen Steel 403. 5 tonnes/km 143. 2 tonnes/km EFL = 737. 8 tonnes/km EFL = 1900 tonnes CO 2 e/km is used for construction based on actual experience from other cities (ITPD, TEEMP, 2015) L = 21, 7
ESTIMATING GHG EFFECTS Key parameters • Number of people switching to buses • Alternative modes of transport and % share of people from alternative modes switching to BRT • Average trip distance traveled by BRT • Average occupancy per vehicle • Average fuel efficiency per vehicle and fuel type • Emission factor per fuel type • Length of BRT
Results
RESULTS GHG emission reductions from the BRT – Line 3 Units Emissions 2019 2020 2021 2022 2023 2024 2025 2026 2027 2028 2029 2030 Total baseline GHG emissions t. CO 2 e 29 799 32 689 34 360 36 100 37 916 39 805 41 211 43 475 45 821 48 260 50 785 53 400 Total policy scenario GHG emissions t. CO 2 e 31 025 31 965 32 905 33 845 34 785 35 725 36 666 37 606 38 546 39 486 40 426 41 366 Total net reduction in GHG emissions t. CO 2 e 1 226 - 724 1 455 2 254 3 131 4 079 Total net cumulative reduction in GHG emissions since start of assessment period t. CO 2 e 1 226 - 502 - 953 3 208 6 338 10 418 14 963 20 832 28 108 36 881 47 241 59 274 4 546 5 869 7 275 8 774 10 359 12 033
RESULTS GHG emission reductions
RESULTS GHG emission reductions per effect GHG effect #1 Switch to BRT from cars/taxis #2 Switch to BRT from matatus #3 Switch to BRT from conventional buses Avoided emissions Per annum (2030) Cumulative 25 178 195 748 27 842 294 240 379 3 632 493 620
RESULTS GHG emissions from constructing the BRT Emissions from constructing the BRT (line 3) – 2019 41 230 t. CO 2 e 1 900 t. CO 2 e per km x 21, 7 km
Reduction in number of vehicles on the road Baseline scenario vehicle numbers by 2030 Policy scenario vehicle numbers by 2030 16 544 cars Car 289 BRT buses 4 125 matatus BRT Bus Matatus 469 buses Bus is replaced by: