Virginia Association of Secondary School Principals VASSP Summer


 students represent twelve percent (12%) of the")


 Level 2 (Near Standard) Level 3 (Below")


 Accredited with")


- Slides: 30
Virginia Association of Secondary School Principals VASSP Summer Conference Portsmouth Renaissance June 26, 2017
“Leadership is the capacity to translate vision into reality. ” -Warren G. Bennis 2
The Changing Face of Student Enrollment in Virginia Fall 2006 -07 Unspecifie d 8, 51% Am-Indian 0, 30% Fall 2016 -17 Asian 4, 85% 2 or More 5, 35% Black 24, 48% White 54, 29% Hispanic 7, 57% Source: VDOE Fall Membership Data Am. Indian 0, 28% Asian 6, 82% Black 22, 64% White 49, 78% Hispanic 15, 13% 3
Student Demographics • English Language Learner (ELL) students represent twelve percent (12%) of the statewide student enrollment or 154, 020 students. • Economically Disadvantaged students represent thirty-eight percent (38%) of the statewide student enrollment or 487, 834 students. • More than half of Virginia students (50. 22%) identify as non-white. 4
Two Priority Reforms Underway ü High School Redesign: Profile of a Virginia Graduate ü Accreditation Matrix/ESSA State Plan
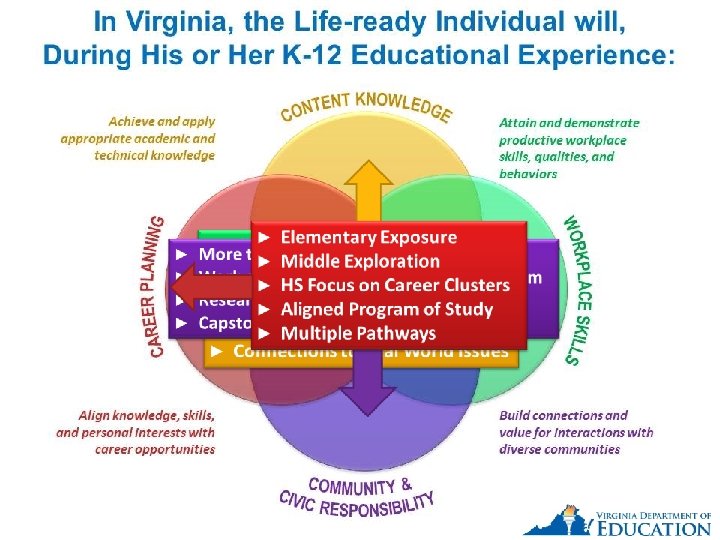
High School Redesign includes several initiatives… The Profile of a Virginia Graduate 6
Stronger Connections to Work • Increase Career Exposure, Exploration, and Planning Ø Elementary Grades • Identification of personal interests and abilities • Provision of information about career cluster areas Ø Middle Grades • Career Investigation Course or equivalent for students in middle school to aid academic and • Career planning in accordance with the Profile of a Virginia Graduate • Course information and planning for education/training after high school Ø High School Grades • Emphasis on workplace skills for ALL students • Opportunities for internships and work-based learning • Increase Opportunities for Internships and Work-based Learning Experiences Ø Scheduling alternatives that offer opportunities for internships, externships, work-based experiences, and credentialing Ø Adding work-based learning experiences and earned credentials into measures of college and career readiness 8
Less Testing: Reduced Verified Credit Requirements Ø Standard Diploma: reduced from 6 to 4 verified credits Ø Advanced Diploma: reduced from 9 to 4 verified credits One Verified Credit Each in: Mathematics SOL Test Science SOL Test English SOL Test Social Studies Authentic Performance *Hewlett Grant funding of $1. 2 Assessment* million in partnership with Jobs for the Future: • • Provides professional development for teachers State developed rubric/template insures continuity Begins transition to verify credits in different ways, not just through an SOL Test. 9
Accreditation and Accountability Reform ESSA State Plan 10
Unintended Outcomes of Current Accountability System • List of “failing” schools paralleled poverty % • Sanctions “demoralized” community & staff • Test Prep dominated school day & year • Teachers reverted to “drill & kill” methodology – not best practice approaches • High quality staff refused to work in “failing” schools • Non-tested subjects pushed out of school day • Parent/community backlash – “anti-testing” 11
State Board Reform Philosophy of Accountability Four Main Principles: 1. Provide comprehensive picture of school quality 2. Drive continuous improvement for all schools 3. Build on strengths and address gaps and unintended outcomes in current system 4. Inform areas of VDOE technical assistance and use of school improvement resources Although not a Core Principle, the State Board also sought tighter alignment of the state/federal accountability systems (Accreditation and ESSA) 12
Potential Areas of Accountability for Schools • Public reporting function • Features important indicators of school quality School Quality Profiles Accreditation (State) Accountability (Reporting to Public & Driving Continuous Improvement) Every Student Succeeds Act • Educational effectiveness function • Measures reflect highest priorities • Directs levels of support/intervention (school improvement) (Federal) Standards of Quality • Essential elements of schools function • Ensures necessary resources are in place 13
Matrix Accreditation Approach Level 1 (At Standard) Level 2 (Near Standard) Level 3 (Below Standard) DRAFT Criteria Number of schools DRAFT/PROPOSED 14
Criteria for Selecting Quality Accreditation Metrics ü Research indicates metric is related to academic performance ü Standardized data collection procedures exist across schools and divisions ü Data for metric are reliable and valid ü Metric is modifiable through school-level policies and practices ü Metric meaningfully differentiates among schools based on progress of all students and student subgroups ü Metric does not unfairly impact one type/group of schools or students ü School-level metric is moderately to strongly correlated with school-level pass rates on state assessments
Proposed Accreditation Indicators Indicator Combined Rate for English Reading and Writing* Combined Rate for Math* Pass Rate for Science* Performance Levels Level 1 Level 2 75% or higher (state benchmark) Between 66% and 74% Level 3 65% or lower 70% or higher (state benchmark) Between 66% and 69% Achievement Gaps: English Reading and Writing* 75% or higher (state benchmark) Less than 10 points below state benchmark 10 or more points below state benchmark Achievement Gaps: Math* 70% or higher (state benchmark) Less than 5 points below state benchmark 5 or more points below state benchmark *Schools can improve the performance level on the indicator by decreasing the assessment failure rate by 10% or more 16
Proposed Accreditation Indicators Indicator Performance Levels Level 1 Level 2 Level 3 Graduation Completion Index† 88 or higher Between 81 and 87 80 or lower Dropout Rate‡ 6% or lower Between 7% and 8% 9% or higher Chronic Absenteeism‡ 15% or lower Between 16% and 24% 25% or higher College and Career Readiness Index 85% or higher Between 71% and 84% 70% or lower †Schools ‡Schools can improve the performance level on the indicator by increasing the index value by 10% or more can improve the performance level on the indicator by decreasing the rate by 10% or more 17
Role of ESSA Under ESSA, State Accountability Systems must address: Ø Ø Academic achievement; Academic progress; Graduation rates; Progress in English Learners gaining proficiency; and Ø One or more other indicators of school quality. 18
Proposed Accreditation Indicators Category Indicator Achievement English Academic Indicator (includes passing state assessments, student growth and English Learner progress) Required by ESSA? Math Academic Indicator (includes passing state assessments and student growth) Science Academic Indicator (includes passing state assessments) English Academic Achievement Gap (examines all reporting groups) Math Academic Achievement Gap (examines all reporting groups) 19
Proposed Accreditation Indicators Category Indicator Graduation/ School Progress Graduation and Completion Index Student Engagement Chronic Absenteeism (elementary and middle schools) College and Career Readiness Index (includes advanced coursework, CTE credentials, and workbased learning) Required by ESSA? Dropout Rate (high schools) 20
Application of Indicator Performance to Actions and responses to be taken by school divisions and schools, according to performance level on a school quality indicator 21
Application of Indicator Performance to Actions Accredited • When each school quality indicator is in the Level One (Green) range or Level Two (Yellow) range. Accredited with Conditions • When a school has any school quality indicator in the Level III (Red) range. Accreditation Denied • When a school or school division fails to implement school division or school corrective action plans according to planned timelines, or has taken no action on identified strategies and interventions, the school is reviewed for potential designation by the board as “Accreditation Denied. ” • The Board shall deny accreditation for any school that continues to demonstrate Level Three (Red) performance levels in any school quality indicator due to a failure to implement actions prescribed in a corrective action plan. 22
Fictional Examples These schools display visual outcomes using the new system 23
West Elementary School Combined Rate: English Reading and Writing LEVEL 1 Combined Rate: Math LEVEL 1 Pass Rate: Science LEVEL 1 Achievement Gaps: English Reading and Writing LEVEL 2 Achievement Gaps: Math LEVEL 1 Student Participation/ Engagement Chronic Absenteeism LEVEL 2 OVERALL ACCREDITED Achievement 24
South Middle School Combined Rate: English Reading and Writing LEVEL 2 Combined Rate: Math LEVEL 1 Pass Rate: Science LEVEL 1 Achievement Gaps: English Reading and Writing LEVEL 2 Achievement Gaps: Math LEVEL 2 Student Participation/ Engagement Chronic Absenteeism LEVEL 1 OVERALL ACCREDITED Achievement 25
North High School Combined Rate: English Reading and Writing LEVEL 1 Combined Rate: Math LEVEL 1 Pass Rate: Science LEVEL 1 Achievement Gaps: English Reading and Writing LEVEL 2 Achievement Gaps: Math LEVEL 1 Graduation Completion Index LEVEL 1 Dropout Rate LEVEL 2 College and Career Readiness Index LEVEL 3 OVERALL ACCREDITED WITH CONDITIONS Achievement Graduation/ School Progress 26
Accreditation Designation for Virginia’s Public Schools (if criteria applied to current data) Accredited with Conditions 400 23% Accredited 1361 77% Based on data from 2013 -14, 2014 -15, and 2015 -16 27
Accreditation Designation by Division Legend All schools accredited 80%-99% of schools accredited 60%-79% of schools accredited 40%-59% of schools accredited 20%-39% of schools accredited 0%-19% of schools accredited 28
Standards of Accreditation Implementation Timeline Dec 2017 Legislative Deadline for approval of the “Profile”. Summer 2017 60 Day Public Comment Period Begins FINAL Regulations submitted to Governor for signature. BOE Conducts Public Hearings Jan 2018 VDOE runs accreditation outcomes for the 20172018 school year (based on 2017 testing data). *Informational Only Fall 2018 New Graduation Requirements EFFECTIVE for the freshman class of 2018 -2019 (Graduating Class of 2022). Transition year for New Accreditation Matrix. June 2017 Fall 2017 BOE Adopts PROPOSED Regulations BOE FINAL APPROVAL of REGULATION S APA Process Begins. For this year only, a school may achieve full accreditation by meeting the criteria and rules of either the 2017 -2018 year or those effective 2018 -2019, whichever benefits it the most. Jan 2019 ALL schools will be accredited on the reformed accountability system. 29
Q&A Thank you for the opportunity! 30