Using multilevel modelling to measure the performance of

- Slides: 19
Using multilevel modelling to measure the performance of correctional centres Jen Galouzis Mark Howard
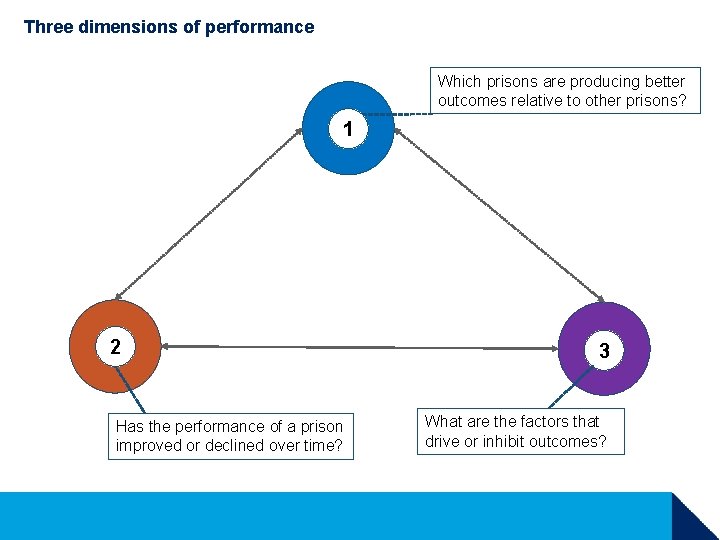
Three dimensions of performance Which prisons are producing better outcomes relative to other prisons? 1 2 Has the performance of a prison improved or declined over time? 3 What are the factors that drive or inhibit outcomes?
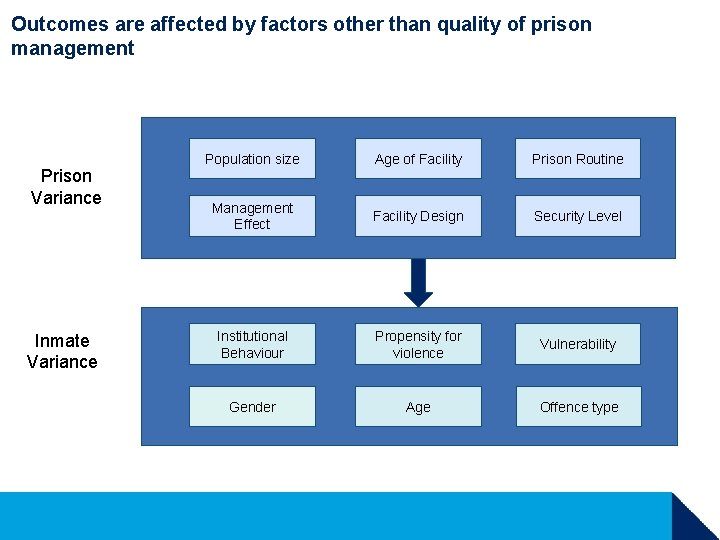
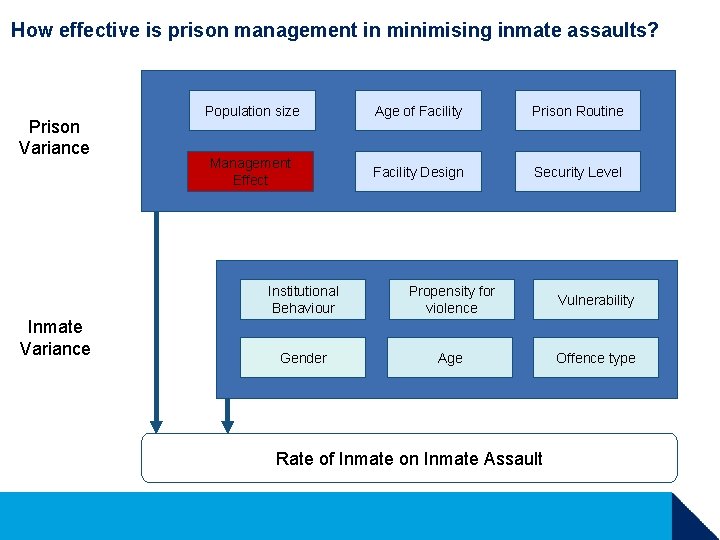
Outcomes are affected by factors other than quality of prison management Prison Variance Inmate Variance Population size Age of Facility Prison Routine Management Effect Facility Design Security Level Institutional Behaviour Propensity for violence Vulnerability Gender Age Offence type
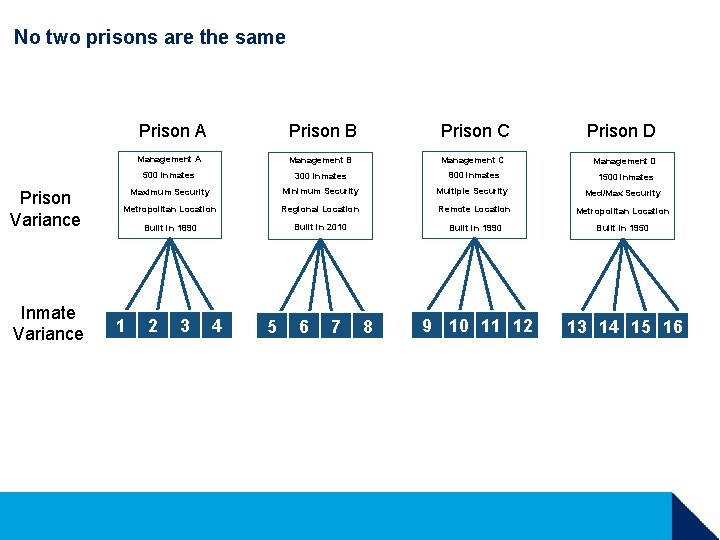
No two prisons are the same Prison Variance Inmate Variance Prison A Prison B Prison C Management A Management B Management C Management D 500 inmates 300 inmates 800 inmates 1500 inmates Maximum Security Minimum Security Multiple Security Med/Max Security Metropolitan Location Regional Location Remote Location Metropolitan Location Built in 1890 Built in 2010 Built in 1990 Built in 1950 9 10 11 12 13 14 15 16 1 2 3 4 5 6 7 8 Prison D
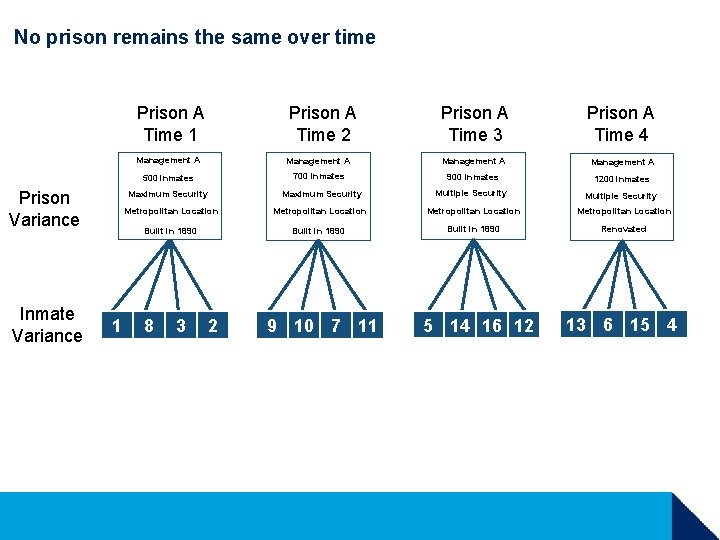
No prison remains the same over time Prison A Time 1 Prison Variance Inmate Variance Prison A Time 2 Prison A Time 4 Management A 500 inmates 700 inmates 900 inmates 1200 inmates Maximum Security Multiple Security Metropolitan Location Built in 1890 Renovated Maximum Security 1 Prison A Time 3 8 3 2 9 10 7 11 5 14 16 12 13 6 15 4
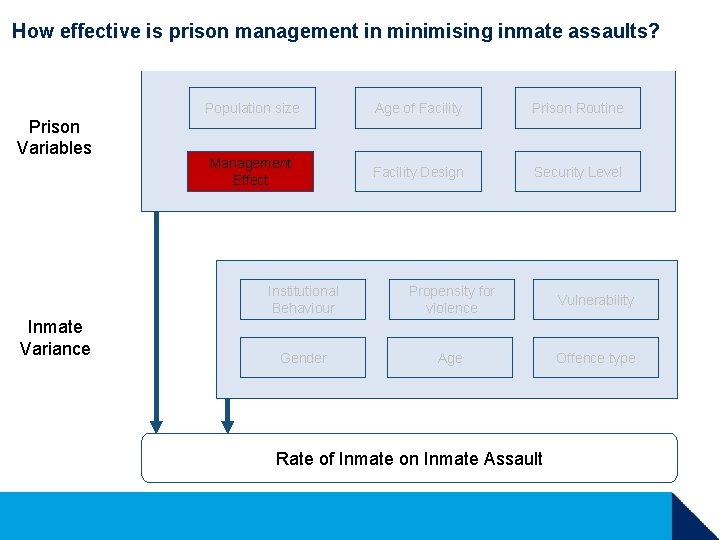
How effective is prison management in minimising inmate assaults? Outcomes are affected by factors other than quality of prison management Prison Variance Inmate Variance Population size Age of Facility Prison Routine Management Effect Facility Design Security Level Institutional Behaviour Propensity for violence Vulnerability Gender Age Offence type Rate of Inmate on Inmate Assault
How effective are is prison management in minimising inmate assaults? Outcomes affected by factors other than quality of prison management Prison Variables Inmate Variance Population size Age of Facility Prison Routine Management Effect Facility Design Security Level Institutional Behaviour Propensity for violence Vulnerability Gender Age Offence type Rate of Inmate on Inmate Assault
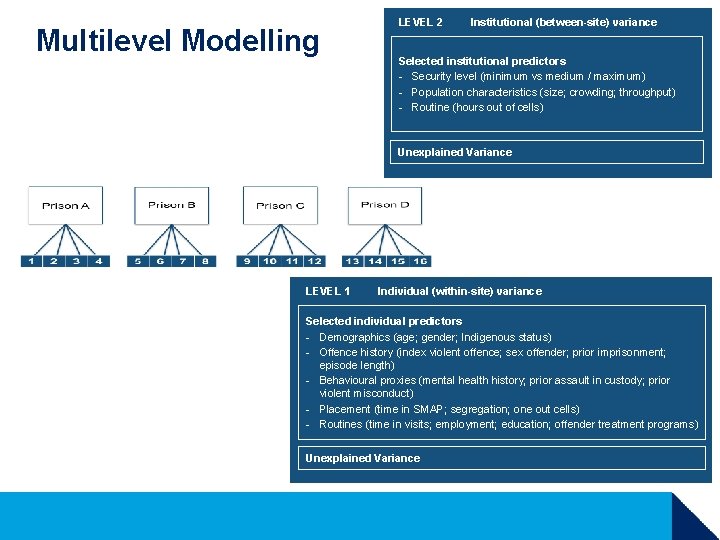
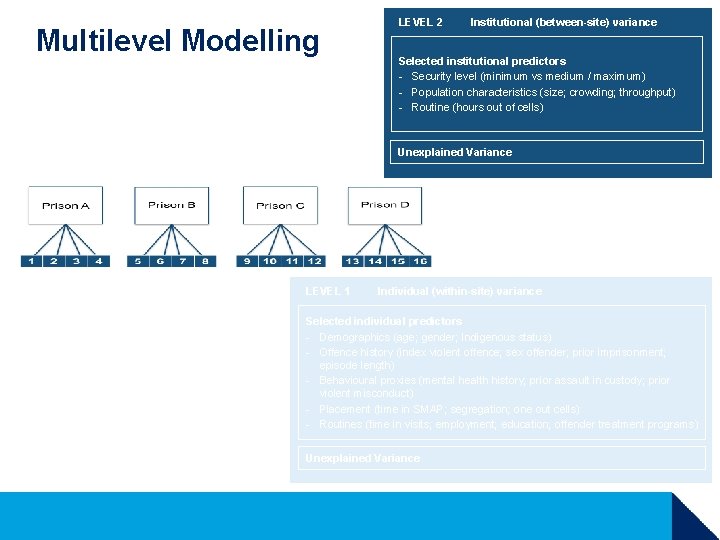
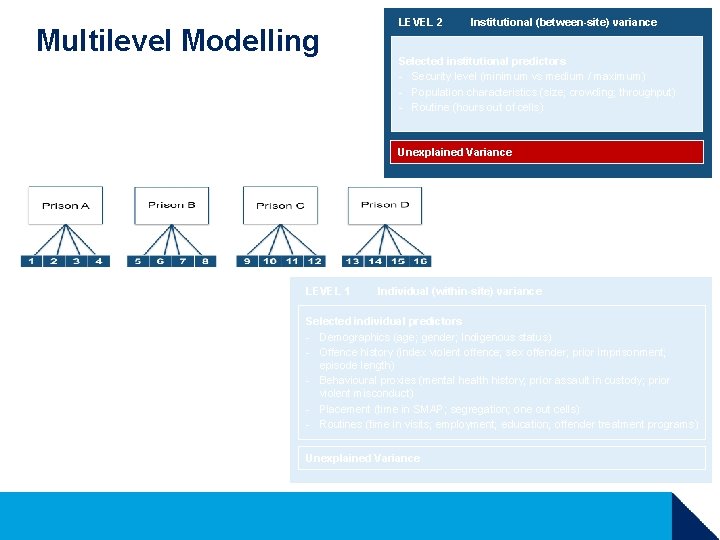
Multilevel Modelling LEVEL 2 Institutional (between-site) variance Selected institutional predictors - Security level (minimum vs medium / maximum) - Population characteristics (size; crowding; throughput) - Routine (hours out of cells) Unexplained Variance Assault risk LEVEL 1 Individual (within-site) variance Selected individual predictors - Demographics (age; gender; Indigenous status) - Offence history (index violent offence; sex offender; prior imprisonment; episode length) - Behavioural proxies (mental health history; prior assault in custody; prior violent misconduct) - Placement (time in SMAP; segregation; one out cells) - Routines (time in visits; employment; education; offender treatment programs) Unexplained Variance
Multilevel Modelling LEVEL 2 Institutional (between-site) variance Selected institutional predictors - Security level (minimum vs medium / maximum) - Population characteristics (size; crowding; throughput) - Routine (hours out of cells) Unexplained Variance Assault risk LEVEL 1 Individual (within-site) variance Selected individual predictors - Demographics (age; gender; Indigenous status) - Offence history (index violent offence; sex offender; prior imprisonment; episode length) - Behavioural proxies (mental health history; prior assault in custody; prior violent misconduct) - Placement (time in SMAP; segregation; one out cells) - Routines (time in visits; employment; education; offender treatment programs) Unexplained Variance
Multilevel Modelling LEVEL 2 Institutional (between-site) variance Selected institutional predictors - Security level (minimum vs medium / maximum) - Population characteristics (size; crowding; throughput) - Routine (hours out of cells) Unexplained Variance Assault risk LEVEL 1 Individual (within-site) variance Selected individual predictors - Demographics (age; gender; Indigenous status) - Offence history (index violent offence; sex offender; prior imprisonment; episode length) - Behavioural proxies (mental health history; prior assault in custody; prior violent misconduct) - Placement (time in SMAP; segregation; one out cells) - Routines (time in visits; employment; education; offender treatment programs) Unexplained Variance
Methods Assaults in 2013 -2014 financial year Total inmate population = 10, 484 inmates Correctional centres demarcated by security level = 43 sites DV: Incidence of assaults over exposure period Negative binomial regression model
Results Step 1: Unconditional Model Significant variance in inmate incidence of assault occurred at the between-site level (χ (42) = 456. 57; p <. 001) 2 59. 4% of variance in incidence of assault associated with differences across individuals 40. 6% of variance in incidence of assault associated with differences across sites
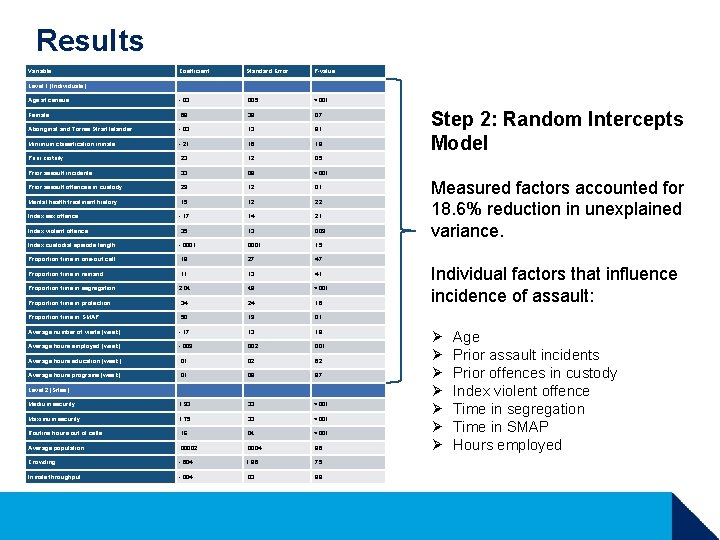
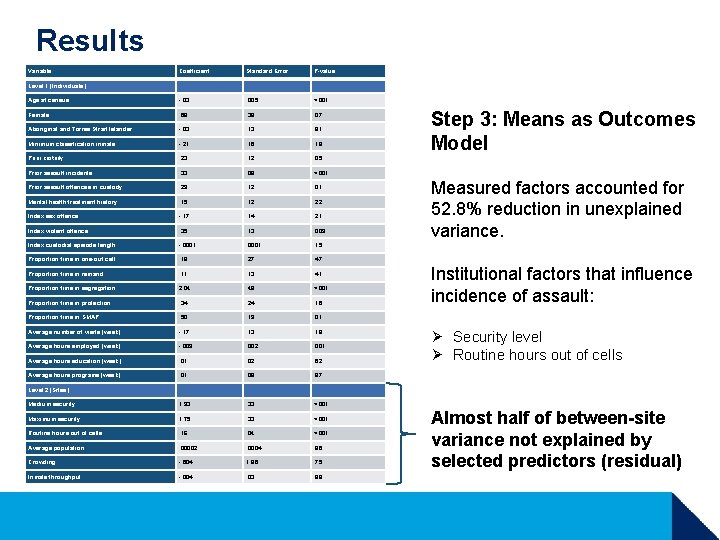
Results Variable Coefficient Standard Error P-value Level 1 (Individuals) Age at census -. 03 . 005 <. 001 Female . 69 . 38 . 07 Aboriginal and Torres Strait Islander -. 03 . 13 . 81 Minimum classification inmate -. 21 . 16 . 18 Prior custody . 23 . 12 . 05 Prior assault incidents . 33 . 08 <. 001 Prior assault offences in custody . 29 . 12 . 01 Mental health treatment history . 15 . 12 . 22 Index sex offence -. 17 . 14 . 21 Index violent offence . 35 . 13 . 009 Index custodial episode length -. 0001 . 15 Proportion time in one-out cell . 19 . 27 . 47 Proportion time in remand . 11 . 13 . 41 Proportion time in segregation 2. 04 . 48 <. 001 Proportion time in protection . 34 . 24 . 16 Proportion time in SMAP . 50 . 19 . 01 Average number of visits (week) -. 17 . 13 . 18 Average hours employed (week) -. 009 . 002 . 001 Average hours education (week) . 01 . 02 . 62 Average hours programs (week) . 01 . 08 . 87 Level 2 (Sites) Medium security 1. 93 . 33 <. 001 Maximum security 1. 75 . 33 <. 001 Routine hours out of cells . 16 . 04 <. 001 Average population . 00002 . 0004 . 96 Crowding -. 604 1. 86 . 75 Inmate throughput -. 004 . 03 . 88 Step 2: Random Intercepts Model Measured factors accounted for 18. 6% reduction in unexplained variance. Individual factors that influence incidence of assault: Ø Ø Ø Ø Age Prior assault incidents Prior offences in custody Index violent offence Time in segregation Time in SMAP Hours employed
Results Variable Coefficient Standard Error P-value Level 1 (Individuals) Age at census -. 03 . 005 <. 001 Female . 69 . 38 . 07 Aboriginal and Torres Strait Islander -. 03 . 13 . 81 Minimum classification inmate -. 21 . 16 . 18 Prior custody . 23 . 12 . 05 Prior assault incidents . 33 . 08 <. 001 Prior assault offences in custody . 29 . 12 . 01 Mental health treatment history . 15 . 12 . 22 Index sex offence -. 17 . 14 . 21 Index violent offence . 35 . 13 . 009 Index custodial episode length -. 0001 . 15 Proportion time in one-out cell . 19 . 27 . 47 Proportion time in remand . 11 . 13 . 41 Proportion time in segregation 2. 04 . 48 <. 001 Proportion time in protection . 34 . 24 . 16 Proportion time in SMAP . 50 . 19 . 01 Average number of visits (week) -. 17 . 13 . 18 Average hours employed (week) -. 009 . 002 . 001 Average hours education (week) . 01 . 02 . 62 Average hours programs (week) . 01 . 08 . 87 Level 2 (Sites) Medium security 1. 93 . 33 <. 001 Maximum security 1. 75 . 33 <. 001 Routine hours out of cells . 16 . 04 <. 001 Average population . 00002 . 0004 . 96 Crowding -. 604 1. 86 . 75 Inmate throughput -. 004 . 03 . 88 Step 3: Means as Outcomes Model Measured factors accounted for 52. 8% reduction in unexplained variance. Institutional factors that influence incidence of assault: Ø Security level Ø Routine hours out of cells Almost half of between-site variance not explained by selected predictors (residual)
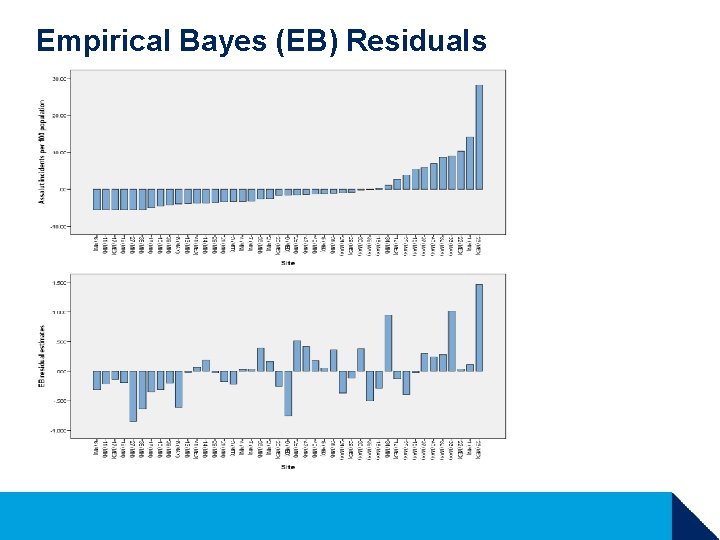
Empirical Bayes (EB) Residuals
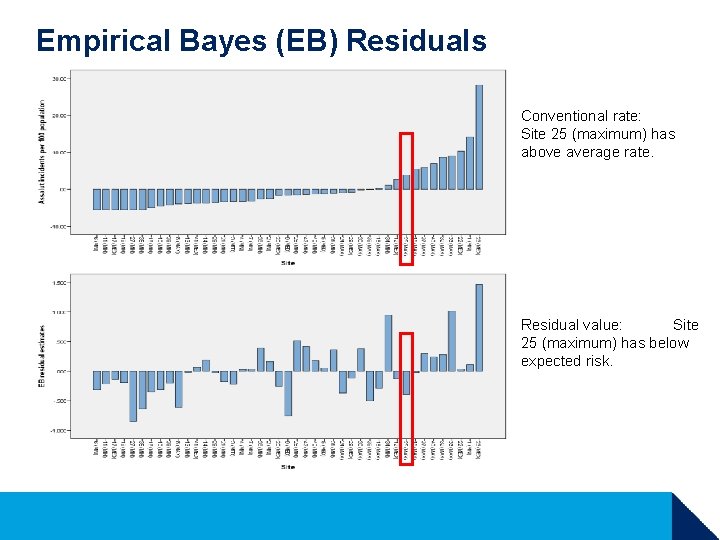
Empirical Bayes (EB) Residuals Conventional rate: Site 25 (maximum) has above average rate. Residual value: Site 25 (maximum) has below expected risk.
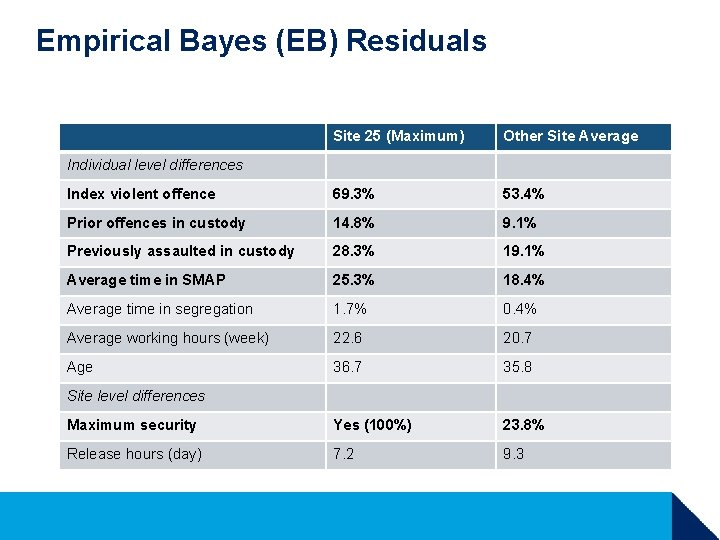
Empirical Bayes (EB) Residuals Site 25 (Maximum) Other Site Average Index violent offence 69. 3% 53. 4% Prior offences in custody 14. 8% 9. 1% Previously assaulted in custody 28. 3% 19. 1% Average time in SMAP 25. 3% 18. 4% Average time in segregation 1. 7% 0. 4% Average working hours (week) 22. 6 20. 7 Age 36. 7 35. 8 Maximum security Yes (100%) 23. 8% Release hours (day) 7. 2 9. 3 Individual level differences Site level differences
Conclusions There are many factors that: Ø Have a significant influence on risk of being assaulted Ø Are unrelated to the performance of prison management Ø Differ across prisons or over time Multilevel modelling adjusts for these factors in order to improve the comparability of performance outcomes across prisons.
Questions? Jen Galouzis jennifer. galouzis@justice. nsw. gov. au Mark Howard mark. howard@justice. nsw. gov. au