Unit 4 Correlation and Linear Regression Wenyaw Chan
- Slides: 12
Unit 4: Correlation and Linear Regression Wenyaw Chan Division of Biostatistics School of Public Health University of Texas - Health Science Center at Houston
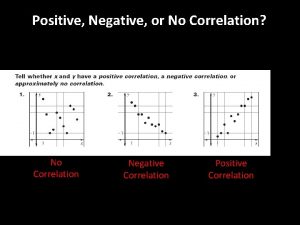
Causation and Association • Causation – Changes in A cause changes in B • Association: We are also usually interested in the relationship between the two variables.
Causation and Association Causation In the Australian state of Victoria, a law compelling motorists to wear seat belts went into effect in December, 1970. As time passed, an increasing percentage of motorists complied. A study found high positive correlation between the percent of motorists wearing seat belts and the percent reduction in injuries from the 1970 level. This is an instance of cause and effect: Seat belts prevent injuries when an accident occurs, so an increase in their use caused a drop in injuries.
Causation and Association A moderate correlation exists between the Scholastic Aptitude Test (SAT) scores of high school students and their grade index later as freshman in college. Surely high SAT scores do not cause high freshman grades. Rather the same combination of ability and knowledge shows itself in both high SAT scores and high grades. Both of the observed variables are responding to the same unobserved variable and this is the reason for the correlation between them.
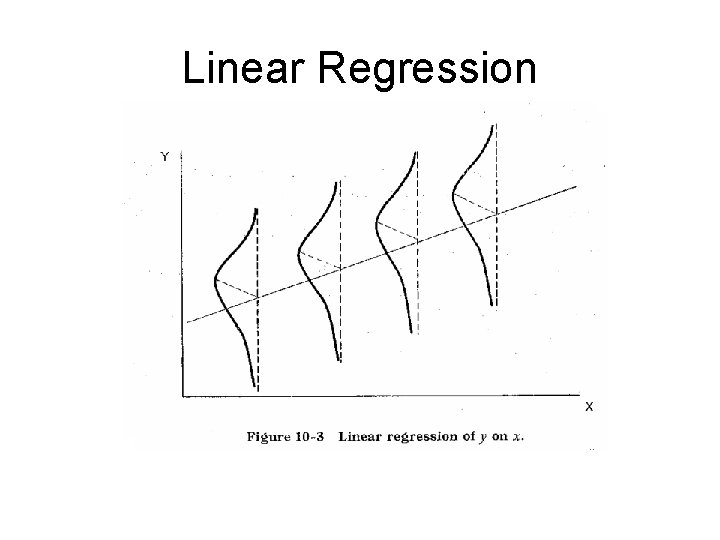
Linear Regression Simple Linear Regression , where are independent random variables is another observable variable is the intercept is the slope is normally distributed with mean=0 and variance=
Linear Regression
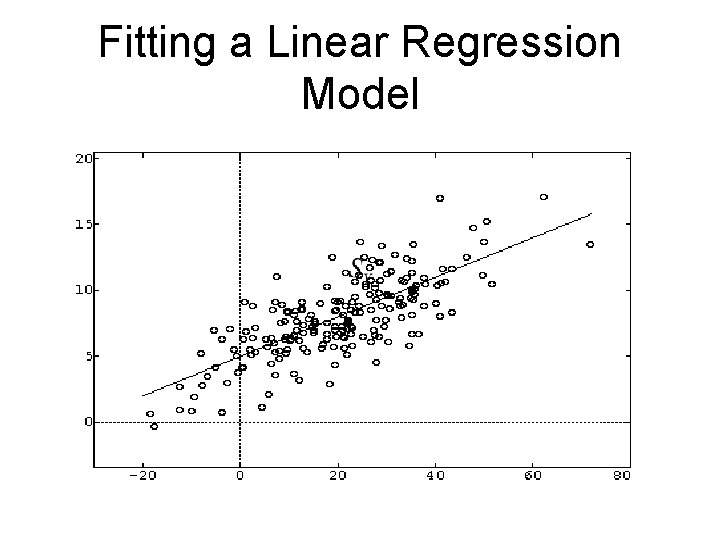
Fitting a Linear Regression Model
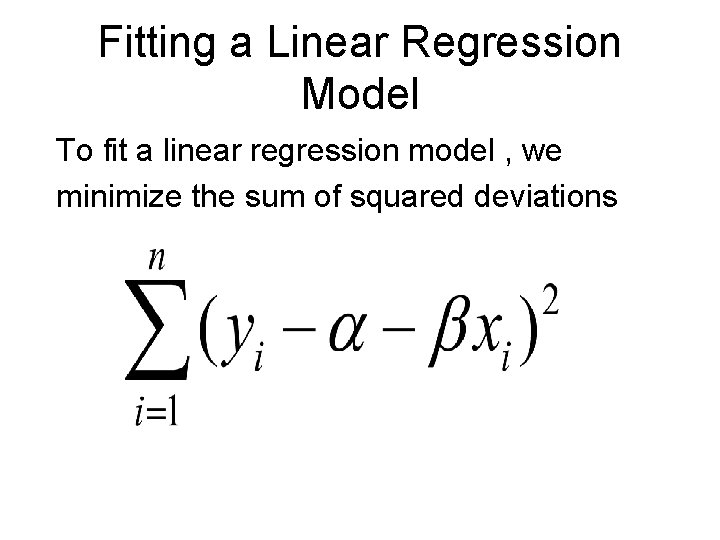
Fitting a Linear Regression Model To fit a linear regression model , we minimize the sum of squared deviations
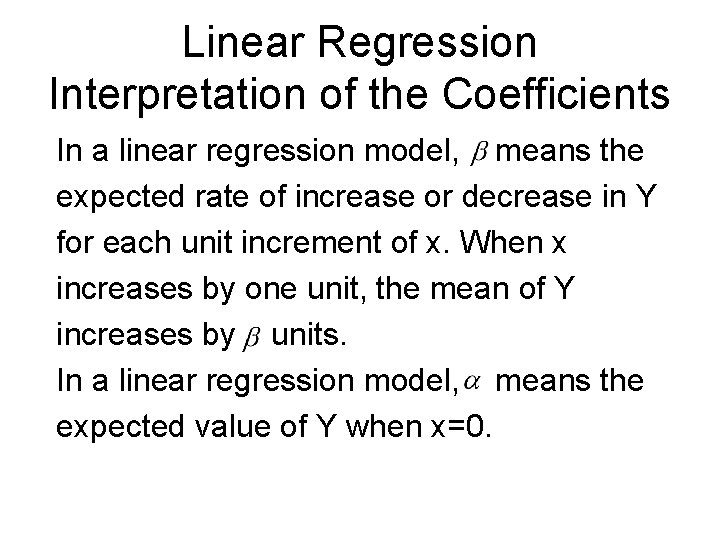
Linear Regression Interpretation of the Coefficients In a linear regression model, means the expected rate of increase or decrease in Y for each unit increment of x. When x increases by one unit, the mean of Y increases by units. In a linear regression model, means the expected value of Y when x=0.
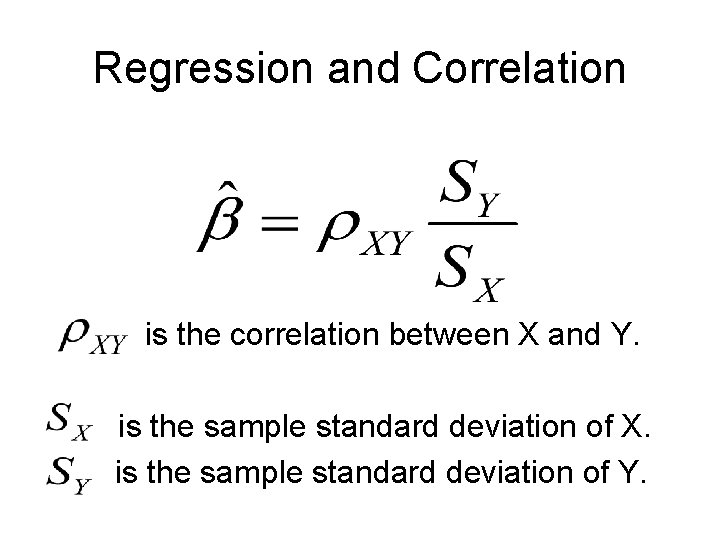
Regression and Correlation is the correlation between X and Y. is the sample standard deviation of X. is the sample standard deviation of Y.
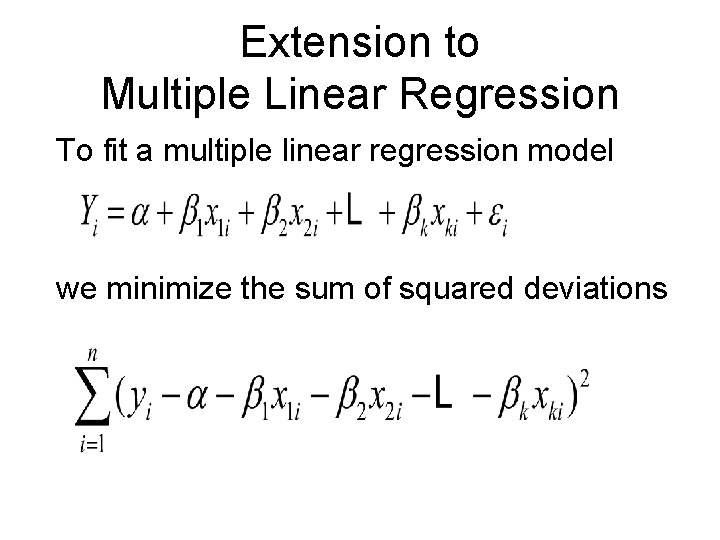
Extension to Multiple Linear Regression To fit a multiple linear regression model we minimize the sum of squared deviations
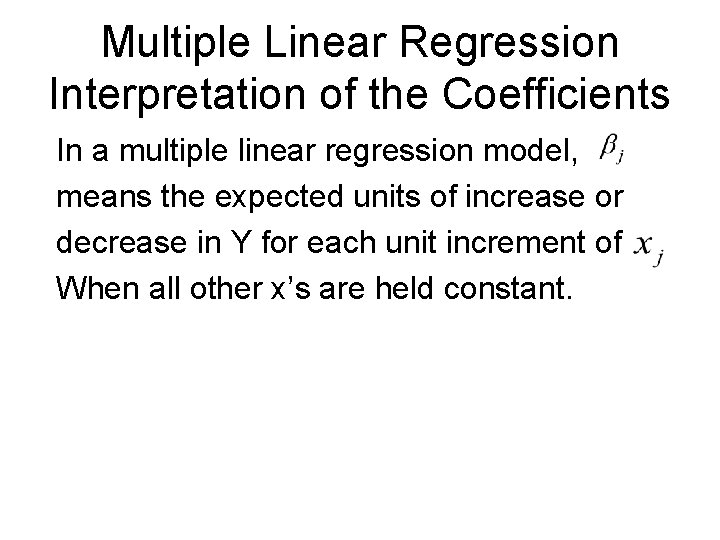
Multiple Linear Regression Interpretation of the Coefficients In a multiple linear regression model, means the expected units of increase or decrease in Y for each unit increment of When all other x’s are held constant.