Ukraine Grain Transportation Delmy Salin Senior Economist Transportation

- Slides: 42
Ukraine Grain Transportation Delmy Salin Senior Economist, Transportation Services Division USDA’s 96 th Agricultural Outlook Forum February 20, 2019 Arlington, VA
Outline • Why is USDA working on the Black Sea region? Why do U. S. producers have interest in this region? • Why Ukraine? Black Sea region competitiveness. • U. S. and Black Sea region selected ocean-route distances in nautical miles (nm). U. S. and Ukraine grain and oilseeds exports by mode. • Ukraine transportation: rail, truck, and barge. Ukraine Grain Transportation Report. • Ukraine and U. S. corn and wheat transportation cost. Report frequency.
Why is USDA working on the Black Sea region? • In response to the grain producers’ request to the Office of the Secretary (OSEC) during the BNSF Ag Rail Business Council (ARB) meeting, September 2018. • The ARB is a group that BNSF started 13 years ago as a forum for dialogue between producers, co-ops, and other AG groups to discuss issues of importance in the BNSF service territory. The ARB group consists of about 25 individuals and meets twice a year.
Why is USDA working on the Black Sea regions? • At the September 2018 meeting, producers asked USDA to prepare a Black Sea Grain report like the Brazilian Soybean Transportation Report that AMS/USDA prepares for the benefit of U. S. soybean exporters. • To assess U. S. grain transportation cost competitiveness, especially for wheat and corn.
Why do U. S. producers have interest in this region? • The Black Sea Region–Kazakhstan, Russia, and Ukraine –is a strong player in grain world market. • The U. S. share of the global wheat market has been declining over the past two decades as the European Union (EU) and Russia have risen in prominence. • Russia is the top world wheat exporter, followed by the EU, United States, Canada, Ukraine, Australia, and Argentina.
Why do U. S. producers have interest in this region? • In the corn market, the United States is still the leading exporter, but faces strong competition from Brazil, Argentina, and Ukraine. • The U. S. corn prices are still competitive but Black Sea prices are declining and production is increasing. • The USDA forecasts that Ukraine is expected to be a major corn exporter of 31. 2 million metric tons (mmt) in 2029.
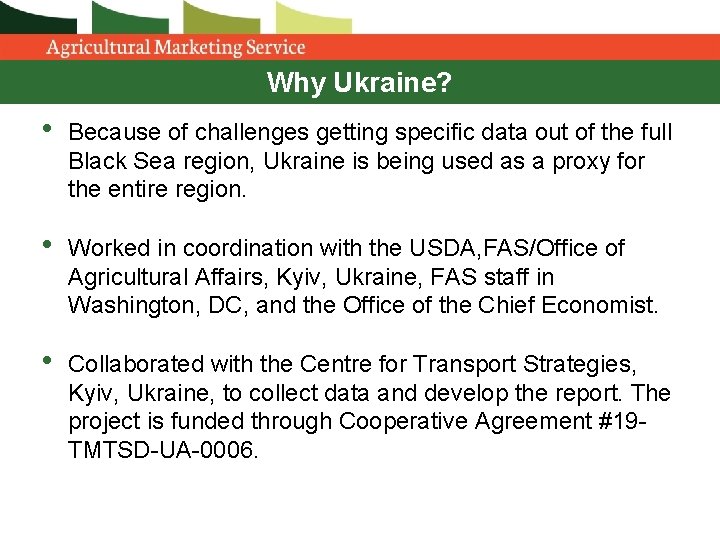
Why Ukraine? • Because of challenges getting specific data out of the full Black Sea region, Ukraine is being used as a proxy for the entire region. • Worked in coordination with the USDA, FAS/Office of Agricultural Affairs, Kyiv, Ukraine, FAS staff in Washington, DC, and the Office of the Chief Economist. • Collaborated with the Centre for Transport Strategies, Kyiv, Ukraine, to collect data and develop the report. The project is funded through Cooperative Agreement #19 TMTSD-UA-0006.
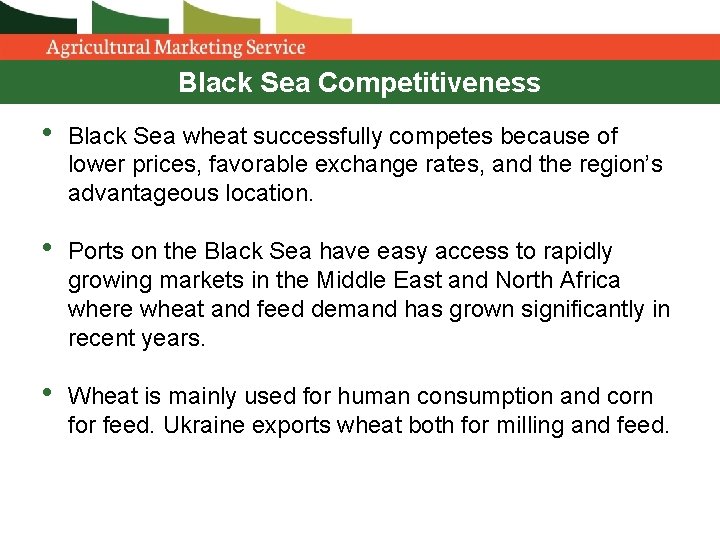
Black Sea Competitiveness • Black Sea wheat successfully competes because of lower prices, favorable exchange rates, and the region’s advantageous location. • Ports on the Black Sea have easy access to rapidly growing markets in the Middle East and North Africa where wheat and feed demand has grown significantly in recent years. • Wheat is mainly used for human consumption and corn for feed. Ukraine exports wheat both for milling and feed.
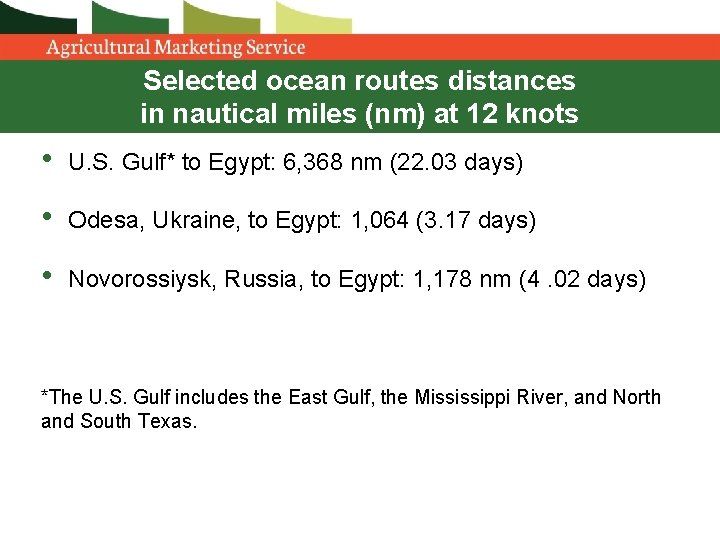
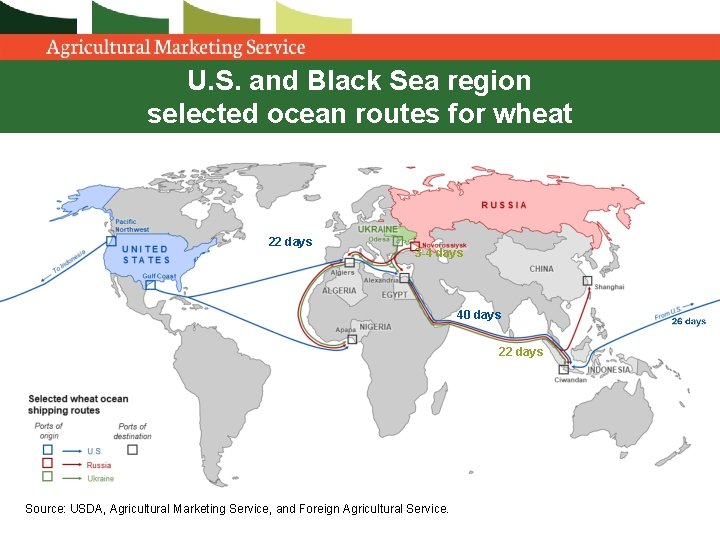
Selected ocean routes distances in nautical miles (nm) at 12 knots • U. S. Gulf* to Egypt: 6, 368 nm (22. 03 days) • Odesa, Ukraine, to Egypt: 1, 064 (3. 17 days) • Novorossiysk, Russia, to Egypt: 1, 178 nm (4. 02 days) *The U. S. Gulf includes the East Gulf, the Mississippi River, and North and South Texas.
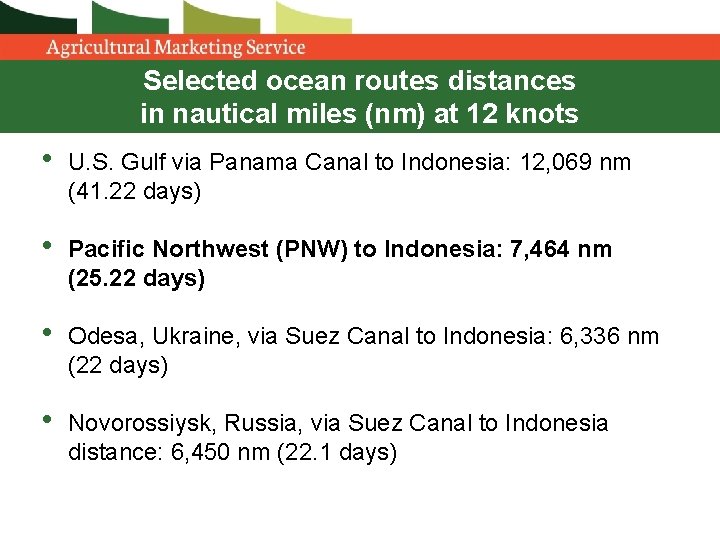
Selected ocean routes distances in nautical miles (nm) at 12 knots • U. S. Gulf via Panama Canal to Indonesia: 12, 069 nm (41. 22 days) • Pacific Northwest (PNW) to Indonesia: 7, 464 nm (25. 22 days) • Odesa, Ukraine, via Suez Canal to Indonesia: 6, 336 nm (22 days) • Novorossiysk, Russia, via Suez Canal to Indonesia distance: 6, 450 nm (22. 1 days)
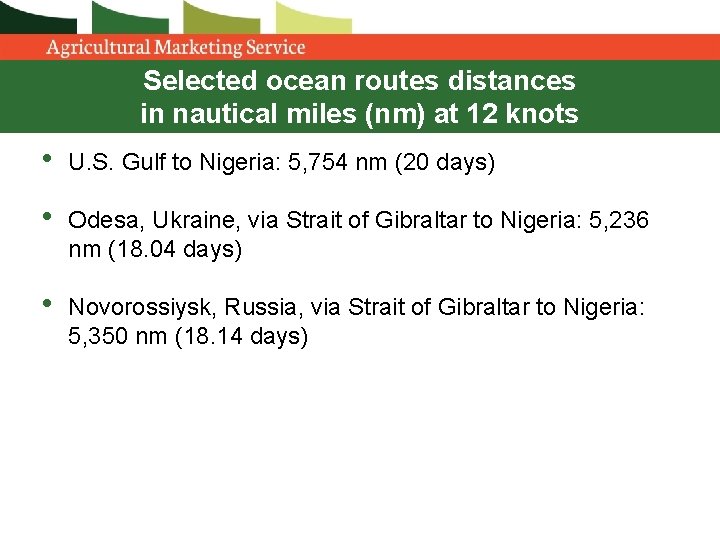
Selected ocean routes distances in nautical miles (nm) at 12 knots • U. S. Gulf to Nigeria: 5, 754 nm (20 days) • Odesa, Ukraine, via Strait of Gibraltar to Nigeria: 5, 236 nm (18. 04 days) • Novorossiysk, Russia, via Strait of Gibraltar to Nigeria: 5, 350 nm (18. 14 days)
U. S. and Black Sea region selected ocean routes for wheat 22 days 3 -4 days 40 days 22 days Source: USDA, Agricultural Marketing Service, and Foreign Agricultural Service.
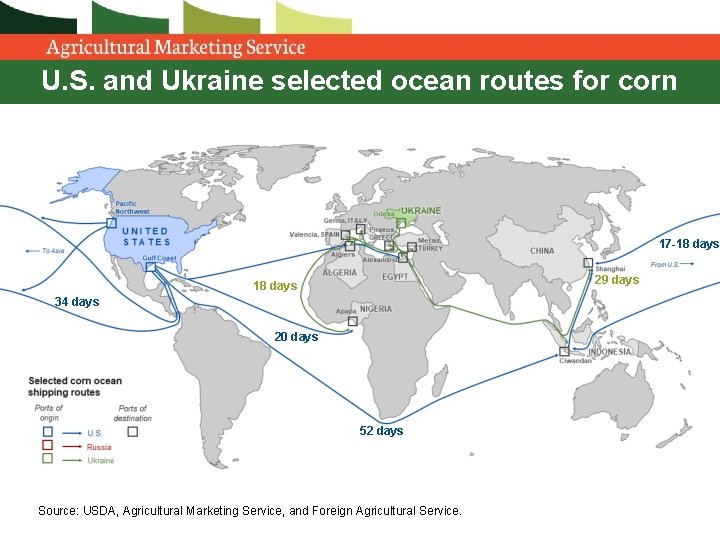
U. S. and Ukraine selected ocean routes for corn 17 -18 days 29 days 18 days 34 days 20 days 52 days Source: USDA, Agricultural Marketing Service, and Foreign Agricultural Service.
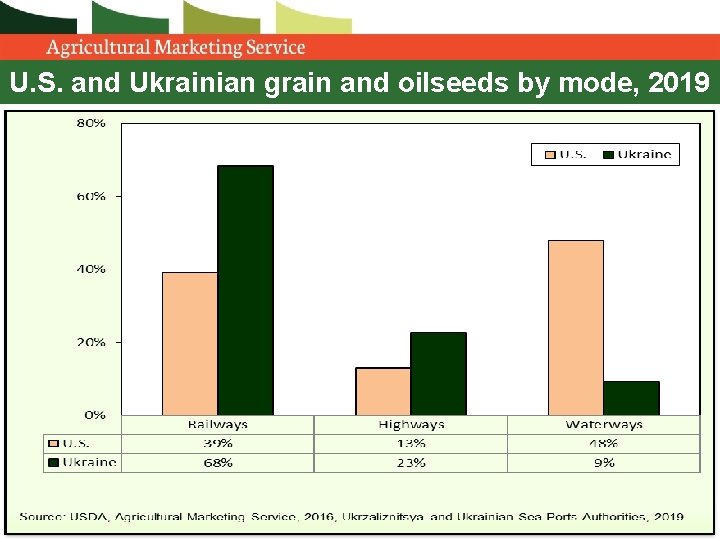
U. S. and Ukrainian grain and oilseeds by mode, 2019
Ukrainian rail transportation • The rail freight market is under Government control. • Ukrzaliznytia (UZ), the state-owned rail company. It owns the rail infrastructure, locomotives, a significant share of railcars, and provides services. • UZ uses the former Soviet Union’s railway-tariff-setting model. Since 2009, the Ministry of Infrastructure updated the rail model without significant changes for the base tariff. • Tariff rates are not published. Tariff rates include the payment of the railway and railcars.
Ukrainian rail transportation • There are two types of railcars in terms of ownership: state and private. • Using privately owned railcars can surpass the cost of using state-owned railcars by up to $4. 00/mt per 350 miles. • When shippers call UZ to get a quote, they have the options of using private railcars and/or railcars in the UZ grain hopper fleet. • More than 95 percent of Ukrainian grain exports are via the Black Sea ports.
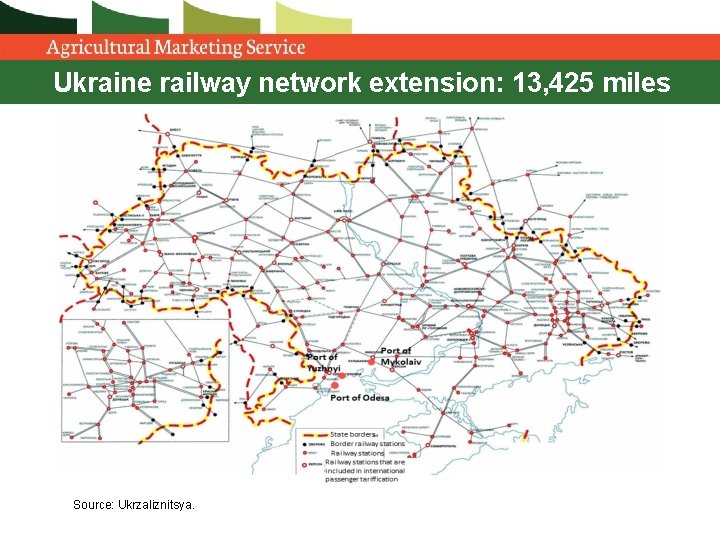
Ukraine railway network extension: 13, 425 miles Source: Ukrzaliznitsya.
Train size • The average train size = 54 -55 railcars. • Approximate load per railcar = 65 -70 mt. • About 95 -99 percent of gauge (distance between two rail tracks) size is 59. 8 inches (1, 520 mm). The remainder of tracks have a standard gauge size of 56. 5 inches. • For example, a train grain shipment of 55 grain hoppers with 65 mt/car is 3, 575 mt.
Major railway transportation challenges • Create a transparent and clear tariff-setting mechanism. • Update the locomotive railyard to meet the demand for traction (power) to move the freight cars on the mainlines. • Create National Transportation Commission to regulate tariffs on access to monopolistic services and to the railway network. • Reach operational optimization of services for on-time delivery to the ports, increase turnaround of rolling stock and reduce transportation costs.
Ukrainian truck transportation • Roads in Ukraine vary in quality from freeways to dirt. • All roads are public and toll free. • The average truck weighs 40 metric tons (mt) with a maximum cargo of 23 -25 mt. • In Ukraine, trucks typically deliver grain to port over short distances—up to 124 miles (200 km) in the areas that deliver to the nearest sea ports such as Odesa and Mykolaiv. • Freight prices are determined by supply and demand for the transport service.
Major truck transportation challenges • Currently, the main challenge is mitigating damage from trucks with overweight cargo (which is, most commonly, grain). • The degradation to roads caused by overweight cargo requires substantial funding to repair.
Ukrainian barge transportation • As in many other parts of the world, barge is considered to be the most economical means of moving bulk commodities in Ukraine. • However, Ukrainian navigable waterways currently cover only a part of the country, which limits the potential of river transportation. • Approximate load per barge ranges from 1, 000 to 5, 000 mt.
Ukrainian barge transportation • The typical barge deadweight is 3, 000 mt (limited by locks’ dimensions and Dnipro depth). • A convoy of a tugboat and two barges is usually used. • Sea-river self-propelled vessels are used on the Dnipro river. • This type of vessel is used to ship cargo in the Black Sea and in some cases in the Mediterranean Sea with a deadweight of 2, 500 -5, 000 mt.
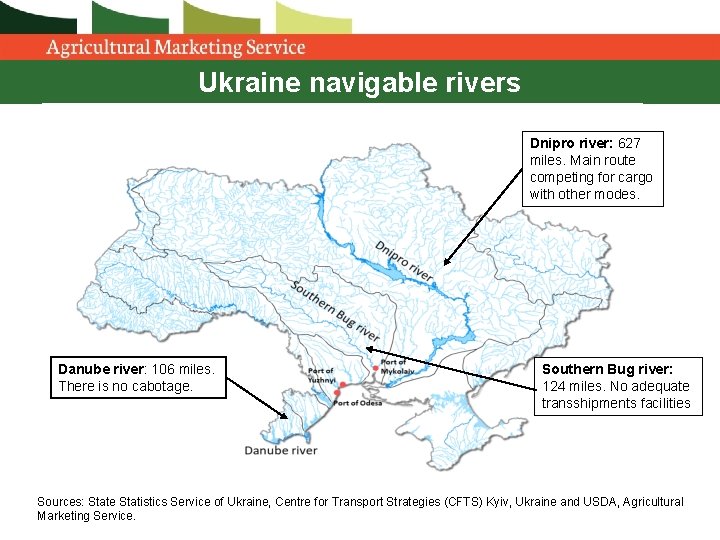
Ukraine navigable rivers Dnipro river: 627 miles. Main route competing for cargo with other modes. Danube river: 106 miles. There is no cabotage. Southern Bug river: 124 miles. No adequate transshipments facilities Sources: State Statistics Service of Ukraine, Centre for Transport Strategies (CFTS) Kyiv, Ukraine and USDA, Agricultural Marketing Service.
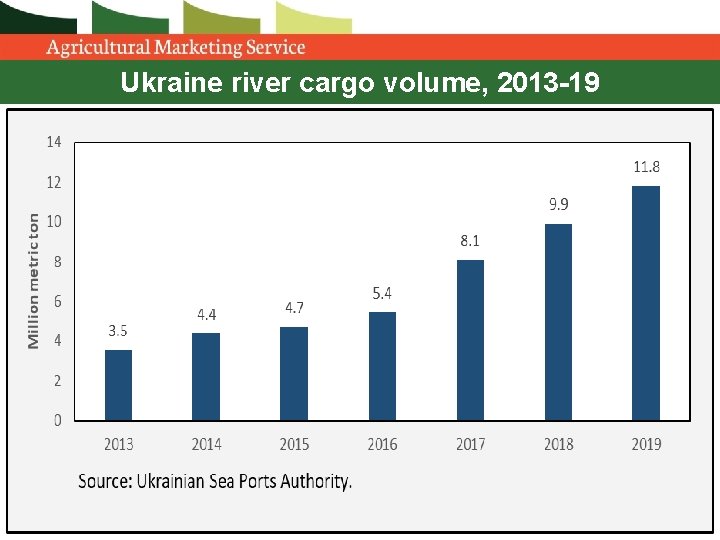
Ukraine river cargo volume, 2013 -19
Major barge transportation challenges • Within the next decade, river cargo volume is expected to surpass the infrastructure capacity, which was built in the middle of the 20 th century and requires substantial funding for repair and maintenance.
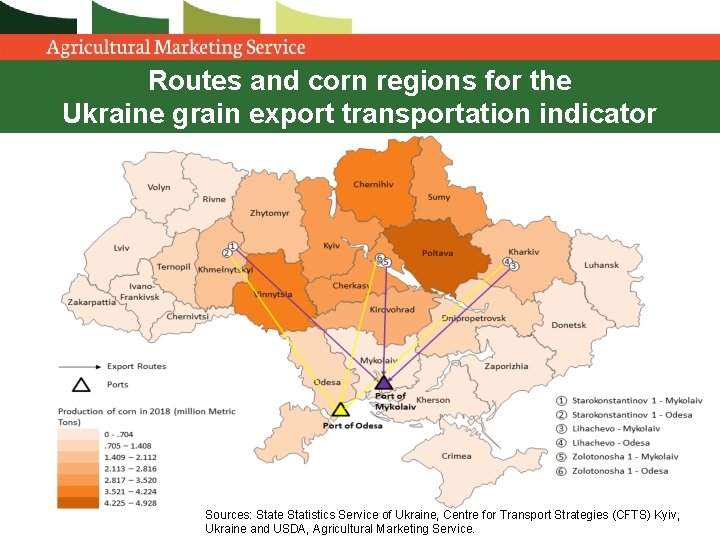
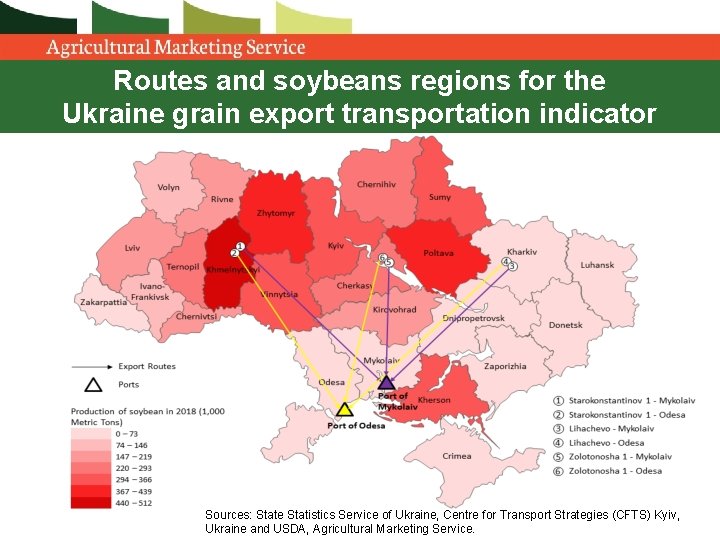
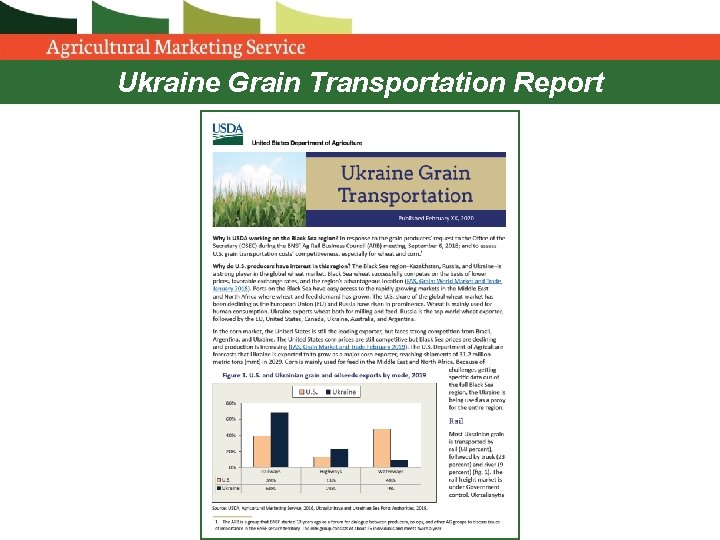
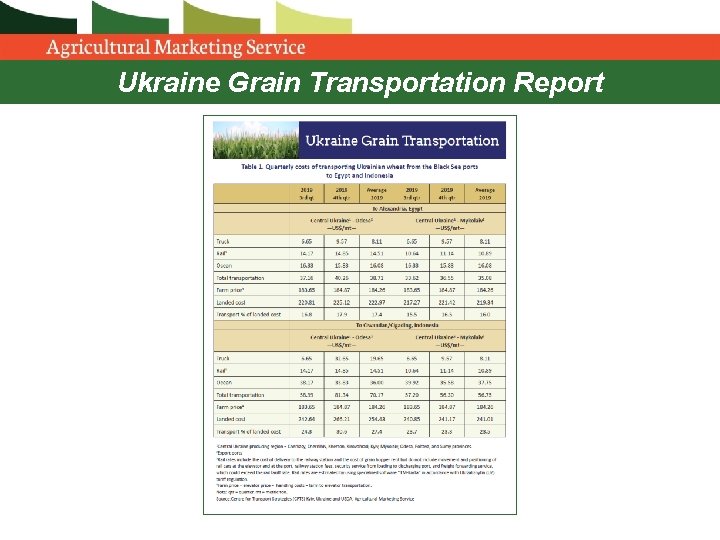
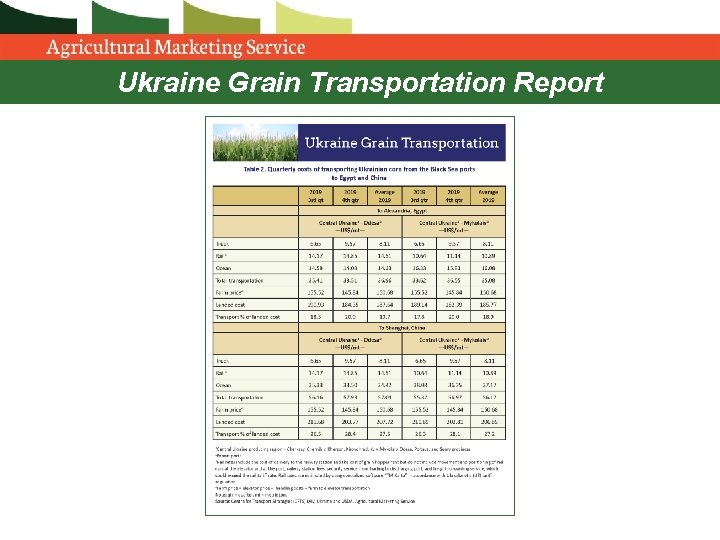
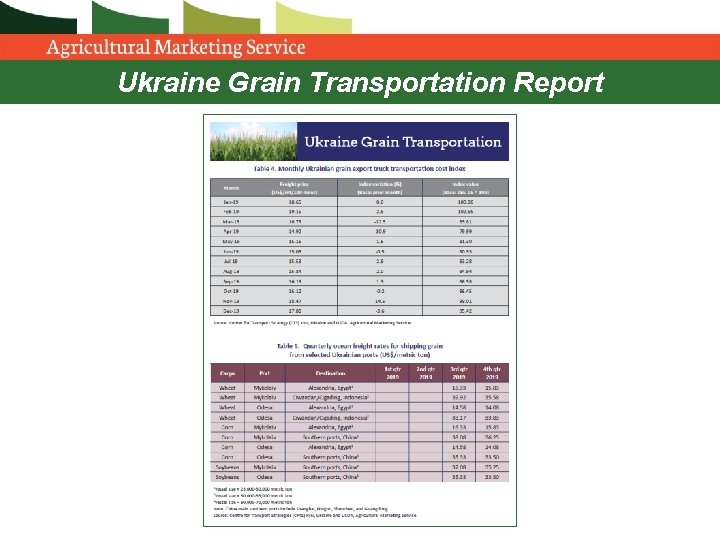
Ukraine Grain Transportation Report • This report is an indicator designed to serve as a reference to better understand the freight market in Ukraine. • It shows the cost of shipping wheat, corn, and soybeans from major production regions in Ukraine to the ports and then to major export markets.
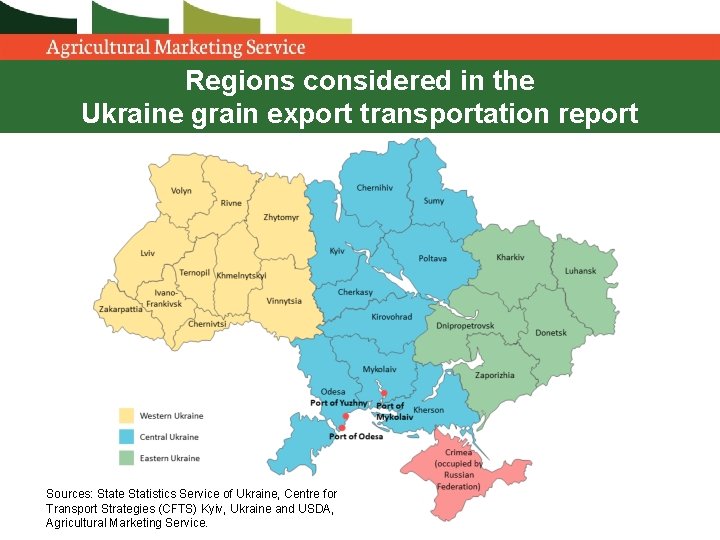
Regions considered in the Ukraine grain export transportation report Sources: State Statistics Service of Ukraine, Centre for Transport Strategies (CFTS) Kyiv, Ukraine and USDA, Agricultural Marketing Service.
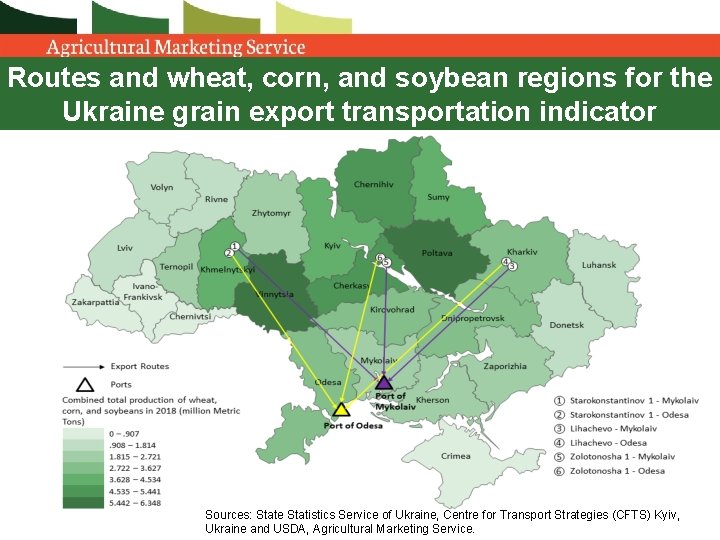
Routes and wheat, corn, and soybean regions for the Ukraine grain export transportation indicator Sources: State Statistics Service of Ukraine, Centre for Transport Strategies (CFTS) Kyiv, Ukraine and USDA, Agricultural Marketing Service.
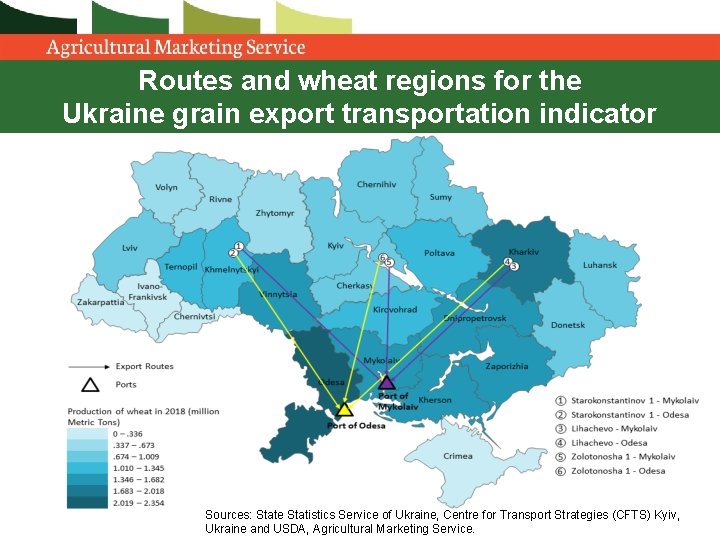
Routes and wheat regions for the Ukraine grain export transportation indicator Sources: State Statistics Service of Ukraine, Centre for Transport Strategies (CFTS) Kyiv, Ukraine and USDA, Agricultural Marketing Service.
Routes and corn regions for the Ukraine grain export transportation indicator Sources: State Statistics Service of Ukraine, Centre for Transport Strategies (CFTS) Kyiv, Ukraine and USDA, Agricultural Marketing Service.
Routes and soybeans regions for the Ukraine grain export transportation indicator Sources: State Statistics Service of Ukraine, Centre for Transport Strategies (CFTS) Kyiv, Ukraine and USDA, Agricultural Marketing Service.
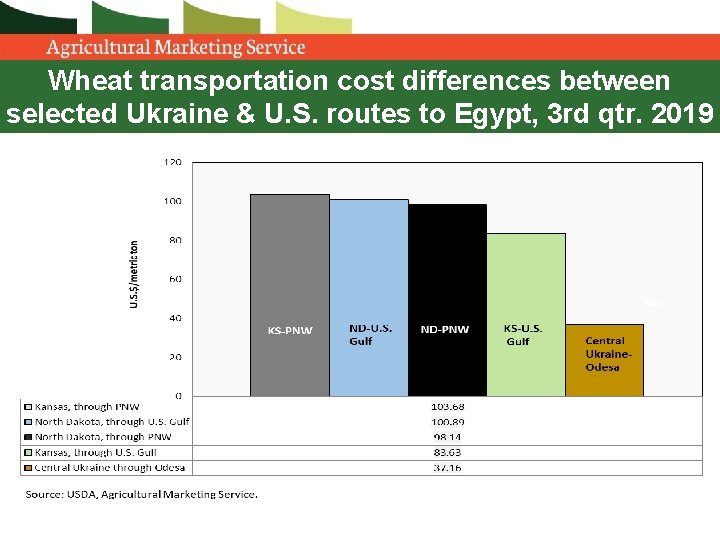
Wheat transportation cost differences between selected Ukraine & U. S. routes to Egypt, 3 rd qtr. 2019
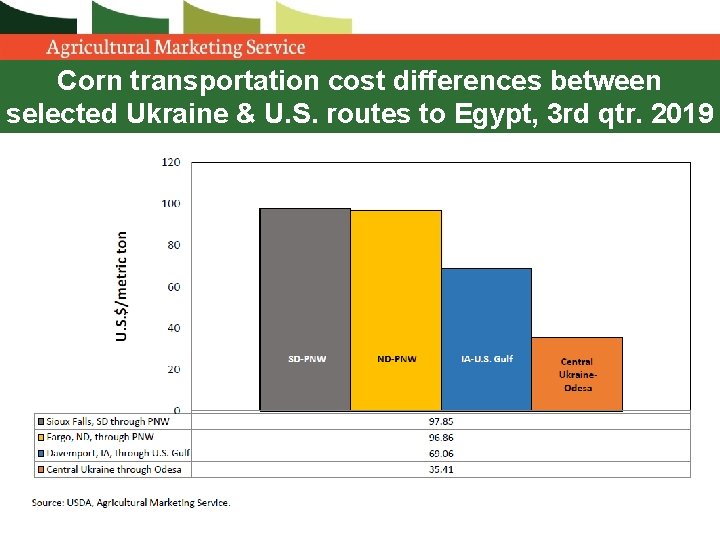
Corn transportation cost differences between selected Ukraine & U. S. routes to Egypt, 3 rd qtr. 2019
Ukraine Grain Transportation Report
Ukraine Grain Transportation Report
Ukraine Grain Transportation Report
Ukraine Grain Transportation Report
Ukraine Grain Transportation Report
Ukraine Grain Transportation Report Frequency to be determined.
Acknowledgments • U. S. Department of Agriculture: Office of the Chief Economist; Foreign Agricultural Service in Washington, DC, and the Office of Agricultural Affairs in Kiev, Ukraine, and Moscow, Russia; Economic Research Service, and Agricultural Marketing Service. • Bill Wilson, North Dakota State. • Centre for Transport Strategies in Kyiv, Ukraine.
Contact information Delmy Salin, Ph. D. Senior Economist, Transportation Services Division Agricultural Marketing Service U. S. Department of Agriculture Address: 1400 Independence Ave, SW Room 4531 -S Washington, DC 20250 Phone: (202) 720 -0833 Email: delmy. salin@usda. gov Website: www. ams. usda. gov/Ag. Transportation