Types of Maps Mercator Projections Conic Projections Gnomonic


")


")

 gradient changes quickly and the isolines are close together. A gentle")


- Slides: 30
Types of Maps Mercator Projections Conic Projections Gnomonic Projections Geologic Maps Topographic Maps
Mercator Projections Mercator Projection Is a map that has parallel lines of longitude and latitude Flaws Land Near Poles is exaggerated Shapes are correct, but land area is distorted
Conic Projections Conic Projection Is made by projecting points and lines from globe onto a cone. Very Little Distortion, High Degree of accuracy Best for Mapping Small Areas
Gnomonic Projections is made by projecting points and lines from a globe onto a piece of paper that touches the globe at a single point Distort Directions and Distance
Geologic Maps This is a geologic map of the water resources & rock types at Lake. Tahoe Geologic Maps show the distribution, arrangement & types of rocks located below the soil They also contain information about fault lines & other geologic features
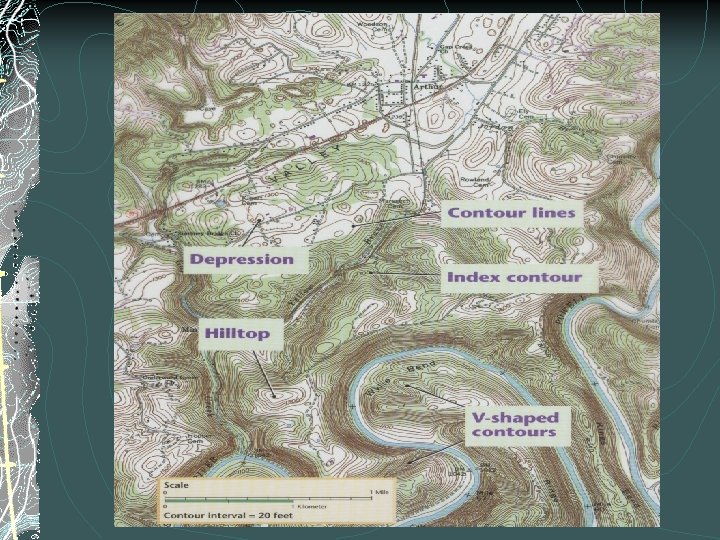
Topographic Maps Detailed maps that show the hills and valleys of an area Use Lines, Symbols, and Colors to represent change
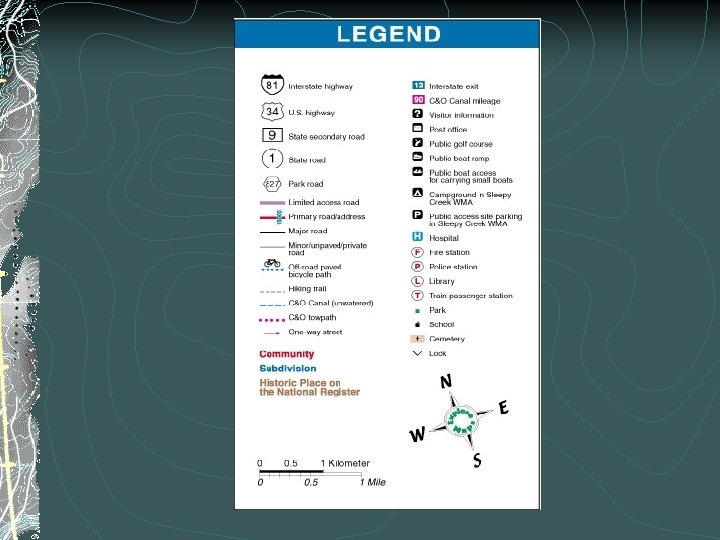
Map Features- map scales & legends
Map Legends Include symbols for both man made and natural features Specific Colors for Habitats Green for Woods Blue for Water
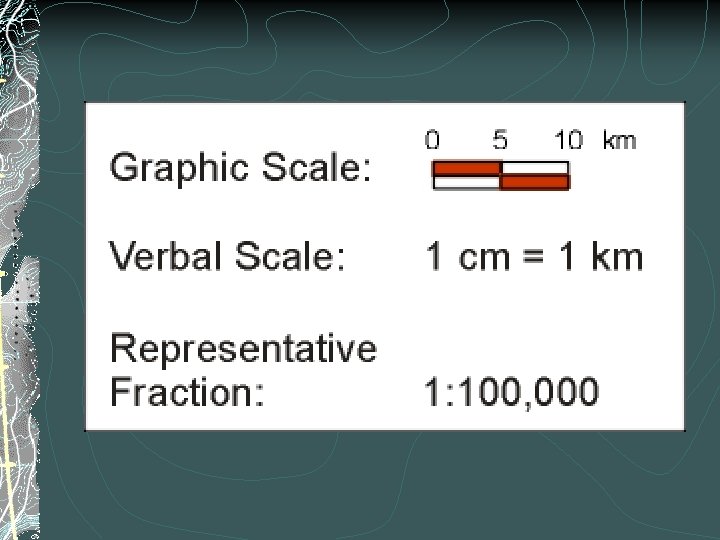
Map Scales Ratio of distance on a map to actual distances on the map 3 Types Verbal: “one inch equals one mile” Graphic: consists of a line that represents a certain distance on Earth Fractional: one unit on map represents one unit on Earth Large Ratio: map covering large area (minor detail) l Small Ratio: map covering little area (major l
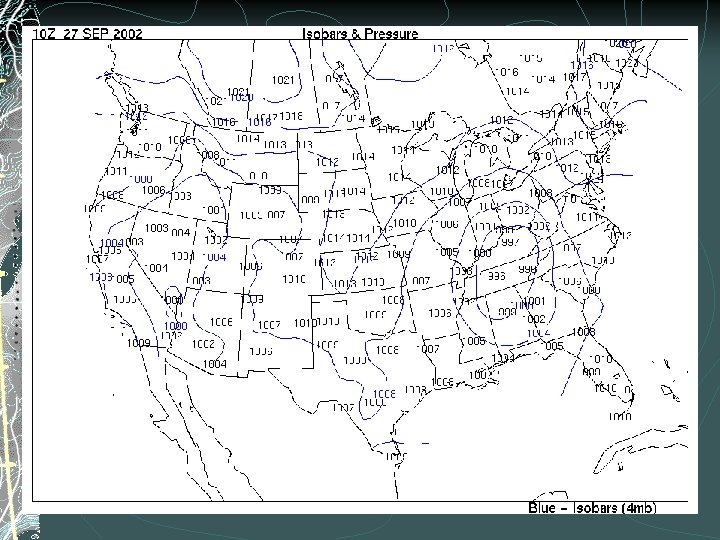
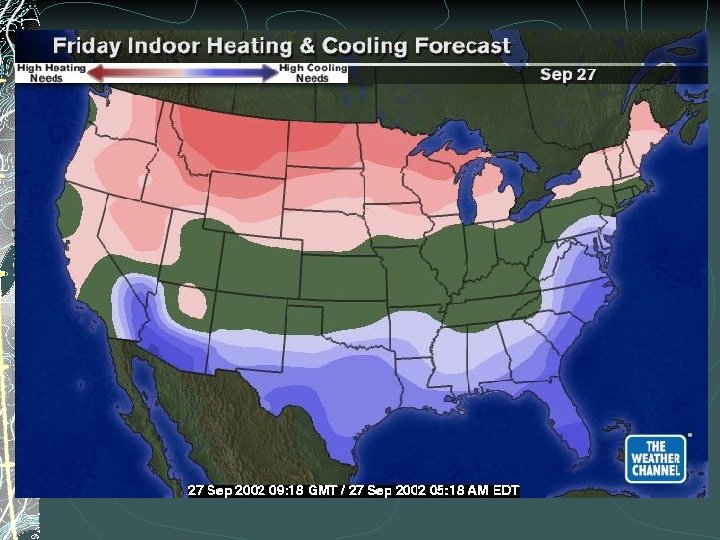
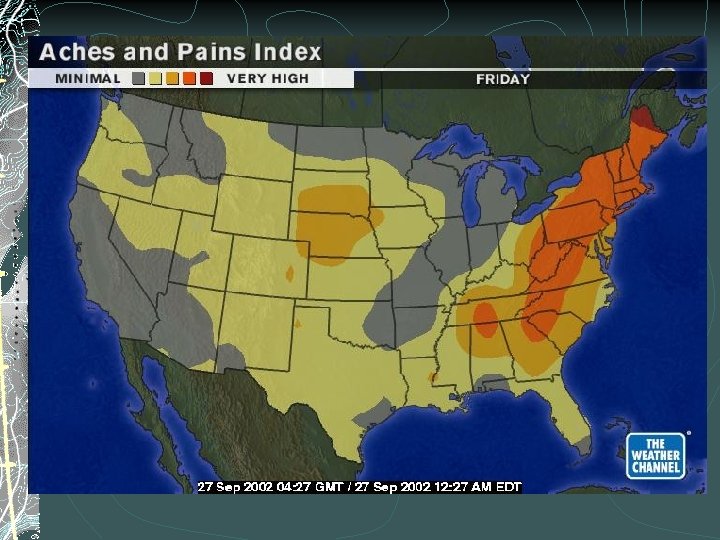
An isoline is a line connecting points Isolinesof equal value.
Examples of isolines: Isotherms: points of equal temperature Isobar: points of equal barometric (air) pressure Contour: (all over topo maps) points of equal altitude Concentration of chemicals Anything else you can get a value for. (The weather channel loves isolines!)
Rules for Drawing Isolines: 1. Isolines connect points of equal value. 5 5 10 10 10 15 15
2. Isolines are gentle, curving lines- no sharp corners. 5 5 10 10 10 15 15
3. Isolines are always closed curves even though the map might only show part of it.
4. Isolines NEVER cross- this would mean that one point has two different values. Ex: one spot has two temperatures? 40 ° 50 ° 30 ° 60 ° X 20° Y Z
5. Isolines usually are parallel. (They have a parallel trend. )
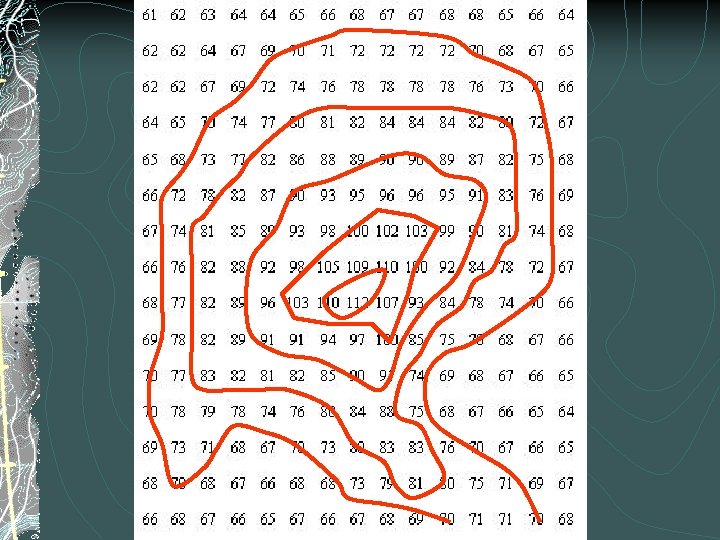
Gradient shows how quickly the value changes from one point to another.
A steep (high) gradient changes quickly and the isolines are close together. A gentle (low) gradient changes slowly and the lines are far apart. Steep area Gentle area
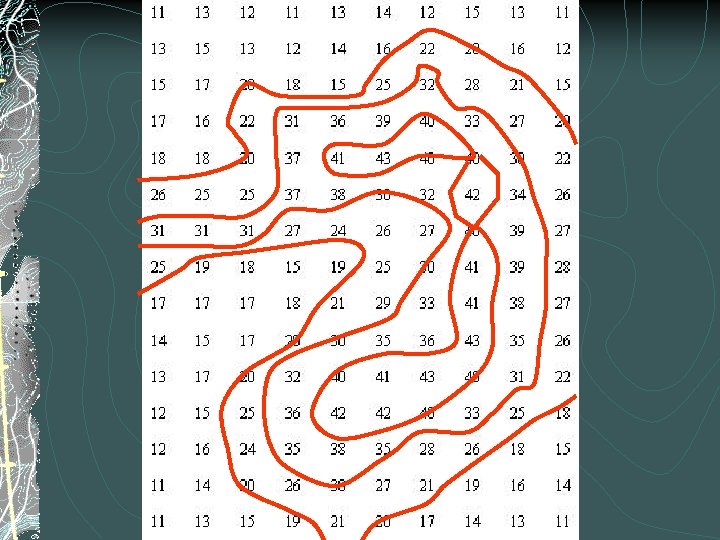
Highlight data points.
Fill in gaps in data. This is hard. You have to do a best guess.
Connect the dots. Use rounded lines, nothing sharp pointed.
Go on to the next value until done with map. Remember that contour lines are rounded