Title of Presentation Name Title Company Name Week


 involves the electrophoresis of serum or urine followed by immunodiffusion.")


")
 profile on immunoelectrophoresis showing abnormal Ig pattern.")
 IFE has replaced IEP in the evaluation of monoclonal gammopathies because")
: Technically simpler and less subject to antigenexcess")

 and immunoelectrophoresis (IEP) for two patients")
 and immunoelectrophoresis (IEP) for two patients")
 and immunoelectrophoresis (IEP) for two patients")
 and immunoelectrophoresis (IEP) for two patients")


 Required a radioisotope (radioactive) Antibodies were labeled with a radioisotope 125 I,")

 http: //youtu. be/RRbuz 3 VQ 100")
 Enzyme-linked immunosorbent assay (ELISA) Designed to detect antigens or")
 http: //youtu. be/70 TPrf. L_8 -M")


 Inhibition Immunofluorescent Assay Indirect Immunofluorescent Assay (IFA)")


 technique. After the labeling")


 used as light source. Measuring Methods:")


 Fundamentals of Laser Technology Flow Cytometry uses fluidics and laser")


 Figure 13 -04. Laser and cell-sorting schematic.")


- Slides: 90
Title of Presentation Name Title Company Name
Week 3 Immunoassays and Molecular Technology
Immunoassays Electrophoresis Immunoelectrophoresis Immunofixation ELISA/EIA Immunofluorescence Chemiluminescence Nephelometry Flow Cytometry
Electrophoresis is the migration of charged solutes or particles in an electrical field. (From Kaplan LA, Pesce AJ, Kazmierczak SC: Clinical chemistry, ed 4, St Louis, 2003, Mosby. )
Serum Electrophoresis Serum electrophoresis results in the separation of proteins into five fractions. Individual components rate of migration (From Kaplan LA, Pesce AJ, Kazmierczak SC: Clinical chemistry, ed 4, St Louis, 2003, Mosby. )
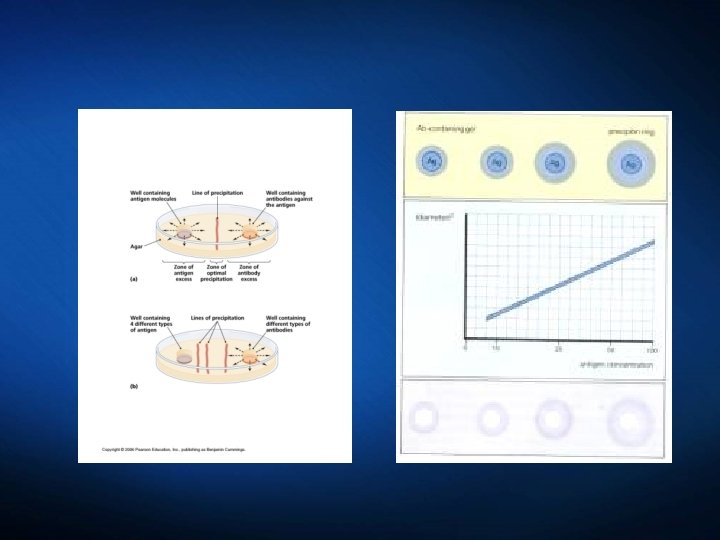
Immunoelectrophoresis (IEP) involves the electrophoresis of serum or urine followed by immunodiffusion.
Immunodiffusion
Antigen – antibody reaction
Precipitation lines Precipitation bands Detection of a specific protein
Sources of error Temperature: low temperature slows diffusion p. H: acid p. H will cause antigens and antibodies to separate. Ag concentration: High concentration may not be able to react with antibodies. Ab concentration: High concentration may not be able to react with antigens Multiple reactions may be difficult to discern if the precipitation bands are too close to each other
Principle of Immunoelectrophoresis Configuration for IEP. (From Burtis CA, Ashwood ER, Bruns DB: Tietz fundamentals of clinical chemistry, ed 6, St. Louis, 2008, Saunders. )
Normal Appearance of Precipitin Bands (Redrawn from Bauer JD: Clinical laboratory methods, ed 9, St Louis, 1982, Mosby. )
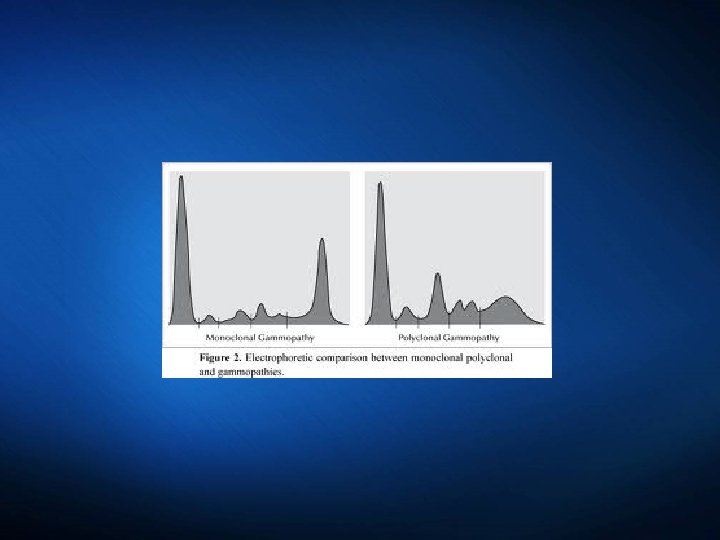
Clinical Applications of IEP The most common application of IEP is in the diagnosis of: Monoclonal gammopathy. Bence-Jones Proteins Macroglobulins Polyclonal gammopathy Multiple Myeloma: plasma cell malignancy A clone of plasma cells proliferates Produces a single type of immunoglobulin Polyclonal gammopathy, are observed in liver disease, rheumatoid disorders, chronic infections
Abnormal Appearance of Precipitin Bands Evaluation of following features of bands: Position of precipitin band in relationship to electrophoretically identified protein fractions. Position of precipitin band between the antigen well and the antibody trough. Distortion of the curvature or arc formation. Thickening (density) and elongation of band. Shortening (inhibition), thinning, or doubling of precipitin band.
Polyvalent and Monovalent Antisera Polyvalent- confirms the presence of major protein fractions (anti-human serum) Monovalent- identifies a specific protein fraction (anti-Ig. G, anti-Ig. A) Serum is preferred over plasma. Plasma contains fibrinogen which interferes with the reaction.
Figure 11 -05. Example of immunoglobulin (Ig) profile on immunoelectrophoresis showing abnormal Ig pattern. (Redrawn from Ritzman SE, Daniels JC: Laboratory notes—serum proteins, No. 3, Somerville, NJ, 1973, Behring Diagnostics/Hoechst Pharmaceuticals. )
Immunofixation Electrophoresis (IFE) IFE has replaced IEP in the evaluation of monoclonal gammopathies because of IFE’s rapidity and ease of interpretation. Applications: three variables of protein can be determined using IFE: 1. Antigenic specificity 2. Electrophoretic mobility 3. Quantity or ratio of the test and control proteins
Comparison of IEP and IFE Immunoelectrophoresis (IEP): Technically simpler and less subject to antigenexcess phenomenon than IFE. Considered to be a better technique than IFE for typing large monoclonal gammopathies. Immunofixation electrophoresis (IFE): Can be optimized to give greater sensitivity and higher resolution than IEP. Should be reserved for anomalous proteins, which are difficult to characterize by IEP. Easier to interpret than IEP.
Comparison of IEP and IFE
Figure 11 -06. Comparison of immunofixation electrophoresis (IFE) and immunoelectrophoresis (IEP) for two patients with monoclonal gammopathies. A, Patient specimen with an Ig. G (κ) monoclonal protein, as identified by IFE. Note the position of monoclonal protein (arrow). After electrophoresis, each track except serum protein electrophoresis (SPE) is reacted with its respective antiserum; then all tracks are stained to visualize the respective protein bands. Immunoglobulins G, A, and M (Ig. G, Ig. A, Ig. M); kappa (κ); and lambda (λ) indicate antiserum used on each track. (From Burtis CA, Ashwood ER, Bruns DE: Tietz fundamentals of clinical chemistry, ed 6, St Louis, 2008, Saunders. )
Figure 11 -06. Comparison of immunofixation electrophoresis (IFE) and immunoelectrophoresis (IEP) for two patients with monoclonal gammopathies. B, Same specimen as in A, with proteins identified by IEP. Note the position of monoclonal protein (arrow). Normal control (C) and patient sera (S) are alternated. After electrophoresis, antiserum is added to each trough, as indicated by the labels Ig, Ig. G, Ig. A, Ig. M, κ, and λ. The antisera react with separated proteins in the specimens to form precipitates in the shape of arcs. The Ig. G and k arcs are shorter and thicker than those in the normal control, showing the presence of the Ig. G (κ) monoclonal protein. (From Burtis CA, Ashwood ER, Bruns DE: Tietz fundamentals of clinical chemistry, ed 6, St Louis, 2008, Saunders. )
Figure 11 -06. Comparison of immunofixation electrophoresis (IFE) and immunoelectrophoresis (IEP) for two patients with monoclonal gammopathies. The concentrations C, Patient specimen with an Ig. A (λ) monoclonal protein identified by the IFE procedure, as described in A. (From Burtis CA, Ashwood ER, Bruns DE: Tietz fundamentals of clinical chemistry, ed 6, St Louis, 2008, Saunders. )
Figure 11 -06. Comparison of immunofixation electrophoresis (IFE) and immunoelectrophoresis (IEP) for two patients with monoclonal gammopathies. D, Same specimen as in C, with proteins identified by IEP, as described in B. The abnormal Ig. A and λarcs for the patient specimen indicate an elevated concentration of a monoclonal Ig. A (λ) protein. All separations were performed with the Beckman paragon system. (From Burtis CA, Ashwood ER, Bruns DE: Tietz fundamentals of clinical chemistry, ed 6, St Louis, 2008, Saunders. )
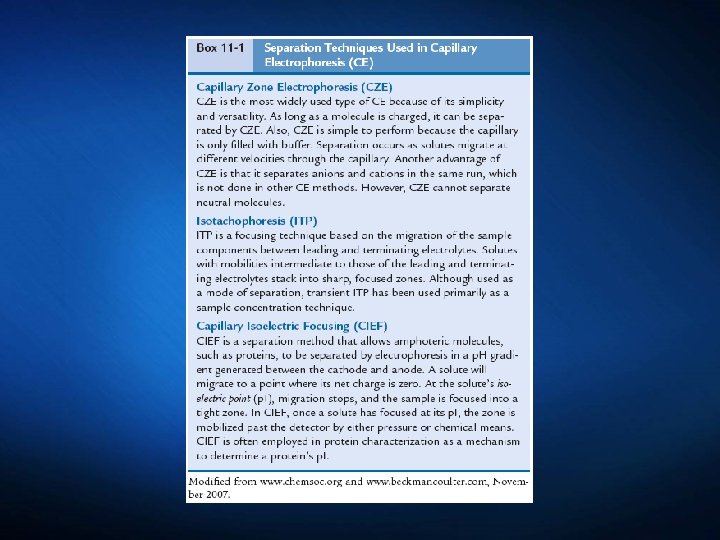
Capillary Electrophoresis The classic separation techniques of zone electrophoresis, isotachophoresis, isoelectric focusing, and gel electrophoresis are performed in a smallbore, fused-silica capillary tube. This method is efficient, sensitive, and rapid.
Complement fixation Utilizes the ability of Complement to lyse cells Complement is triggered by an Ag-Ab complex, or immune complex. In Complement Fixation (CF) A positive reaction is when there is no lysis, the titer of the antibody is the last tube that showed lysis.
Chapter 12 Labeling Techniques in Immunoassay
Immunoassay Formats Heterogeneous immunoassay: solid phase and requires washing steps to remove unbound antigens or antibodies; can be competitive and noncompetitive. Homogeneous immunoassays: liquid phase with no washing; faster and easier to automate than heterogeneous immunoassay; has competitive formats.
Radioimmunoassay (RIA) Required a radioisotope (radioactive) Antibodies were labeled with a radioisotope 125 I, Required a gamma counter Isotope use was highly regulated Special training to handle and store the radioactive material
Types of Immunoassay
Enzyme linked immunosorbent assay (ELISA) http: //youtu. be/RRbuz 3 VQ 100
Enzyme Immunoassay Enzyme immunoassay (EIA) Enzyme-linked immunosorbent assay (ELISA) Designed to detect antigens or antibodies by producing an enzymetriggered color change. Use a nonisotopic label.
Enzyme immunoassay (EIA) http: //youtu. be/70 TPrf. L_8 -M
Enzyme Immunoassay Enzymes used as labels: Horseradish peroxidase Alkaline phosphatase Glucose-6 -phosphate dehydrogenase Beta-galactosidase
Enzyme Immunoassay Enzymes used as labels must have: A high amount of stability Extreme specificity Absence from the antigen or antibody No alteration by inhibitor within the system
Enzyme Immunoassay Antigen and Antibody Detection: EIAs for Antigen Detection (e. g. , hepatitis B surface antigen) EIAs for Antibody Detection Noncompetitive EIAs Capture EIAs
Figure 12 -01. Principle of solid-phase enzyme immunosorbent assay. (Forbes BA, Sahm DF, Weissfeld AS: Bailey and Scott’s diagnostic microbiology, ed 12, St Louis, 2007, Mosby. )
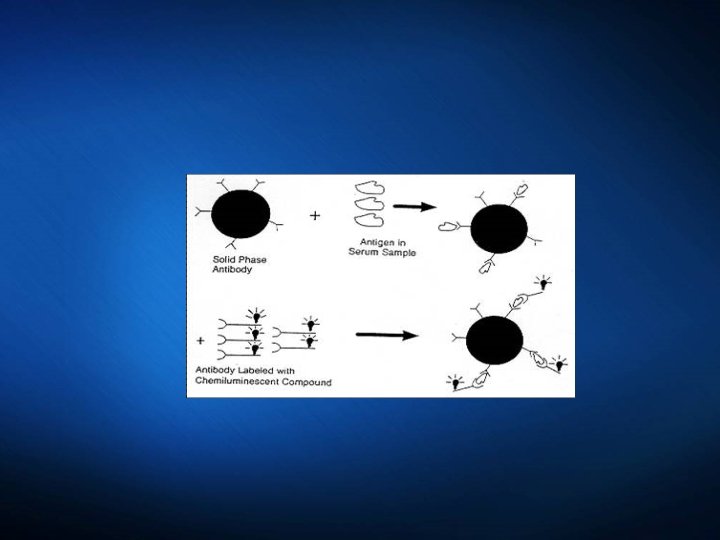
Chemiluminescence Used extensively in automated immunoassays. Chemiluminescence refers to light emission produced during a chemical reaction. Two formats: competitive and sandwich immunoassays. Replaced RIA.
Competitive Immunoassay Figure 12 -02. Format for competitive immunoassays. (Redrawn from Jandreski MA: Lab Med 29[9]: 557, 1998. )
Sandwich Immunoassay Figure 12 -03. Format for sandwich immunoassays. (Redrawn from Jandreski MA: Lab Med 29[9]: 557, 1998. )
Immunofluorescent Techniques Figure 12 -04. Principles of direct and indirect fluorescent techniques. A, Direct fluorescence. B, Indirect fluorescence. 1, Microscopic slide; 2, cell (cytoplasm and nucleus); 3, antiserum (conjugate in A, unconjugate in B); 4, conjugated antiglobulin serum.
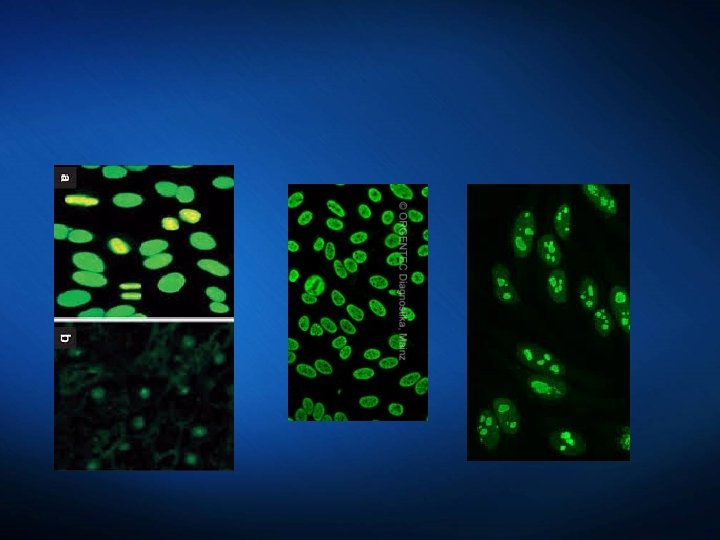
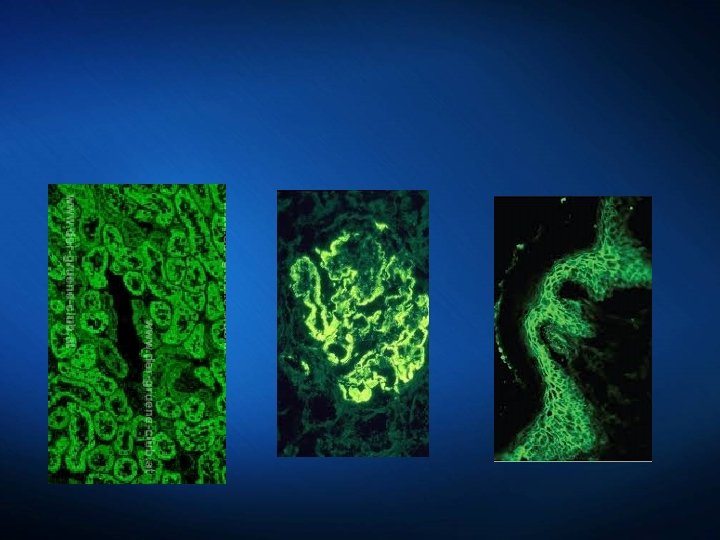
Immunofluorescent Techniques Direct Immunofluorescent Assay (DFA) Inhibition Immunofluorescent Assay Indirect Immunofluorescent Assay (IFA)
Fluorescence
Fluorescent dyes, or Fluorochromes Fluorescein Iso Thio Cyanate: FITC Phycoerythrin Peridinin chlorophyll protein (Per. CP) Allophycocyanin (APC)
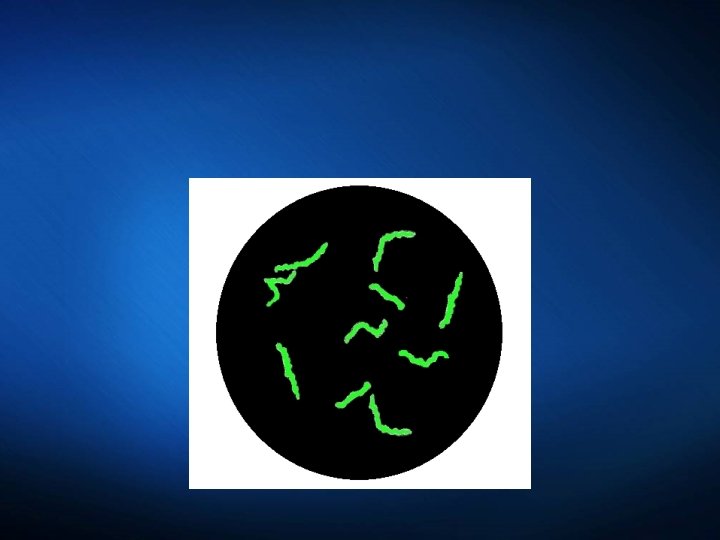
Direct Immunofluorescent Assay Figure 12 -05. Direct fluorescent antibody (DFA) technique. After the labeling of a specific antibody with FITC, it can be reacted with its antigen and identified microscopically.
Inhibition Immunofluorescent Assay A blocking test in which an antigen is first exposed to unlabeled antibody, then to labeled antibody, and is finally washed and examined.
Indirect Immunofluorescent Assay
In labs eia is replacing ifa Cost of reagents Technical time Fluorescence microscopy EIA may not be able to detect titers <1: 160
Emerging Labeling Technologies Quantum Dots: Q dots are semiconductor nanocrystals used as fluorescent labeling reagents for biologic imaging. Q dots vary in size/fluorescence SQUID Technology: Tags antibodies with superparamagnetic particles, allow the tagged antibodies to bind with the target antigen, and use a superconducting quantum interference device (SQUID) to detect the tagged antigen-antibody complex.
Emerging Labeling Technologies Luminescent Oxygen Channeling: Immunoassay based on two different latex particles. When these particles are close to one another during excitation, singlet oxygen moves from the donor bead to the receptor bead, where it triggers the generation of a luminescent signal. Signal Amplification Technology: May be used in a variety of both fluorescent and colorimetric detection applications.
Emerging Labeling Technologies Magnetic Labeling Technology: Application of high-resolution magnetic recording technology already developed for the computer disk drive industry; nonradioactive.
Figure 12 -06. Magnetic labeling techniques. A, Detection of deoxyribonucleic acid. Magnetic labeling techniques. B, Detection of antibodies. (Redrawn from Adelman L: Adv Med Lab Admin 11[6]: 131, 1999. )
Emerging Labeling Technologies Time-Resolved Fluoroimmunoassay: Fluorescence is measured after a certain time frame, to exclude background interference fluorescence. Fluorescence Polarization Immunoassay: Homogeneous competitive fluoroimmunoassay.
Trends in Immunoassay Automation Fluorescent Polarization Immunoassay: Automated analyzer designed to perform microparticle enzyme immunoassay, fluorescence polarization immunoassay, and ioncapture technologies.
Fluorescence Polarization
Fluorescent in Situ Hybridization: Uses fluorescent molecules to “brightly paint” genes or chromosomes .
Chapter 13 Automated Procedures
Characteristics of Automated Testing Preanalytical, e. g. , bar coding of specimens. Analytical phase—areas of concern: Automated results entry Quality control Validation of results Networking to LIS Postanalytical, e. g. , workload recording and network to other systems.
Nephelometry Principle: Formation of macromolecular complex is a fundamental prerequisite for nephelometric protein quantitation. Procedure is based on reaction between the protein being assayed and a specific antiserum. Procedure depends on lightscattering properties of antigenantibody complexes.
Nephelometry Figure 13 -01. Principle of nephelometry for the measurement of antigen-antibody reactions. Light rays are collected in a focusing lens and can ultimately be related to the antigen or antibody concentration in a sample.
Nephelometry Physical Basis: based on the principle of light scattered by a homogeneous particulate solution at a variety of angles. Three types of scatter: 1. Scatter around the particles. 2. Forward scatter because of out-ofphase backscatter. 3. Forward scatter exceeding backward scatter. 4. Sometimes latex particles (Ag-coated) as reaction intensifiers.
Nephelometry Optical System: infrared highperformance light-emitting diode (LED) used as light source. Measuring Methods: a fixed-time method is routinely used for precipitation reactions.
Nephelometry Advantages and Disadvantages: Advantages: Rapid, reproducible, relatively simple to operate. Disadvantages: High initial equipment cost and interfering substances (e. g. , microbial contamination, lipemia) may cause protein denaturation and erroneous test results.
Nephelometry An Application of Nephelometry— Cryoglobulins: Type I cryoprecipitate is a monoclonal Ig. G, Ig. A, or Ig. M. Type II cryoprecipitate is mixed, containing two classes of immunoglobulins, at least one of which is monoclonal. Type III cryoprecipitate is mixed, and no monoclonal protein is found.
Cryoglobulins Proteins that precipitated when cooled. Usually happens when cooled to 0 o. C Mostly composed of Ig. G or Ig. M Cryoglobulins are associated with Raynaud’s phenomenon.
Flow-Cell Cytometry (Flow Cytometry) Fundamentals of Laser Technology Flow Cytometry uses fluidics and laser technology Useful in cellular analysis It can be used with plastic beads as well Mostly used in the identification of molecules on the surface or cytoplasm of cells
Electromagnetic Spectrum Figure 13 -02. The electromagnetic spectrum. YAG, Yttrium-aluminum-garnet. (Redrawn from Turgeon ML: Clinical hematology: theory and procedures, ed 4, Philadelphia, 2003, Lippincott–Williams & Wilkins. )
Flow Cytometry Principles of Cell Cytometry: Combination of fluid dynamics, optics, laser science, high-speed computers, and fluorochromeconjugated monoclonal antibodies that rapidly classify groups of cells within heterogeneous mixtures. Based on staining of cells in suspension with an appropriate fluorochrome, either an immunologic reagent or some other marker with specific reactivity.
Flow Cytometry Cell Sorting Eight-Color Immunofluorescence Figure 13 -03. Laser flow cytometry. (Courtesy Ortho Diagnostics, Raritan, NJ. )
Flow Cytometry (cell sorting) Figure 13 -04. Laser and cell-sorting schematic.
Flow Cytometry Figure 13 -05. Fluorescent microsphere–based immunoassay for antibodies to hepatitis virus (Luminex x. MAP technology). This approach is especially valuable when multiple tests must be done. It utilizes aspects of both enzyme-linked immunosorbent assay (ELISA) and flow cytometry. A small amount of sample is known. Polystyrene microspheres are internally colorcoded with two fluorescent dyes that can be detected after laser illumination. (From Nairn R, Helbert M: Immunology for medical students, ed 2, St Louis, 2007, Mosby. )
Flow Cytometry Applications: Lymphocyte Subsets: 6 -color cell cytometry can determine absolute counts of mature T, B, and NK lymphocyte populations as well as CD 4+ and CD 8+ T-cell subsets. HLA-B 27 Antigen: clinically relevant to evaluation of seronegative spondyloarthropathies. Immunophenotyping CD 34+ stem cells Minimal Residual Disease
Figure 13 -06. Flow-cell cytometry “dot plots. ” In Panel A, cells stained with the red CD 4 antibody account for 59% of all lymphocytes; this is a normal sample. In Panel B, there is a reduction in the number of red-staining CD 4+ T cells; this sample is from a patient with HIV infection. PE, Phycoerythrin (emits red light); FITC, fluorescein isothiocyanate (emits green light). (From Nairn R, Helbert M: Immunology for medical students, ed 2, St Louis, 2007, Mosby. )
Power. Point Guidelines Font, size, and color for text have been formatted for you in the Slide Master Use the color palette shown below See next slide for additional guidelines Hyperlink color: www. microsoft. com Sample Fill Sample Fill
Power. Point Template Subtitle color Example of a slide with a subhead Set the slide title in “title case” Set subheads in “sentence case” Generally set subhead to 36 pt or smaller so it will fit on a single line The subhead color is defined for this template but must be selected. In Power. Point 2007, it is the fourth font color from the left
Bar Chart Example 5 4 3 Series 1 Series 2 2 Series 3 1 0 Category 1 Category 2 Category 3 Category 4
Pie Chart Example Chart Title 10% 23% 9% 59% 1 st Qtr 2 nd Qtr 3 rd Qtr 4 th Qtr
Line Chart Example 6 5 4 Series 1 Series 2 Series 3 Series 4 3 2 1 0 Category 1 Category 2 Category 3 Category 4
Area Chart Example 14 12 10 8 Series 1 6 Series 2 4 Series 3 2 0 Category 1 Category 2 Category 3 Category 4
Demo Title demo Name Title Group
Video Title video
Partner Title partner Name Title Company
Customer Title customer Name Title Company
Announcement Title announcing