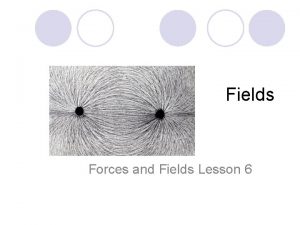
THE ROLE OF MAGNETIC FIELDS IN STAR FORMATION


- Slides: 30

THE ROLE OF MAGNETIC FIELDS IN STAR FORMATION Christopher F. Mc. Kee MFU V Corsica Oct 7, 2015 With: Pak-Shing Li Richard Klein Partial support provided by the National Science Foundation and NASA

OUTLINE I. Introduction: Magnetic Fields vs. Gravity II. Observations of magnetic fields in molecular cloud cores: (1) Small Scales (~< 1 pc) (Crutcher et al. 2010) (2) New Results from Old Data (Li, Mc. Kee & Klein 2015—LMK) III. Observing interstellar magnetic fields on a computer (LMK) IV. Magnetic Fields vs. Turbulence: The mean interstellar field is not weak-MA ~ 1 V. Conclusions

I. Introduction: Magnetic Fields vs. Gravity Magnetic energy scales as gravitational energy, so there is a magnetic critical mass: independent of scale where Φ = πR 2 B is the magnetic flux Magnetic energy = gravitational energy at the magnetic critical mass: (Numerical coefficient gives condition for instability for a magnetized sheet) Normalized mass-to-flux ratio: Magnetically supercritical: EG > EB , μΦ > 1 => Cloud can collapse Magnetically subcritical: EG < EB , μΦ < 1 => Cloud cannot collapse In ideal MHD, mass-to-flux ratio can increase only due to mass flow along the magnetic field; mass transport across the field is impossible

The Magnetic Flux Problem The diffuse ISM is magnetically subcritical=>cannot form stars (Mestel & Spitzer 56) 1. Magnetic fields exceed gravity in atomic ISM Modern 21 cm observations => μΦ < 1/6 in HI (Heiles & Troland 2005) 2. The length scale required for flow along the field to change this is too large to be effective in forming stars Their argument with modern data: Let N = n. L = column density along the field size of 1 Msun cloud for μΦ > 1 (In fact, this is the length scale formation of Giant Molecular Clouds, which were not discovered until 20 years later)

Classical Solution: Ambipolar Diffusion Mestel & Spitzer: since impossible to gather enough gas along the field to overcome the magnetic field, neutrals must undergo gravitational contraction by slipping through the ions and the magnetic field in shielded regions---ambipolar diffusion This became the standard paradigm for low mass star formation: Ambipolar diffusion enables gas to evolve from magnetically subcritical (μΦ < 1) to magnetically supercritical (μΦ > 1) (Shu+ 87) (Shu, Adams & Lizano ARAA 1987)

II. Observations of Magnetic Fields in Molecular Clouds: (1) Small Scales (Crutcher et al 2010) Zeeman observations of N Blos = column density x density-weighted line-of-sight (los) field in HI, OH and CN Let Btot = magnitude of the density-weighted total magnetic field from Zeeman observation, before projection along the los Then, since median cos theta=0. 5, median Btot = 2 x median Blos Recall that the atomic ISM is magnetically subcritical However, molecular cloud cores are magnetically supercritical Theory: GMCs have μΦ ~ 2 (Mc. Kee 1989) Crutcher (1999): Cores typically have μΦ = 2πG 1/2 (M/Φ) > 1 Alfven Mach number MA ~ 1 Troland & Crutcher (2008): OH observations with Arecibo Cores magnetically supercritical: median μΦ = 1. 7 -2. 6 Median MA =1. 5

Analysis of Zeeman observations suggests uniform distribution of Btot (Crutcher+ 2010) Use Bayesian analysis to include the majority of points with only upper limits on Blos Results: For n. H > 300 cm-3 (ie. , excluding most HI data), Btot varies as n. H α with α ≈ 0. 65 Note: this describes Btot for a clump as a function of its average density, not the variation of B within an individual clump. Btot/n. H 0. 65 uniformly distributed from f Bmax/n. H 0. 65 to Bmax/n. H 0. 65 with f ≈ 0. 03 Much better fit than delta function distribution for Btot/n. H 0. 65 Implies significant fraction of volume of ISM has low magnetic field

II. Observations of Magnetic Fields in Molecular Clouds: (2) New Results from Crutcher et al. Data (LMK) Analyze measured line-of-sight (los) fields instead of inferred total fields Numerical experiment confirms that must treat all data equally, including data < 2 sigma (41 of 68 observed cores) Density scaling: Blos varies as densityα, with α = 0. 63 ± 0. 07 Confirms Crutcher et al result that α(Btot) = 0. 65 Magnitude of Blos: <Blos> (n) ≈ 21 n 40. 65 μG adopting Crutcher α Since <Btot> = 2 <Blos>, it follows that the average field in molecular clumps in the ISM is <Btot> ≈ 43 n 40. 65 μG

III. Observing Interstellar Magnetic Fields on a Computer (P-S Li, CFM, & R. Klein--LMK) Observations: Zeeman observations give the density-weighted line-of-sight component of the field, Polarization gives direction of B in plane of sky Davis-Chandrasekhar-Fermi method: estimate magnitude of Bpos from fluctuations in direction and measurement of turbulent velocities Numerical simulations give full 3 D field

Differences between simulation and observations: Observations sample clouds with a range of physical conditions; simulation has a single set of initial conditions Observations smoothed over scale depending on distance to source; simulations smoothed on 0. 03 pc scale Maximum mass in simulation is 74 Msun vs 1400 Msun (OH) and 1700 Msun (CN) Simulations do not include non-ideal effects like ambipolar diffusion

High-Resolution Turbulent Box Simulation Code: ORION 2 ideal MHD with adaptive mesh refinement (AMR) (P-S Li + 12) Simulation: Physics included in simulation: Ideal MHD, self-gravity Periodic boundary conditions Drive turbulence at large scales (k=1 -2) throughout simulation Turn on gravity after 1 free-fall time, when turbulent density field established Resolution: 5123 base grid with 2 levels of refinement (max. resolution 20483) Dimensionless parameters: Mach numbers: Sonic M = 10, Alfven MA = 1 Gravitational energy ~ turbulent energy: αvir = 5σ2 L/(2 GM) = 1 Magnetically supercritical: μΦ = (5π/6αvir)1/2 MA = 1. 62

Setting the Scale Isothermal MHD simulations are scale free: mass, length, time arbitrary With self-gravity, one dimensional relation set by G: αvir = 5σ2 L / (2 GM) = 1 Second dimensional relation set by k. B T : Assume T = 10 K, the typical temperature in molecular gas Final dimensional relation set by assuming that the turbulence obeys the relation between the line width and size observed in molecular clouds: Set vrms = 0. 85 Lpc 0. 5 km s-1 in the simulation box => M = 3100 Msun , L = 4. 55 pc, n = 960 cm-3 , B = 32 μG, Δx = 500 AU

Volume Rendering of Density in the Magnetized Turbulent Box t=0. 5 tff after gravity on Mean density: 960 cm-3 Half mass above 5300 cm-3 4. 55 pc

Sample of Molecular Cloud Cores from Simulation At t=0. 57 free-fall times (t = 8 x 10⁵ yr) after gravity turned on 16% of mass has density high enough to have formed stars Find cores with Clumpfind (Williams + 1994) Merge all cores separated by < 0. 06 pc, the smallest separation permitted in the observations Choose the 100 most massive cores (minimum M is 1. 2 Msun) For comparison with observation, consider a central beam with radius 0. 3 r, the median value for observed clouds These regions are well resolved, with > 104 cells, median 47000 cells

Density Scaling of Magnetic Field: Agrees with Observation Crutcher + (2010) infer Btot varies as nα with α = 0. 65 For the 68 OH+CN molecular cores: median, (Blos / n 40. 65)1/2 = 11. 9 100 -core sample: Time-averaged <α> = 0. 70 ± 0. 06 <Btot /n 40. 65>1/2 = 18. 7 <Blos / n 40. 65>1/2 = 8. 9 Median Btot ≈ 2 Blos ✓ Simulated Blos / n 0. 65 ≈ 0. 75 x observed

Density Scaling of Magnetic Field: Agrees with Observation Crutcher + (2010) infer Btot varies as nα with α = 0. 65 For the 68 OH+CN molecular cores: median, (Blos / n 40. 65)1/2 = 11. 9 100 -core sample: Time-averaged <α> = 0. 70 ± 0. 06 <Btot /n 40. 65>1/2 = 18. 7 <Blos / n 40. 65>1/2 = 8. 9 Scaling due to self-gravity: not present before gravity turned on.

Distribution of Line-of-Sight (LOS) Field Agrees with Observation The K-S test shows that the simulation is similar to the data (p=0. 50) Remarkable, since data drawn from many clouds with different conditions

Log-Normal Fit for the Distribution of Simulated Btot Not a uniform distribution as inferred by Crutcher et al The dispersion of the log-normal is 0. 2, corresponding to a factor 1. 66 The K-S test for goodness of fit gives p=0. 89

Field-line tangling prevents very low Brms , particularly in more massive and/or denser cores In 100 -core sample, very small fields inferred from Zeeman obs. are due to tangling along los Smallest Brms / n 0. 65 = 1. 1 (Blos / n 0. 65)1/2 Smallest Btot / n 0. 65 = 0. 69 (Blos / n 0. 65)1/2 , ~ 3 times value in Crutcher+ model

The Mass-to-Flux Ratio μΦ in Simulated Clumps--1 Observers measure μΦ, los, which varies as Σlos/Blos, in central beam Measuring μΦ in turbulent clumps in simulations: Define disk with size of telescope beam centered on densest point Define μΦ as the minimum value over all orientations For constant density clump, corresponds to B perpendicular to disk For constant density clump: Spherical: Bmed = 2 Blos, med => μΦ, actual = 0. 5 μΦ, los, med Sheet: Σperp, med = (1/2) Σobs, med => μΦ, actual = 0. 25 μΦ, los, med Hence actual μΦ is (0. 25 -0. 5) times the observed one for constant-density clouds that are spherical or gravitationally flattened along B

The Mass-to-Flux Ratio μΦ in Simulated Clumps--2 Recall actual μΦ is (0. 25 -0. 5) times the observed one for constant-density clouds that are spherical or gravitationally flattened along B But real clouds and simulated clouds do not have constant density Key point: Observed μΦ, los depends on mass-weighted B Actual (theoretical) μΦ depends on area-weighted B We find actual median μΦ is 0. 7 x observable median los μΦ (significantly larger than (0. 25 -0. 5) x observable median los μΦ ) For Crutcher ea (2010) sample, median los μΦ = 4 => actual μΦ = 3 Observed molecular clumps are significantly magnetically supercritical

Conclusions from Simulation of Magnetized Molecular Cloud *Excellent agreement with density dependence of Btot: <α> = 0. 70 (sim) vs. 0. 65 (obs) *Very good agreement with observed distribution of Blos / n 0. 65 Median values differ by only a factor 1. 3 *Median simulated μΦ (Blos) is 2. 7 (sim), observed is 4. 1 (Crutcher ea 10) *Actual μΦ ~ 3 in observed molecular cores: significantly magnetically supercritical => No evidence that ambipolar diffusion important in the Crutcher et al sample of observed cores

Increase in mass-to-flux ratio beyond ideal MHD limit--1 Flux freezing implies that μΦ can decrease as matter fragments along a flux tube, but it can never increase on a flux tube. We find that 55% of the cores have μΦ(Btot) > initial value for the entire box (1. 62), with a maximum of μΦ = 13 (measured in central 0. 3 r). Two possibilities: Numerical diffusion—but we verified convergence to 0. 37 tff (Could not afford high resolution run to end of simulation at 0. 64 tff ) Turbulent reconnection, leading to “reconnection diffusion” (Lazarian 05; Santos-Lima+10; Lazarian+12)

Increase in mass-to-flux ratio beyond ideal MHD limit--2 Turbulent reconnection: In a turbulent medium, fluctuations in the magnetic field cascade down to small scales (Goldreich & Sridhar 1995), permitting reconnection throughout the volume of the turbulent medium (Lazarian & Vishniac 1999) Since reconnection diffusion is based on a turbulent cascade, the mechanism for resistivity is not crucial, so it is automatically included in numerical simulations, which have numerical resistivity. Our results support, but do not prove, turbulent reconnection as the origin of the supercritical (weak) fields in molecular clouds Ideal MHD is not ideal in a turbulent medium

IV. THE MEAN INTERSTELLAR FIELD IS MODERATELY STRONG: MA ~ 1 Relative strength of magnetic field and turbulence measured by Alfven Mach number MA = vrms / v. A = ( 4π<ρv 2> / B 2 )1/2 Let MA be the value for the mean magnetic field Strong mean field: MA ~< 1: uniform field >~ random field Weak mean field: MA >> 1: field strongly tangled (Padoan et al. ) Observations (H. -B. Li et al 2009): Compare (1) Zeeman observations of clumps on scales ~ < few pc with (2) Polarization observations of GMCs on scales of 100 -200 pc

Magnetic field structure on 200 pc scale in diffuse ISM correlated with that on < 1 pc scale in molecular clouds --- (Hua-Bai Li + 2009) Orientation of field in molecular cloud cores determined via submillimeter polarimetry (0. 10. 3 pc) 90% of cores have B within 45 degrees of that in ambient medium => turbulence does not dominate the field (MA ~< 1) Cores may be magnetically supercritical, but not too much unless turbulence very weak compared to gravity (αvir <<1) (recall μΦ = (5π/6αvir)1/2 MA ) Orientation of field in surrounding intercloud medium on 200 pc scales determined by optical polarization

Two simulations: “Strong” field: MA (<B>) = MA (Binitial) = 1 Weak field: MA (<B>) = MA (Binitial) = 10 Turbulence amplifies weak field so that MA drops to 1. 86; in strong field case, MA drops by only 15% Local properties of weak-field simulation consistent with observation and strong field model: B varies as n 0. 57 consistent with observed n 0. 65 Means and medians of Blos/n 0. 65 and Btot/n 0. 65 agree with strong field results within 25%, even though initial field 10 x weaker

Orientation of core fields with mean field in simulations Strong field orientations consistent with observation, weak field random (LMK) Conclude: Obs. and simulation => GMCs have moderately strong mean fields (simulated field is nonetheless supercritical)

CONCLUSIONS Analysis of line of sight fields and simulations confirms Crutcher et al’s conclusion that B varies as nα with α ≈ 0. 65 => B ≈ 43 n 40. 65 μG in molecular cloud cores Scaling due to self-gravity Actual (area-weighted) mass to flux ratio ≈ 0. 7 x observed (massweighted, los) mass to flux ratio: Observed actual value ≈ 3 No evidence for ambipolar diffusion in this sample Mass to flux ratio in converged simulations increased above initial value for entire simulation box, consistent with turbulent reconnection: Ideal MHD is not ideal in a turbulent medium Simulations confirm Hua-Bai Li et al’s results that the mean magnetic field in GMCs is moderately strong in that MA ~ 1 for the mean field

 Myrrh is mine its bitter perfume
 Red fields to green fields
 Learning: module 26: magnetic forces and fields
 Lesson outline lesson 1 magnets and magnetic fields
 Magnetic field in matter
 Magnetic force quiz
 Electric currents and magnetic fields
 Electric currents and magnetic fields
 Difference between antiferromagnetism and ferrimagnetism
 Magnetic field density
 Magnetic moment and magnetic field relation
 Magnetic force particle
 Ao * algorithm
 What does star (for star events) stand for
 Star formation
 Star formation
 Star formation
 Star formation
 Formation initiale vs formation continue
 Azure worker role
 Soziale identität krappmann
 Role conflict occurs when fulfilling the role expectations
 Hình ảnh bộ gõ cơ thể búng tay
 Bổ thể
 Tỉ lệ cơ thể trẻ em
 Voi kéo gỗ như thế nào
 Chụp phim tư thế worms-breton
 Bài hát chúa yêu trần thế alleluia
 Kể tên các môn thể thao
 Thế nào là hệ số cao nhất


