The Ohio River Valley Water Sanitation Commission ORSANCO
 A Monitoring Strategy and Design for")


 50 Riverwide (13 in Upper 324) 50 @")

 approach… Probability design for the entire Ohio River. Adequate sample density to")
 Summary… Decisions made to establish 305(b) approach… How many sites per unit? 15?")
 -")
 approach… When we encounter a failing site… List some area of shoreline")
 assessment of a single pool to potentially list")


- Slides: 31
The Ohio River Valley Water Sanitation Commission (ORSANCO) A Monitoring Strategy and Design for the Application of Biological Indicators
ORSANCO Interstate Water Pollution Control Agency Compact 8 states 1948
Ohio River 981 miles long 6 mainstem states 8 Signatory states
Looking back…. a history of targeted sampling. Biological sampling began in 1957. Lockchamber rotenone sampling Database continuous through present 1991 Began night electrofishing Began Index development 1999 -2000 Index tested and refined 2003 Index published! The Ohio River Fish Index (ORFIn)
What lies ahead for us…. ? Development of a monitoring design. Use the fish index in making assessments and reporting on the condition of the resource. • 305(b) • 303(d) • TMDL
How…. ? How do you sample and assess 981 miles of river…with limited resources…in a timely fashion?
Do more with less… …apply a probability design!
But at what scale…? Riverwide ? Reach segment ? Pool segment ? Smaller ?
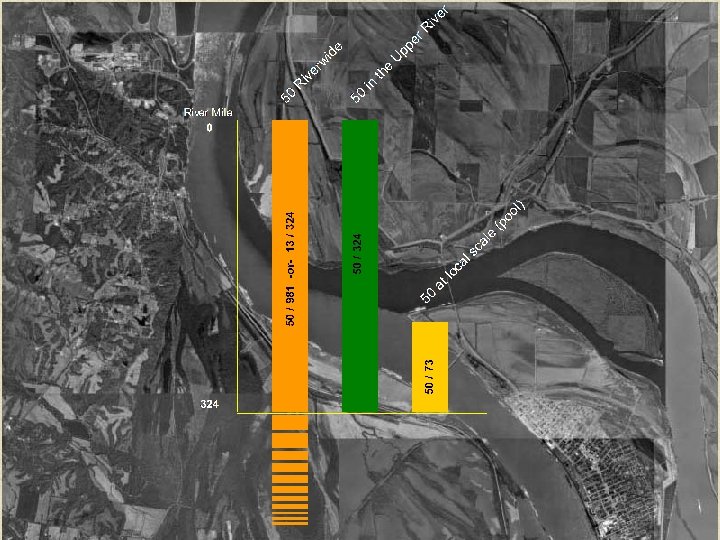
2003 – RARE Project Funded by USEPA Region III Upper 300 miles of the river. Examined results from application of a probability design at 3 different scales. Riverwide Reach Pool
50 @ Pool Scale (73 miles) 50 Riverwide (13 in Upper 324) 50 @ Reach Scale (50 in Upper 324)
Moving ahead… Use navigational pools as the main assessment unit. Assess the condition of the fish community within a single navigational pool. • Pool behaving like series of lakes.
The 305(b) approach… Probability design for the entire Ohio River. Adequate sample density to provide 15 -30 samples in each pool, with overdraw. If a 15 site sample size does not provide necessary level of precision…a second years application of the design, adding more sites, will be conducted to increase sample size and improve precision.
305(b) Summary… Decisions made to establish 305(b) approach… How many sites per unit? 15? 30? What confidence? 95%? 90%? What precision? +/- 10%?
- 303(d) -
Current 303(d) approach… When we encounter a failing site… List some area of shoreline around that site. Problem…. This approach is actually ‘redefining’ the assessment unit as the area we delineate. We then are basing an ‘assessment’ of the condition of that site on a single sample. This goes away from concepts of confidence, precision, and data values we followed in the 305(b) approach.
Revised Approach…. ? Use the 305(b) assessment of a single pool to potentially list the entire pool. 15 or 30 sites tells us something about the condition of the pool. One EF sample tells us near to nothing about a single site. Multiple passes are needed to assess a site.
Assessing…and listing an entire pool. What ratio of pass/fail revealed by the 15 -30 samples will determine if a pool ‘passes’ or ‘fails’ ? 25% may make sense…. why?
EPA…. that’s why. EPA recommends that when ‘true’ reference conditions do not exist, it is appropriate to use the 25 th percentile of the ‘best attainable’ condition as the criteria. We used the 25 th percentile values derived from ‘least impacted’ sites on the Ohio River to establish criteria for the ORFIn.
Why 25%…. ? We know that 25% of our ‘least-impacted’ sites fail. We designed our IBI that way. If we assume an equal distribution of ‘L-I’ sites throughout each pool and the entire river, we would expect to have 25% failing. We know that the poorer sites are NOT distributed evenly across pools or the system. Lets use 25% as a benchmark, and concentrate increased efforts on the areas that have a proportion of failing sites that is HIGHER than 25%. This would help us find and concentrate on problem areas.
“All chemical criteria and some biological criteria should be defined in terms of magnitude, frequency, and duration. The frequency component should be expressed in terms of a number of allowed excursions in a specified period (return period) and not in terms of a number of absolute “never to be exceeded” limit. The requirement of “no exceedances” for many water quality criteria is not achievable given natural variability alone, much less with the variability associated with discharges from point and nonpoint sources. ” (Taken from National Research Council, 2001)
When a pool fails…. Assuming that we have accepted the assessment…how do we list? 4 a - cause has an approved TMDL in place 4 b - cause to be removed by other programs (319, etc) 4 c - impairment caused by something other than a pollutant (habitat, natural, etc. ) 5 a - biology impaired, but unknown cause – more work needed 5 b - impairment based on fish tissue 5 c - pollutant positively identified – TMDL for that pollutant needed
5 a – UNKNOWN CAUSE/SOURCE Integrated monitoring program needed to define relationships between problem and cause. Need WQ data collected WITH biological data. Need targeted sampling effort to help pinpoint sources and define cause /effect relationships.
e s 5 lem e Habitat r’ r Ka Response s t n Stressors Flow Stressors All other categories Water Quality Bio Response Cat. 5 a Energy Source Biotic Interactions
Any category other than 5 a…. . Requires us to get from… HERE…………. TO……………. HERE Bio Response Stressors
Cat. 5 We can’t do that without these… Habitat Flow Water Quality Energy Source Biotic Interactions If you can…you must be this guy!
Integration needed… Combine biological monitoring with, water quality, flow, and other data to… …get from HERE………. …. TO…………………. . …HERE Bio Response …AND…. list under the proper category! Stressors
ARE WE SURE…. ? …TMDL’s are a big deal…
Following a base n of 15 samples in a single Assessment Unit… Were sure, accept, move on. Unsure, increase n in second year until we are sure, or a max of 50 samples is reached. Accept when – confidence 90%, precision is +/-12 or max 50 samples.
Outside the probability frame… Targeted Sampling Fixed Stations • Long-term trend assessment s 6 fixed stations in each river reach segment (upper-middlelower) s Monitored annually s Within the same 3 -4 week window Sampling to test and refine index. Sampling to better pinpoint problem areas • Sources etc.
Questions……. . ?