The Metaanalysis A noon conference presentation Kendall Moseley





- Slides: 26
The Meta-analysis: A noon conference presentation Kendall Moseley, MD Kevin Woods, MD With commentary by Hunter Young, MD MHS
Alcohol Dosing and Total Mortality in Men and Women An Updated Meta-analysis of 34 Prospective Studies Augusto Di Castelnuovo, Sc. D; Simona Costanzo, Sc. D; Vincenzo Bagnardi, Sc. D; Maria Benedetta Donati, MD, Ph. D; Licia Iacoviello, MD, Ph. D; Giovanni de Gaetano, MD, Ph. D
How much alcohol is healthy for you?
Background n n n Previous studies have shown that moderate amounts of alcohol have helped prevent coronary artery disease (CAD). Alcohol abuse can be harmful. Some studies indicate that alcohol may have different effects in men and women.
How is ETOH good for you? n n Increased HDL cholesterol Increased fibrinolysis Decreased platelet aggregation and coagulation factors Possible beneficial effects on endothelial function and inflammation
Clinical Questions n n What is the relationship between alcohol dosing and all-cause mortality? Is there a statistical difference between men and women?
Methods n n Pubmed search Limits: Human Dates: (all studies – 12/2005) Searched titles and abstracts containing: alcohol, beer , wine , spirits AND mortality or , , , death
Exclusion Criteria n n n only 1 category of risk (n=4) did not report mortality separately for the sexes (n=5) considered mortality for specific causes (n=3) comprised multiple reports (n=9) reference category was not the one with the lowest alcohol intake (n=4) relative risks or numbers of cases and personyears were not available (n=14)
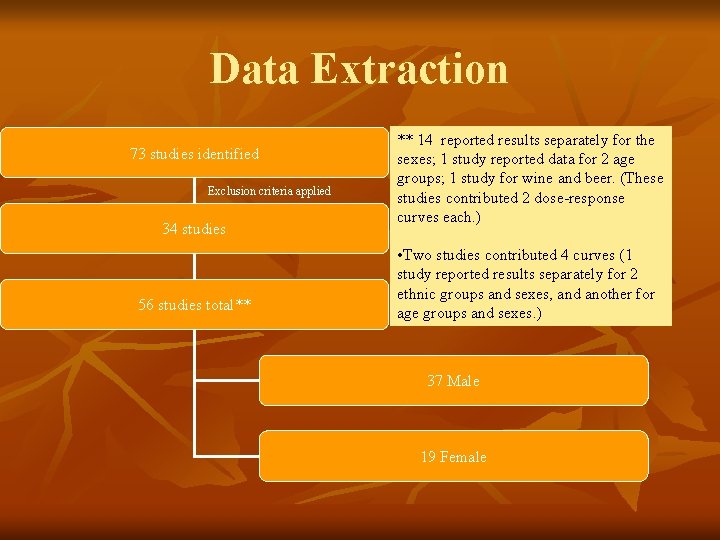
Data Extraction 73 studies identified Exclusion criteria applied 34 studies 56 studies total** ** 14 reported results separately for the sexes; 1 study reported data for 2 age groups; 1 study for wine and beer. (These studies contributed 2 dose-response curves each. ) • Two studies contributed 4 curves (1 study reported results separately for 2 ethnic groups and sexes, and another for age groups and sexes. ) 37 Male 19 Female
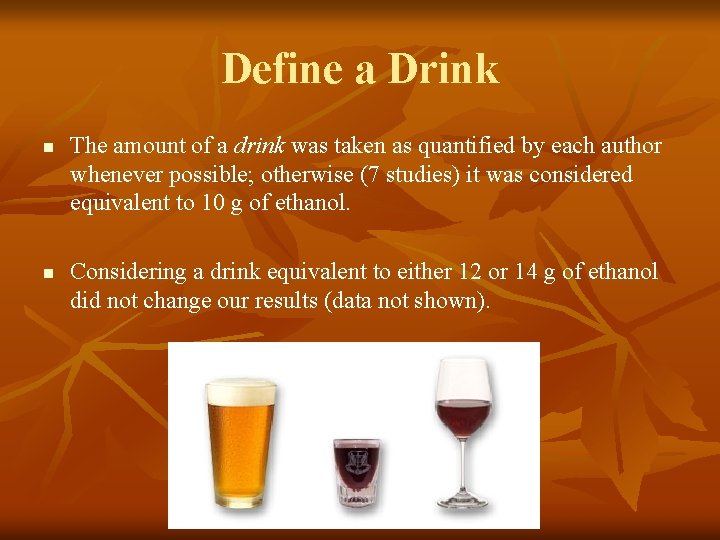
Define a Drink n n The amount of a drink was taken as quantified by each author whenever possible; otherwise (7 studies) it was considered equivalent to 10 g of ethanol. Considering a drink equivalent to either 12 or 14 g of ethanol did not change our results (data not shown).
A Standard Drink • U. S. DEPARTMENT OF HEALTH & HUMAN SERVICES, National Institutes of Health National Institute on Alcohol Abuse and Alcoholism, Helping Patients Who Drink Too Much : A CLINICIAN’S GUIDE 2005 Edition
Helpful Conversions • U. S. DEPARTMENT OF HEALTH & HUMAN SERVICES, National Institutes of Health National Institute on Alcohol Abuse and Alcoholism, Helping Patients Who Drink Too Much : A CLINICIAN’S GUIDE 2005 Edition
SUMMARY • Over 1 million Subjects • Studies representative of 5 countries • Follow up years ranged from 5. 5 – 26 years • Level of Adjustment identified for over 20 factors.
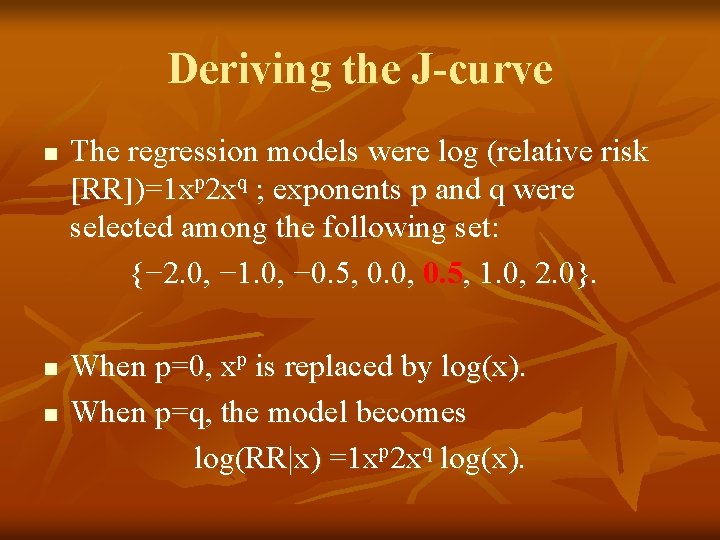
Deriving the J-curve n n n The regression models were log (relative risk [RR])=1 xp 2 xq ; exponents p and q were selected among the following set: {− 2. 0, − 1. 0, − 0. 5, 0. 0, 0. 5 {− 2. 0, − 1. 0, − 0. 5, 0. 0, , 1. 0, 2. 0}. When p=0, xp is replaced by log(x). When p=q, the model becomes log(RR|x) =1 xp 2 xq log(x).
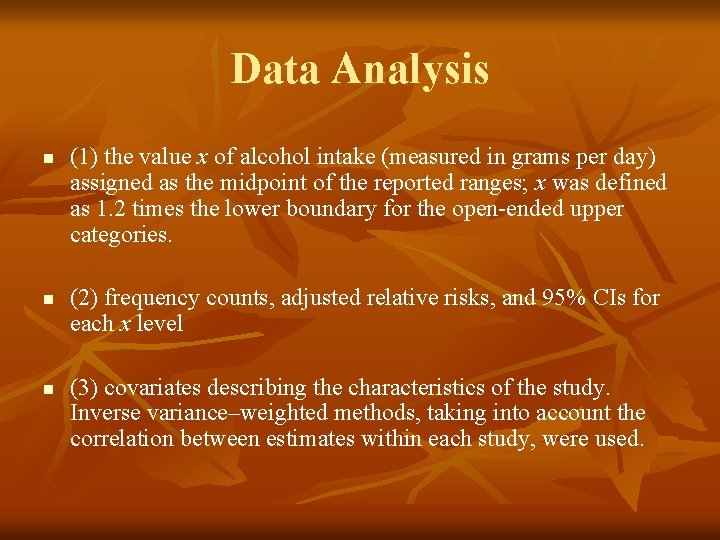
Data Analysis n n n (1) the value x of alcohol intake (measured in grams per day) assigned as the midpoint of the reported ranges; x was defined as 1. 2 times the lower boundary for the open-ended upper categories. (2) frequency counts, adjusted relative risks, and 95% CIs for each x level (3) covariates describing the characteristics of the study. Inverse variance–weighted methods, taking into account the correlation between estimates within each study, were used.
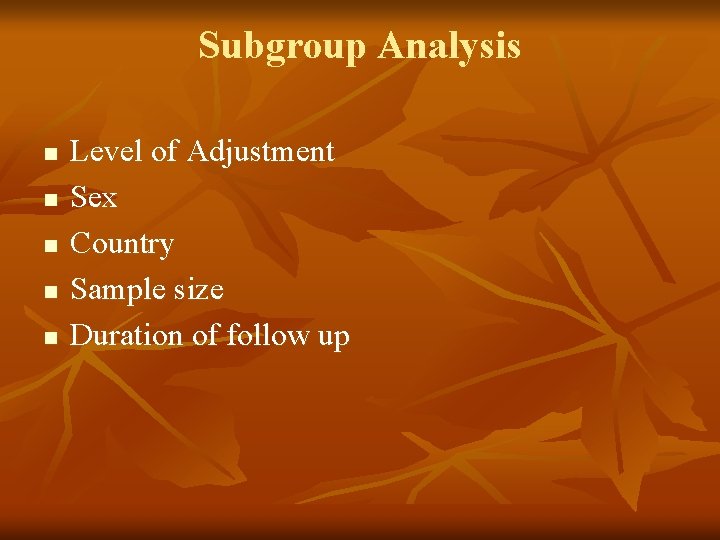
Subgroup Analysis n n n Level of Adjustment Sex Country Sample size Duration of follow up
Subgroup Analysis n n n Level of Adjustment Sex Country Sample size Duration of follow up ___________ Reversion point: the dose of alcohol at which the protection against total mortality is no longer statistically significant at the 99% confidence level.
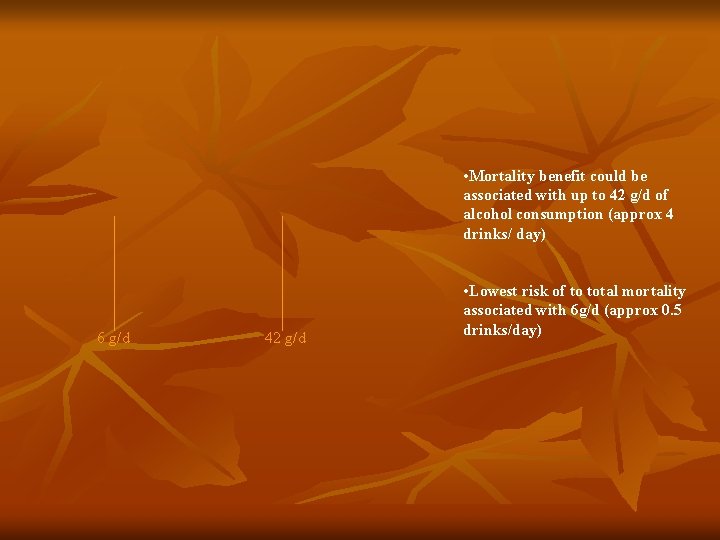
• Mortality benefit could be associated with up to 42 g/d of alcohol consumption (approx 4 drinks/ day) 6 g/d 42 g/d • Lowest risk of to total mortality associated with 6 g/d (approx 0. 5 drinks/day)
• Dose response curves are similar for both sexes when alcohol intake is light, but differs with heavier alcohol consumption • Protection apparent up to 3 drinks/day in MEN • Protection apparent up to 2 drinks/day in WOMEN
• Obvious differences between women from different countries. (p >. 54 for differences between countries)
• However the differences between men from different countries were significant (p >. 003) • Maximum risk reduction for European Men (20 -28%) • Maximum risk reduction for US Men (14 -19%) • ** no explanation was offered to explain this relationship
Why is there a difference between the Sexes?
Key Findings n n n Low levels of ETOH intake are significantly associated with reduced total mortality. While both sexes benefit from moderate ETOH intake, the dose of ETOH at which this benefit is realized is different for men (3 drinks/day) and women (2 drinks/day) The relationship of ETOH intake and decreased mortality is lower in US-based studies as opposed to European (men only)
Discussion
The Big Picture n n Why a meta-analysis? (and by the way, what is a meta-analysis? ) How should this type of study be applied to your clinical decision-making?
Other Related Resourcs n National Institute on Alcohol Abuse and Alcoholism