Surface Reconstruction Misha Kazhdan Outline Introduction Preliminaries A


- Slides: 39
Surface Reconstruction Misha Kazhdan
Outline • • Introduction Preliminaries A sampling of methods Why is reconstruction hard?
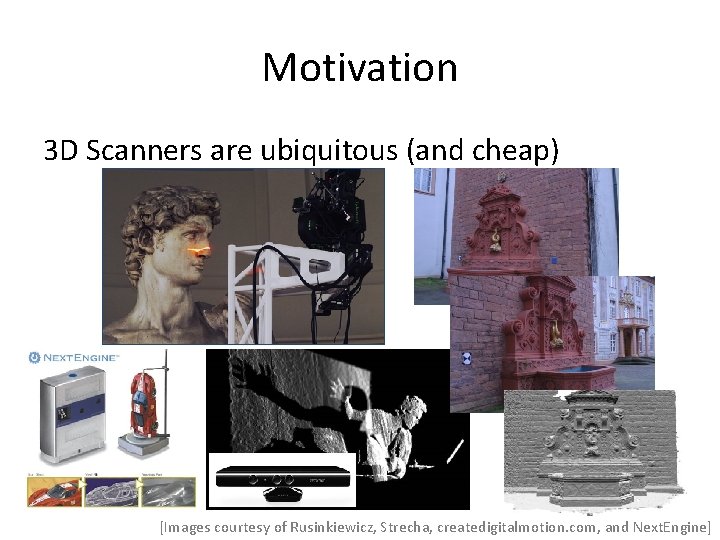
Motivation 3 D Scanners are ubiquitous (and cheap) [Images courtesy of Rusinkiewicz, Strecha, createdigitalmotion. com, and Next. Engine]
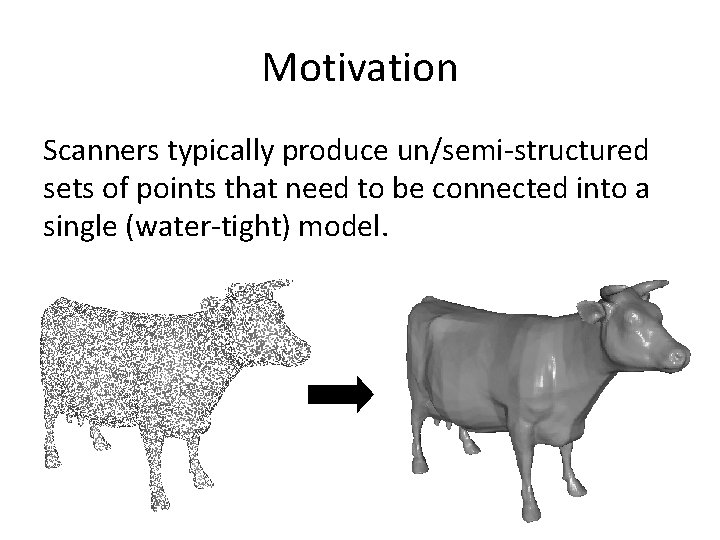
Motivation Scanners typically produce un/semi-structured sets of points that need to be connected into a single (water-tight) model.
Related Work …/… [403] [List courtesy of Alliez]
Related Work Classification: • Computational Geometry vs. Implicit Surfaces • Oriented vs. Unoriented Points • Structured vs. Unstructured Data • Water-tight vs. Surface with Boundary Output • Etc.
Related Work Classification: • Computational Geometry – Uses input to partition space – Use a subset of the partition to define the shape • Implicit Surfaces – Fit implicit function to the input – Extract iso-surface
Outline • Introduction • Preliminaries – Convex Hulls – Delaunay Triangulations – Voronoi Diagrams – Medial Axes • A sampling of methods • Why is reconstruction hard?
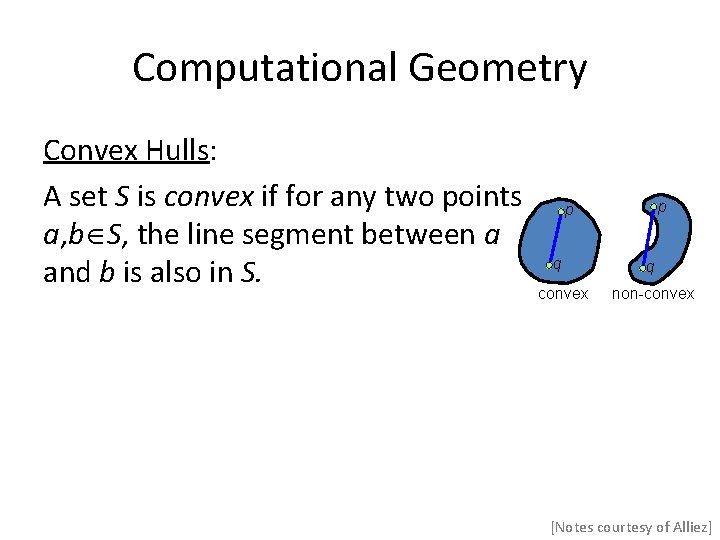
Computational Geometry Convex Hulls: A set S is convex if for any two points a, b S, the line segment between a and b is also in S. p p q convex q non-convex [Notes courtesy of Alliez]
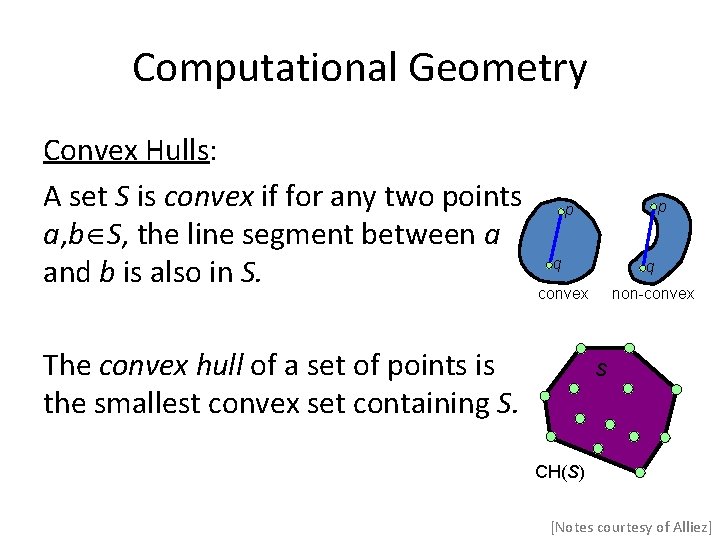
Computational Geometry Convex Hulls: A set S is convex if for any two points a, b S, the line segment between a and b is also in S. p p q q convex The convex hull of a set of points is the smallest convex set containing S. non-convex S CH(S) [Notes courtesy of Alliez]
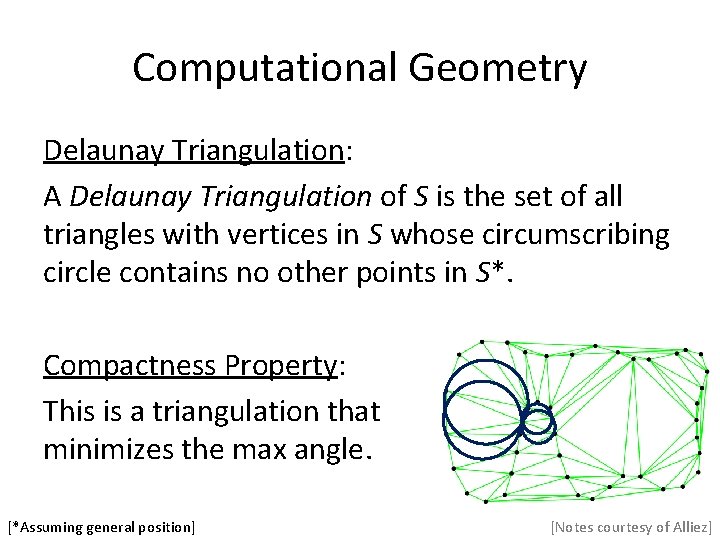
Computational Geometry Delaunay Triangulation: A Delaunay Triangulation of S is the set of all triangles with vertices in S whose circumscribing circle contains no other points in S*. Compactness Property: This is a triangulation that minimizes the max angle. [*Assuming general position] [Notes courtesy of Alliez]
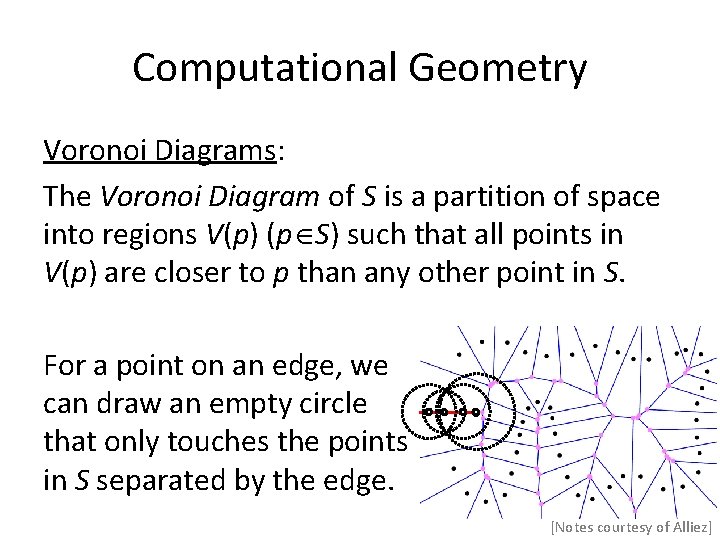
Computational Geometry Voronoi Diagrams: The Voronoi Diagram of S is a partition of space into regions V(p) (p S) such that all points in V(p) are closer to p than any other point in S. For a point on an edge, we can draw an empty circle that only touches the points in S separated by the edge. [Notes courtesy of Alliez]
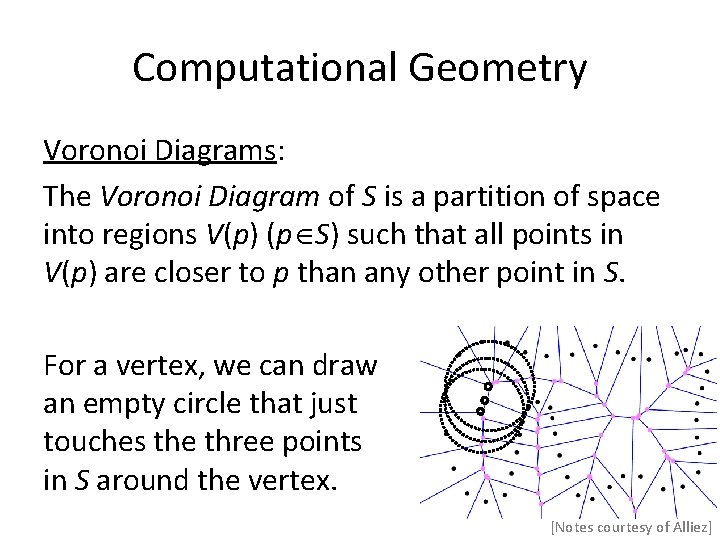
Computational Geometry Voronoi Diagrams: The Voronoi Diagram of S is a partition of space into regions V(p) (p S) such that all points in V(p) are closer to p than any other point in S. For a vertex, we can draw an empty circle that just touches the three points in S around the vertex. [Notes courtesy of Alliez]
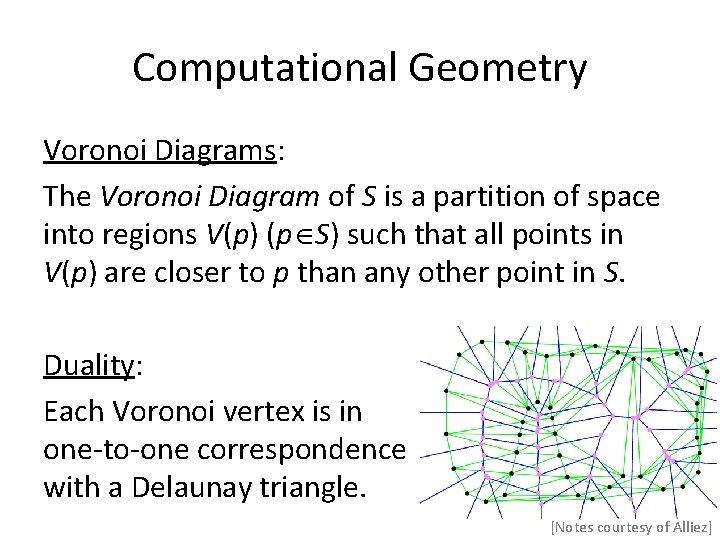
Computational Geometry Voronoi Diagrams: The Voronoi Diagram of S is a partition of space into regions V(p) (p S) such that all points in V(p) are closer to p than any other point in S. Duality: Each Voronoi vertex is in one-to-one correspondence with a Delaunay triangle. [Notes courtesy of Alliez]
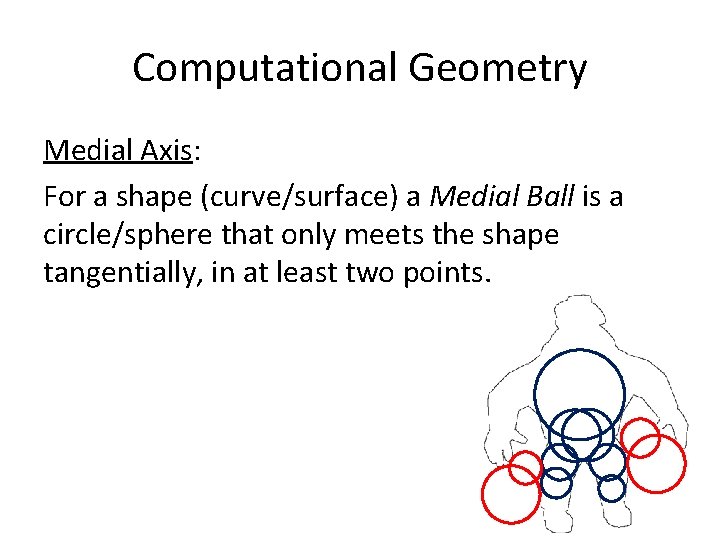
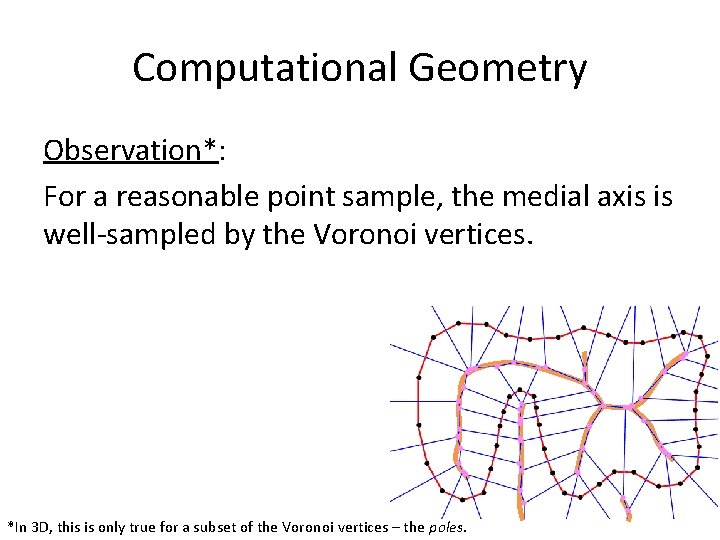
Computational Geometry Medial Axis: For a shape (curve/surface) a Medial Ball is a circle/sphere that only meets the shape tangentially, in at least two points.
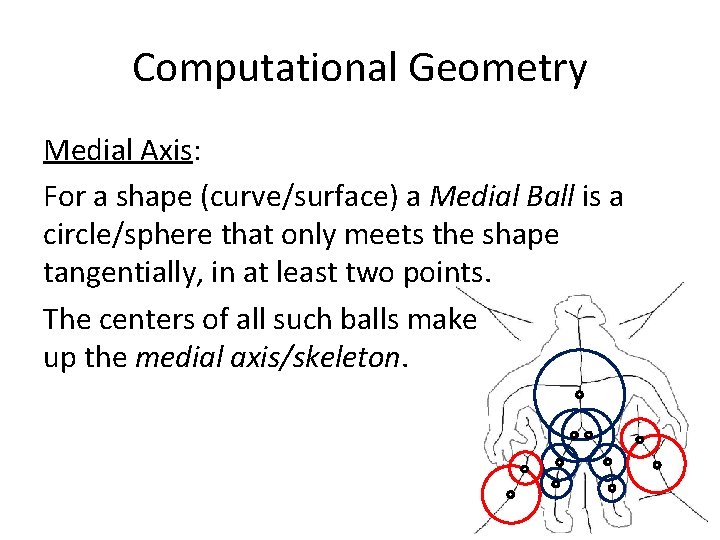
Computational Geometry Medial Axis: For a shape (curve/surface) a Medial Ball is a circle/sphere that only meets the shape tangentially, in at least two points. The centers of all such balls make up the medial axis/skeleton.
Computational Geometry Observation*: For a reasonable point sample, the medial axis is well-sampled by the Voronoi vertices. *In 3 D, this is only true for a subset of the Voronoi vertices – the poles.
Outline • Introduction • Preliminaries • A sampling of methods – Space Partitioning Computational Geometry – Crust – … from Unorganized Points Implicit Surfaces – Poisson Reconstruction • Why is reconstruction hard?
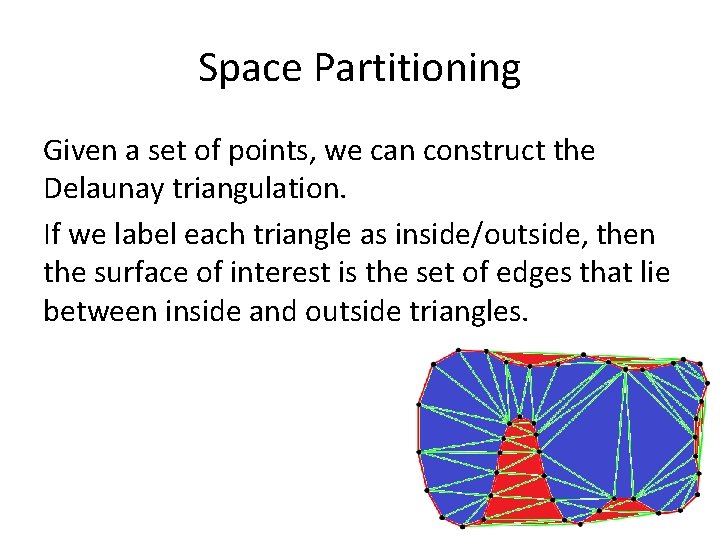
Space Partitioning Given a set of points, we can construct the Delaunay triangulation. If we label each triangle as inside/outside, then the surface of interest is the set of edges that lie between inside and outside triangles.
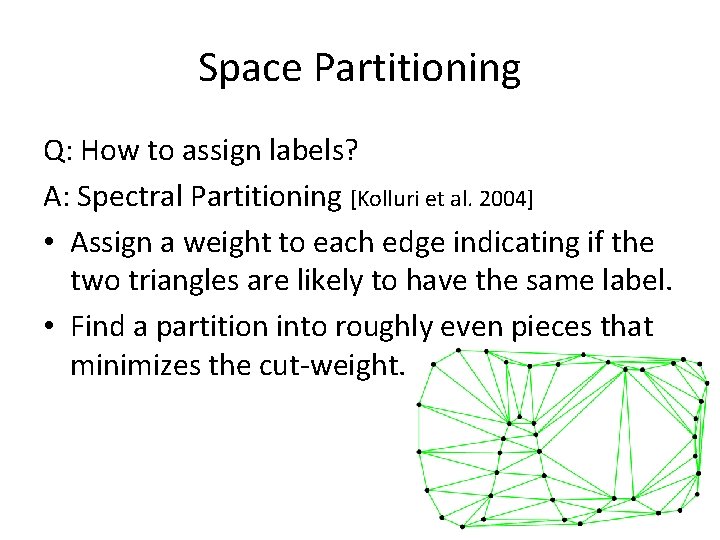
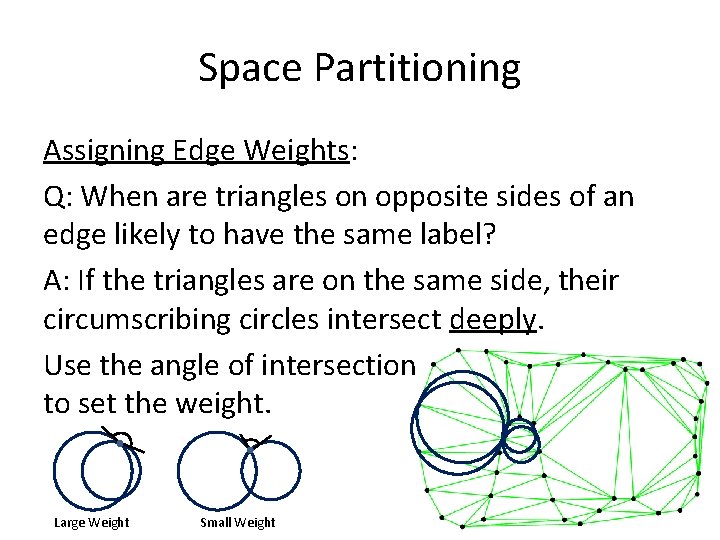
Space Partitioning Q: How to assign labels? A: Spectral Partitioning [Kolluri et al. 2004] • Assign a weight to each edge indicating if the two triangles are likely to have the same label. • Find a partition into roughly even pieces that minimizes the cut-weight.
Space Partitioning Assigning Edge Weights: Q: When are triangles on opposite sides of an edge likely to have the same label? A: If the triangles are on the same side, their circumscribing circles intersect deeply. Use the angle of intersection to set the weight. Large Weight Small Weight
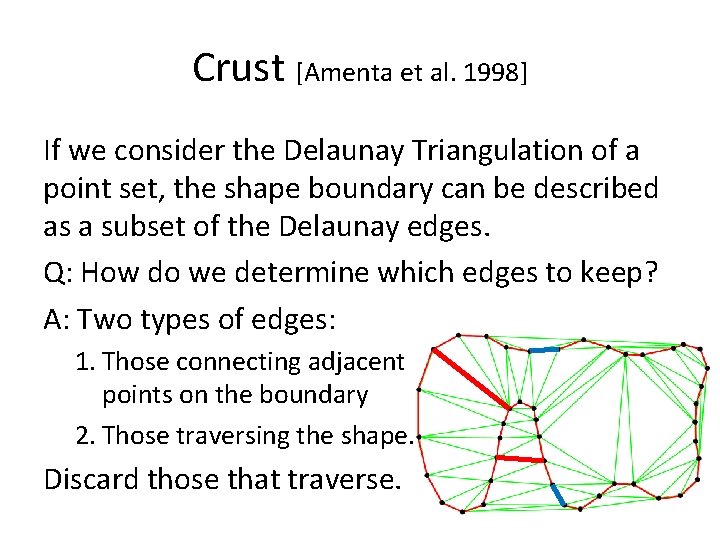
Crust [Amenta et al. 1998] If we consider the Delaunay Triangulation of a point set, the shape boundary can be described as a subset of the Delaunay edges. Q: How do we determine which edges to keep? A: Two types of edges: 1. Those connecting adjacent points on the boundary 2. Those traversing the shape. Discard those that traverse.
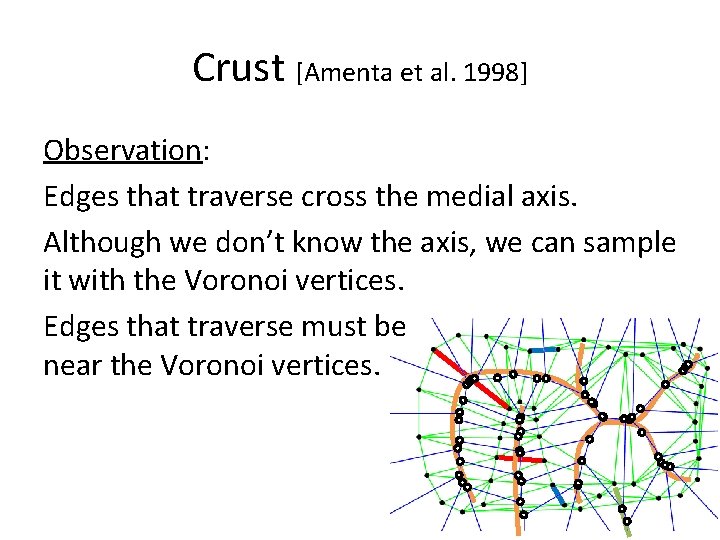
Crust [Amenta et al. 1998] Observation: Edges that traverse cross the medial axis. Although we don’t know the axis, we can sample it with the Voronoi vertices. Edges that traverse must be near the Voronoi vertices.
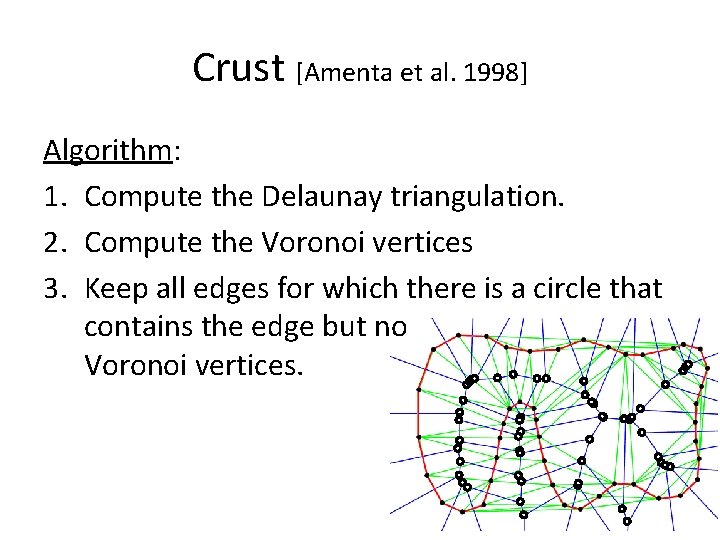
Crust [Amenta et al. 1998] Algorithm: 1. Compute the Delaunay triangulation. 2. Compute the Voronoi vertices 3. Keep all edges for which there is a circle that contains the edge but no Voronoi vertices.
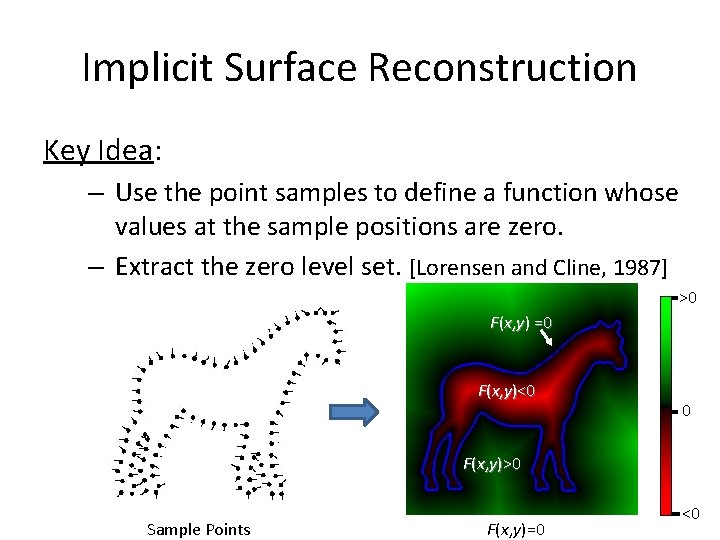
Implicit Surface Reconstruction Key Idea: – Use the point samples to define a function whose values at the sample positions are zero. – Extract the zero level set. [Lorensen and Cline, 1987] >0 F(x, y) =0 F(x, y)<0 0 F(x, y)>0 Sample Points F(x, y)=0 <0
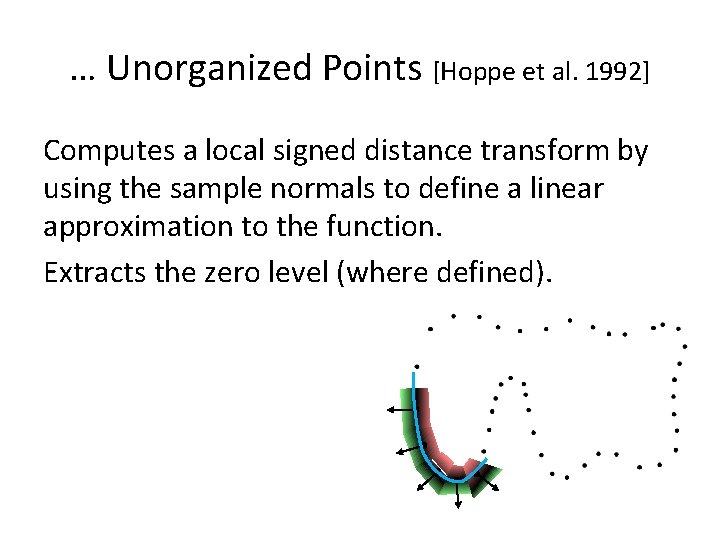
… Unorganized Points [Hoppe et al. 1992] Computes a local signed distance transform by using the sample normals to define a linear approximation to the function. Extracts the zero level (where defined).
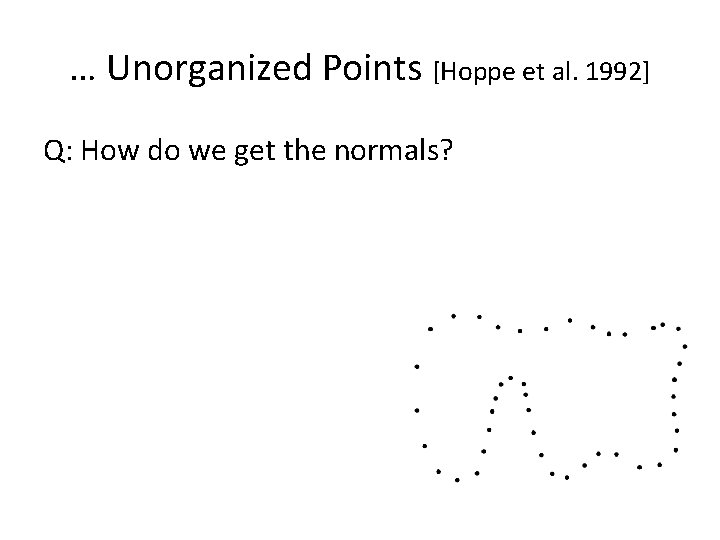
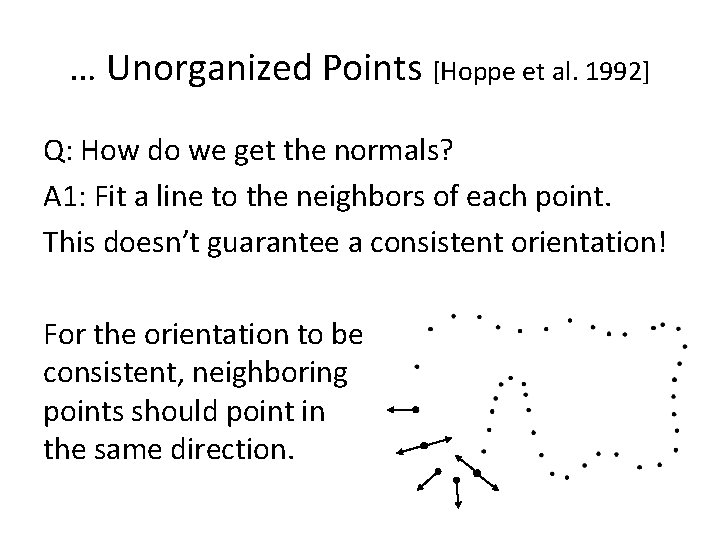
… Unorganized Points [Hoppe et al. 1992] Q: How do we get the normals?
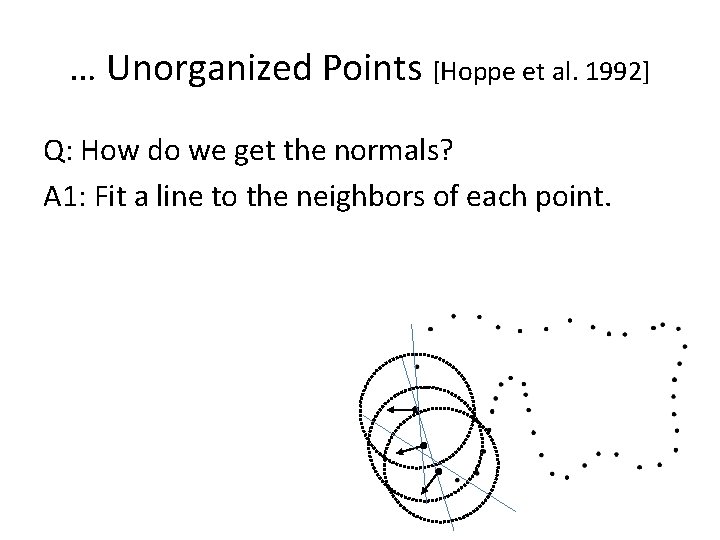
… Unorganized Points [Hoppe et al. 1992] Q: How do we get the normals? A 1: Fit a line to the neighbors of each point.
… Unorganized Points [Hoppe et al. 1992] Q: How do we get the normals? A 1: Fit a line to the neighbors of each point. This doesn’t guarantee a consistent orientation! For the orientation to be consistent, neighboring points should point in the same direction.
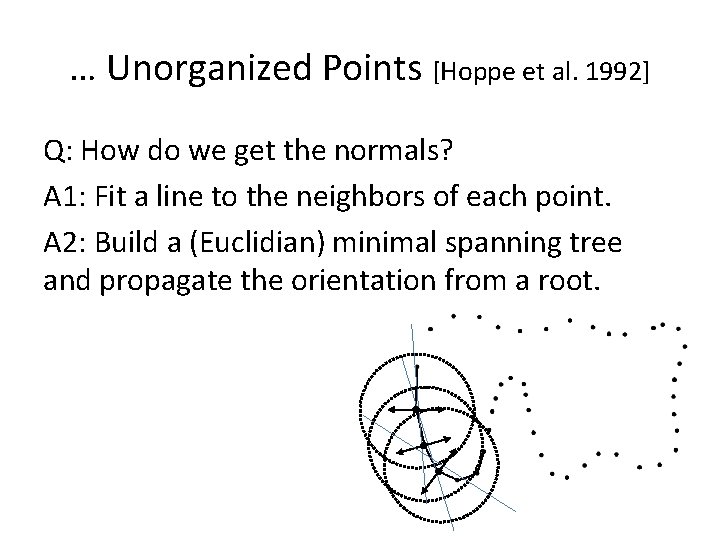
… Unorganized Points [Hoppe et al. 1992] Q: How do we get the normals? A 1: Fit a line to the neighbors of each point. A 2: Build a (Euclidian) minimal spanning tree and propagate the orientation from a root.
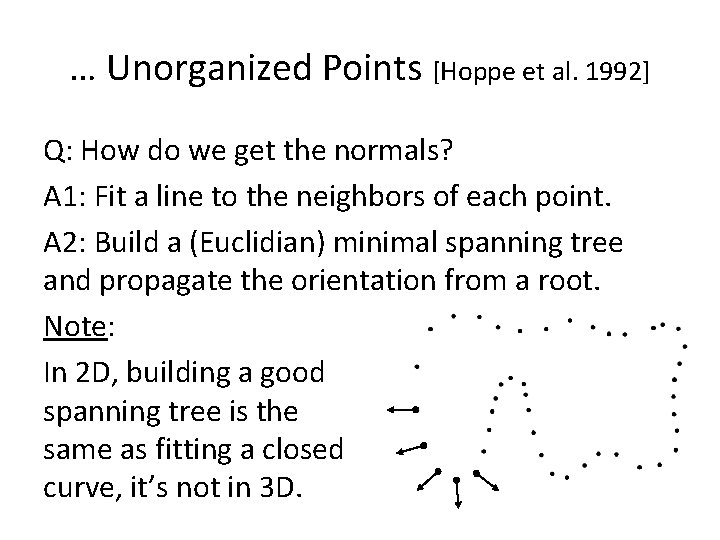
… Unorganized Points [Hoppe et al. 1992] Q: How do we get the normals? A 1: Fit a line to the neighbors of each point. A 2: Build a (Euclidian) minimal spanning tree and propagate the orientation from a root. Note: In 2 D, building a good spanning tree is the same as fitting a closed curve, it’s not in 3 D.
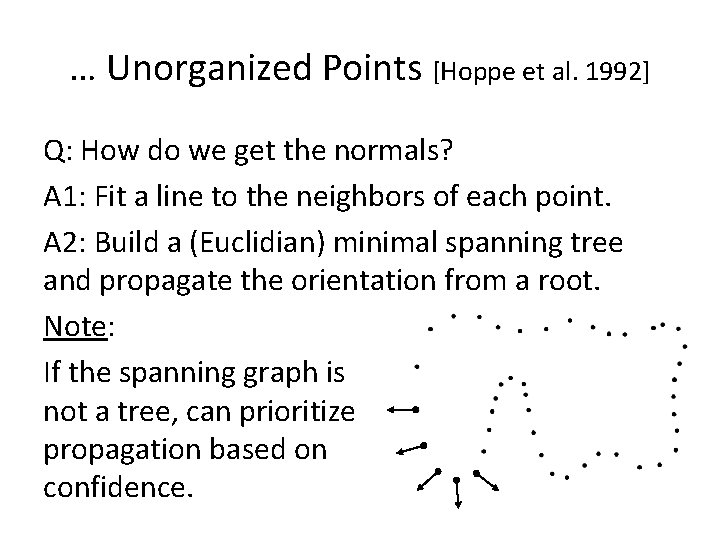
… Unorganized Points [Hoppe et al. 1992] Q: How do we get the normals? A 1: Fit a line to the neighbors of each point. A 2: Build a (Euclidian) minimal spanning tree and propagate the orientation from a root. Note: If the spanning graph is not a tree, can prioritize propagation based on confidence.
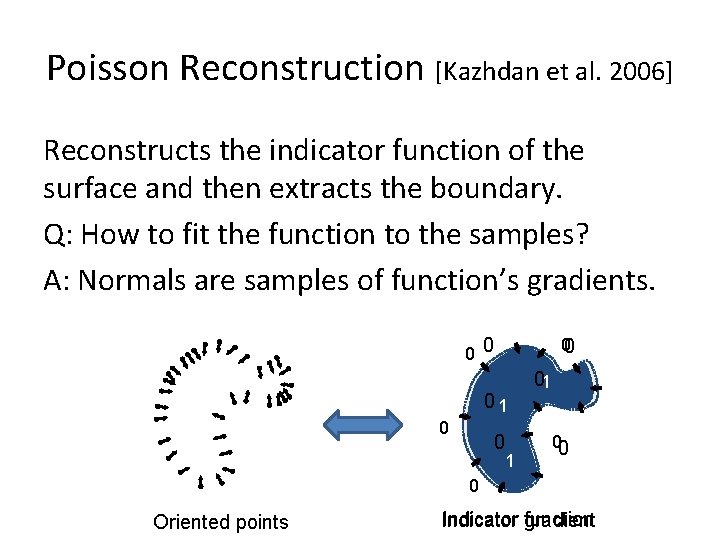
Poisson Reconstruction [Kazhdan et al. 2006] Reconstructs the indicator function of the surface and then extracts the boundary. Q: How to fit the function to the samples? A: Normals are samples of function’s gradients. 0 0 00 01 0 0 1 01 00 0 Oriented points function Indicator gradient
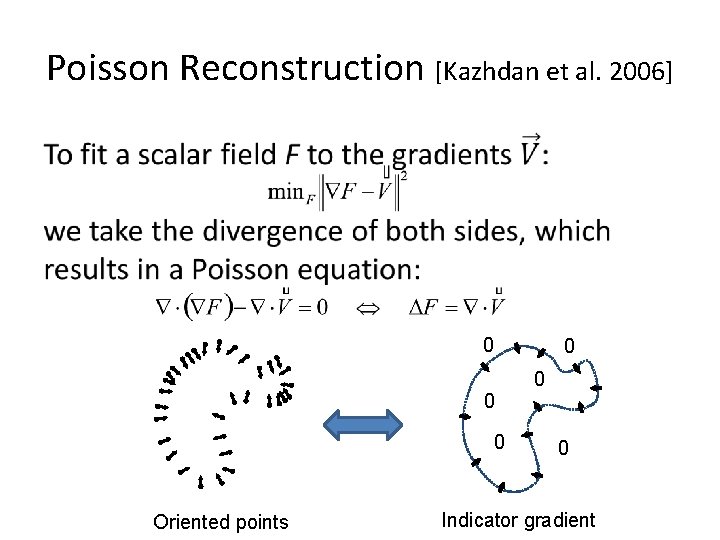
Poisson Reconstruction [Kazhdan et al. 2006] • 0 0 0 Oriented points 0 0 0 Indicator gradient
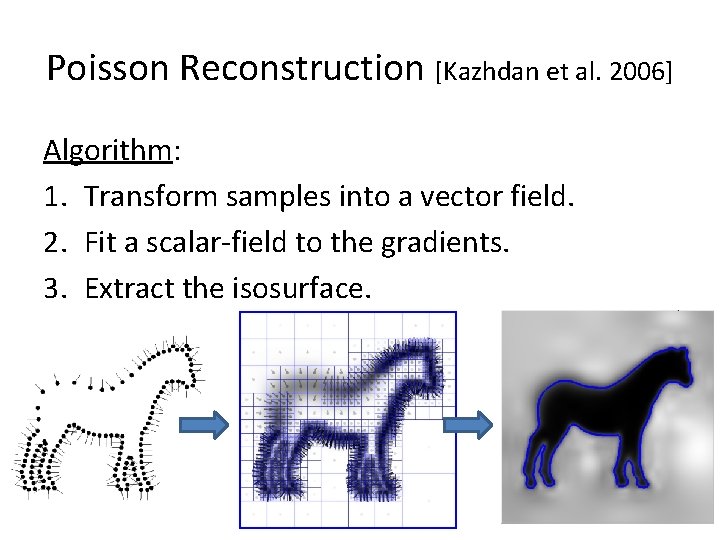
Poisson Reconstruction [Kazhdan et al. 2006] Algorithm: 1. Transform samples into a vector field. 2. Fit a scalar-field to the gradients. 3. Extract the isosurface.
Outline • • Introduction Preliminaries A sampling of methods Why is reconstruction hard?
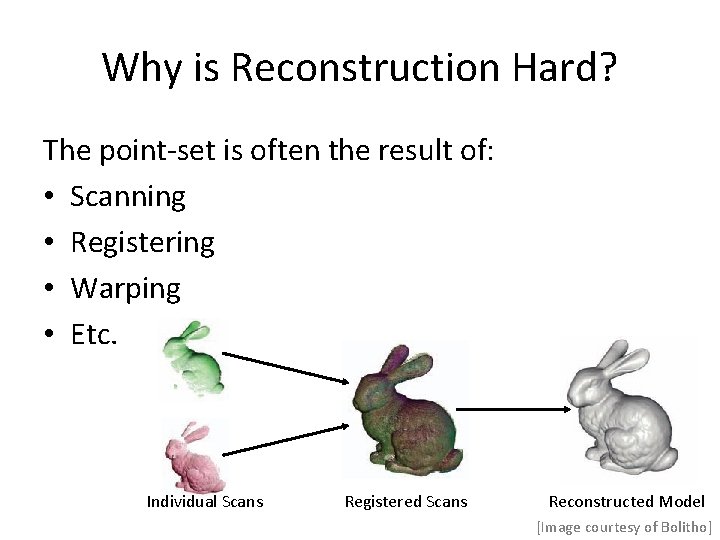
Why is Reconstruction Hard? The point-set is often the result of: • Scanning • Registering • Warping • Etc. Individual Scans Registered Scans Reconstructed Model [Image courtesy of Bolitho]
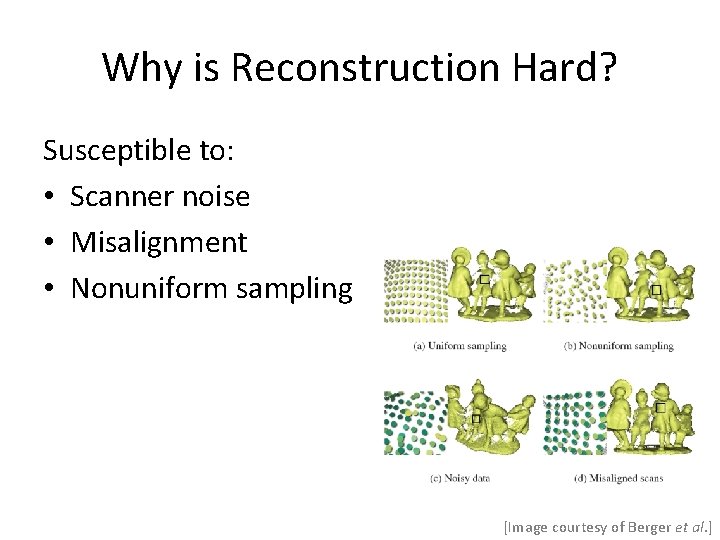
Why is Reconstruction Hard? Susceptible to: • Scanner noise • Misalignment • Nonuniform sampling [Image courtesy of Berger et al. ]
Concerns • • Performance in the presence of bad data Interpolating vs. Approximating Efficiency of reconstruction Quality Guarantees Input constraints Manifoldness Etc.