Surface Plasmons Part 1 Surface plasmons outline 1






- Slides: 64
Surface Plasmons Part 1
Surface plasmons: outline 1. Time-line of major discoveries 2. Surface plasmons - surface mode of electromagnetic waves on a metal surface 3. Spectroscopy of SPs in nanostructures: (a) Nanoparticles (b) Gratings, nanostructures 4. Applications: sensors, nanophotonics, surface enhanced Raman spectroscopy (SERS) Surface plasmons, A. Kolomenski, S. Peng, 9/24/2012
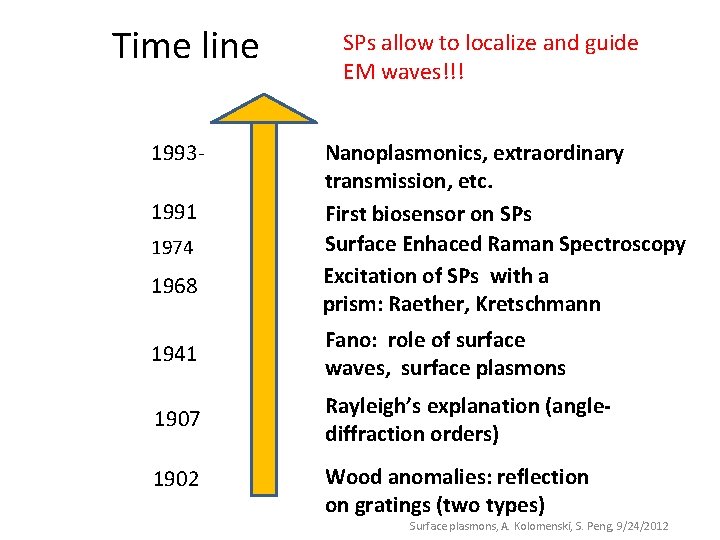
Time line 19931991 1974 1968 SPs allow to localize and guide EM waves!!! Nanoplasmonics, extraordinary transmission, etc. First biosensor on SPs Surface Enhaced Raman Spectroscopy Excitation of SPs with a prism: Raether, Kretschmann 1941 Fano: role of surface waves, surface plasmons 1907 Rayleigh’s explanation (anglediffraction orders) 1902 Wood anomalies: reflection on gratings (two types) Surface plasmons, A. Kolomenski, S. Peng, 9/24/2012
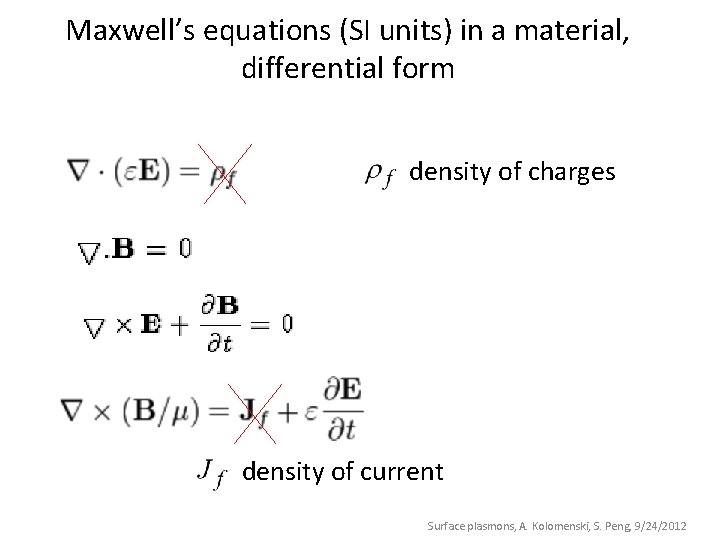
Maxwell’s equations (SI units) in a material, differential form density of charges density of current Surface plasmons, A. Kolomenski, S. Peng, 9/24/2012
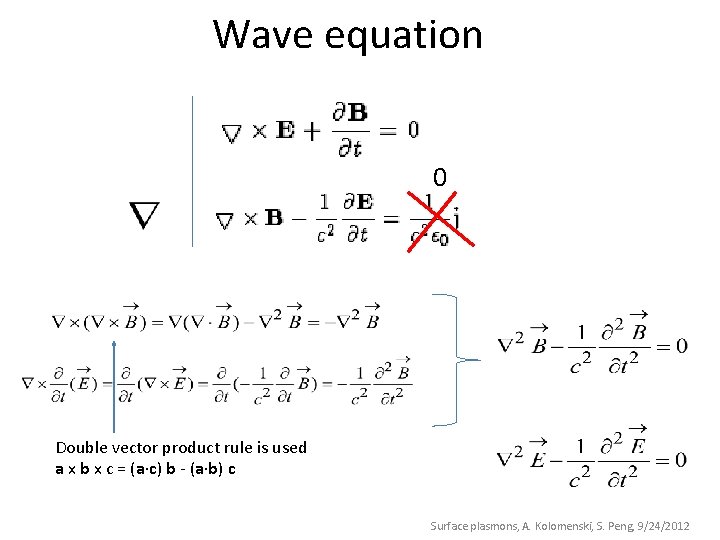
Wave equation 0 Double vector product rule is used a x b x c = (a c) b - (a b) c Surface plasmons, A. Kolomenski, S. Peng, 9/24/2012
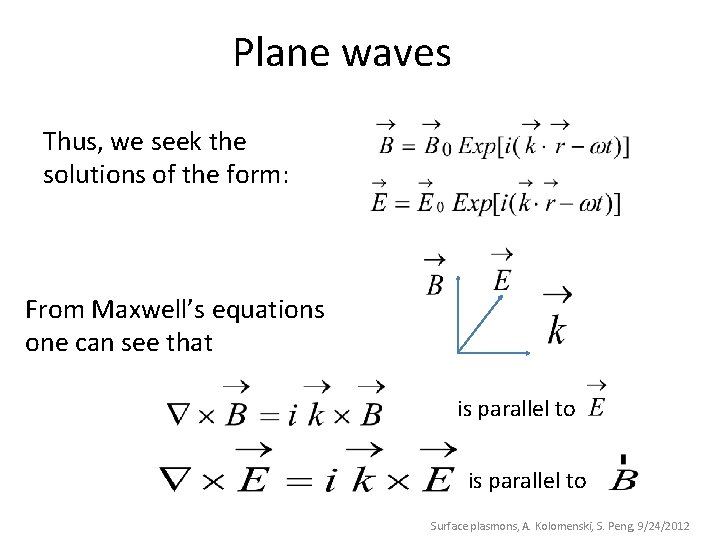
Plane waves Thus, we seek the solutions of the form: From Maxwell’s equations one can see that is parallel to Surface plasmons, A. Kolomenski, S. Peng, 9/24/2012
Simple system of a metal bordering a dielectric with incident plane wave Dielectric, refractive index is dielectric permittivity Incident light Reflected light Transmitted light Metal (gold) Surface plasmons, A. Kolomenski, S. Peng, 9/24/2012
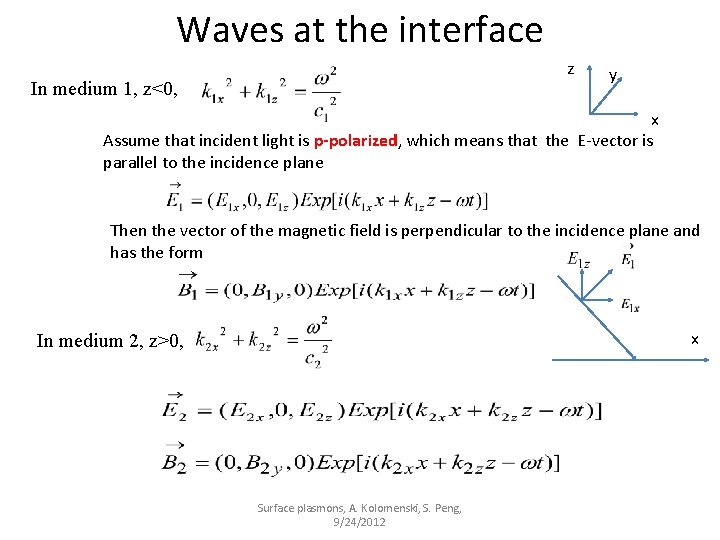
Waves at the interface z In medium 1, z<0, y x Assume that incident light is p-polarized, which means that the E-vector is parallel to the incidence plane Then the vector of the magnetic field is perpendicular to the incidence plane and has the form x In medium 2, z>0, Surface plasmons, A. Kolomenski, S. Peng, 9/24/2012
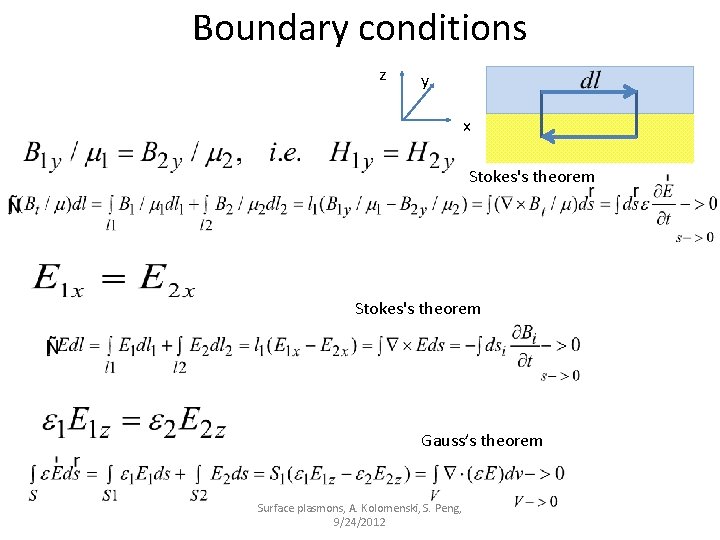
Boundary conditions z y x Stokes's theorem Gauss’s theorem Surface plasmons, A. Kolomenski, S. Peng, 9/24/2012
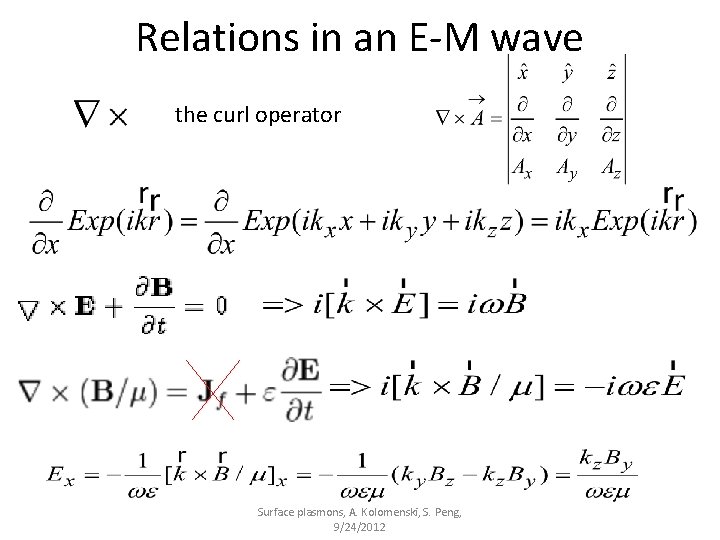
Relations in an E-M wave the curl operator Surface plasmons, A. Kolomenski, S. Peng, 9/24/2012
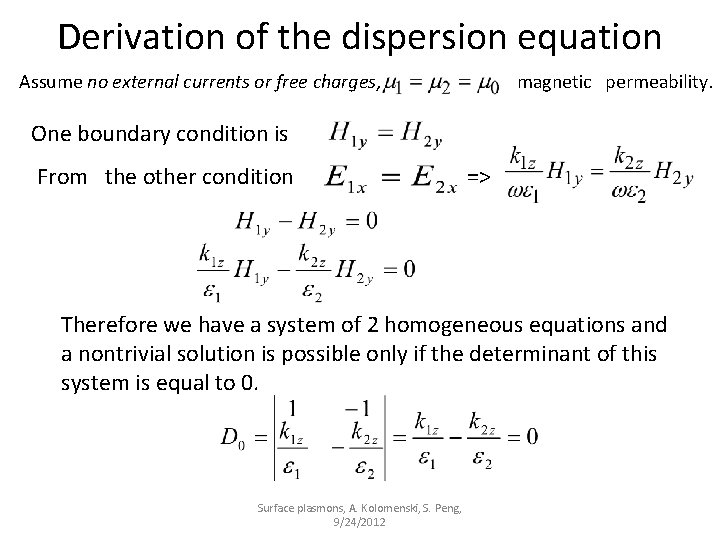
Derivation of the dispersion equation Assume no external currents or free charges, magnetic permeability. One boundary condition is From the other condition => Therefore we have a system of 2 homogeneous equations and a nontrivial solution is possible only if the determinant of this system is equal to 0. Surface plasmons, A. Kolomenski, S. Peng, 9/24/2012
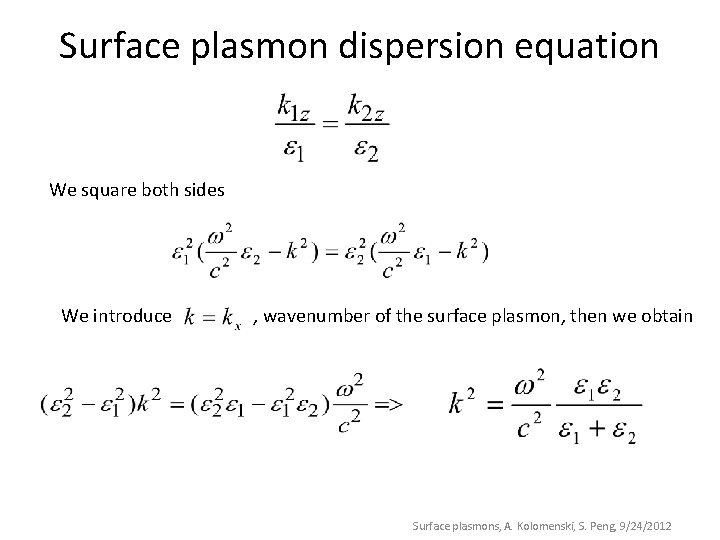
Surface plasmon dispersion equation We square both sides We introduce , wavenumber of the surface plasmon, then we obtain Surface plasmons, A. Kolomenski, S. Peng, 9/24/2012
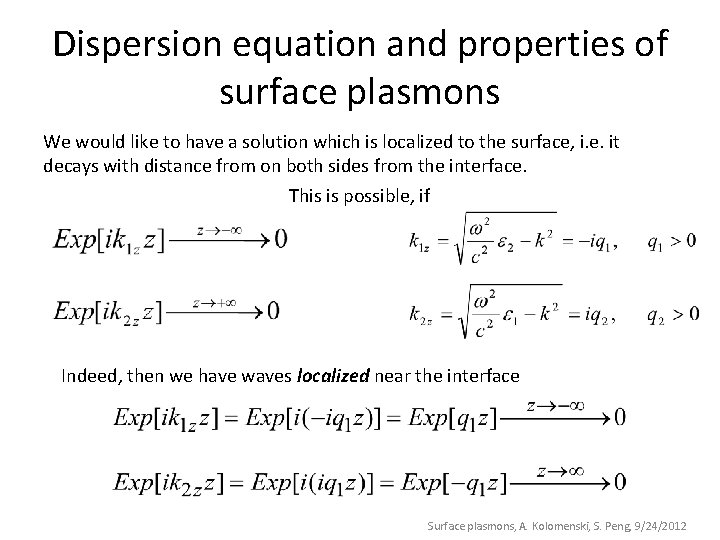
Dispersion equation and properties of surface plasmons We would like to have a solution which is localized to the surface, i. e. it decays with distance from on both sides from the interface. This is possible, if Indeed, then we have waves localized near the interface Surface plasmons, A. Kolomenski, S. Peng, 9/24/2012
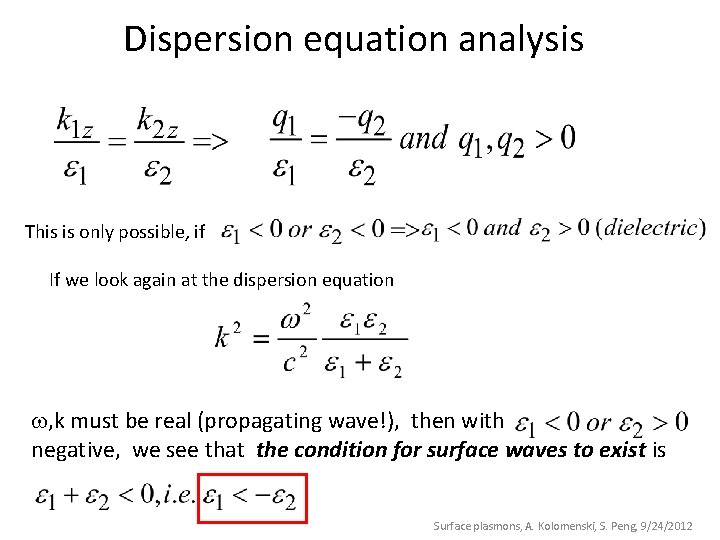
Dispersion equation analysis This is only possible, if If we look again at the dispersion equation , k must be real (propagating wave!), then with negative, we see that the condition for surface waves to exist is Surface plasmons, A. Kolomenski, S. Peng, 9/24/2012
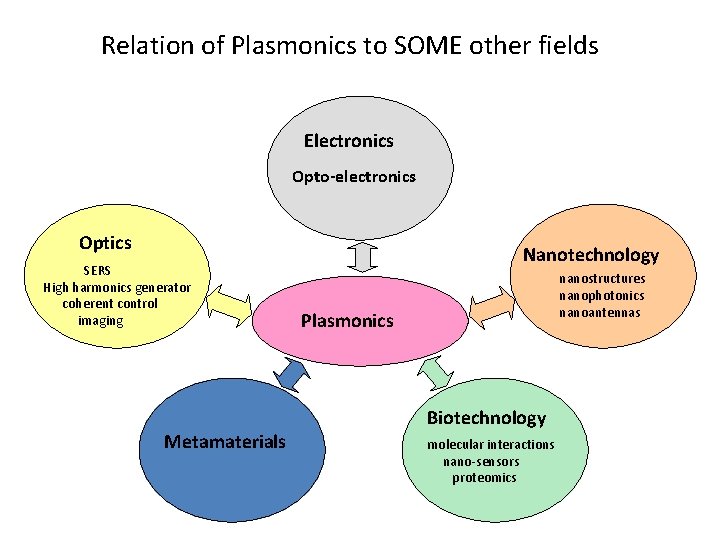
Relation of Plasmonics to SOME other fields Electronics Opto-electronics Optics SERS High harmonics generator coherent control imaging Metamaterials Nanotechnology nanostructures nanophotonics nanoantennas Plasmonics Biotechnology molecular interactions nano-sensors proteomics
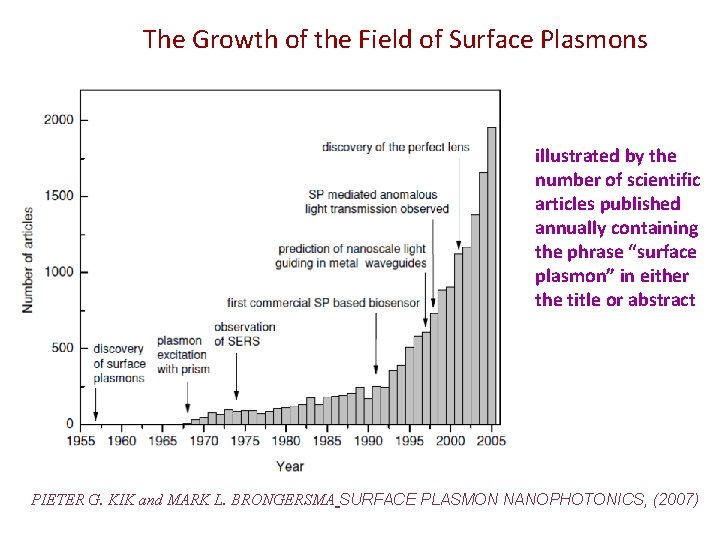
The Growth of the Field of Surface Plasmons illustrated by the number of scientific articles published annually containing the phrase “surface plasmon” in either the title or abstract PIETER G. KIK and MARK L. BRONGERSMA SURFACE PLASMON NANOPHOTONICS, (2007)
Surface plasmons (or surface plasmon polaritons), Part 2: outline 1. Why SP named so? 2. Excitation of SPs: with a prism or a grating 3. Spectroscopy of SPs in nanostructures: (a) Nanoparticles (b) Gratings, nanostructures 4. Applications: sensors, nanophotonics, surface enhanced Raman spectroscopy (SERS) Surface Plasmons, Part 2, A. Kolomenski, 9/26/2012
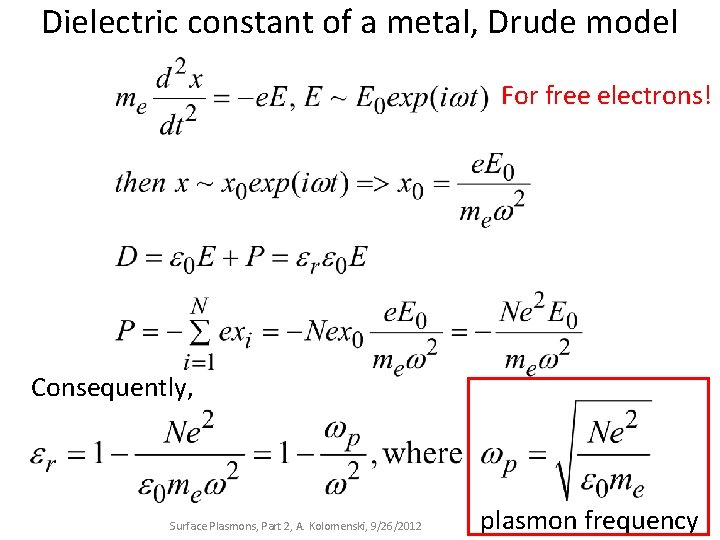
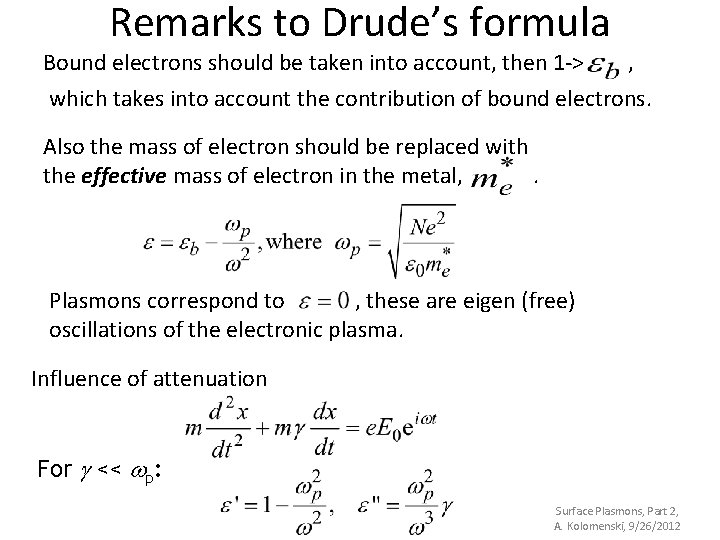
Dielectric constant of a metal, Drude model For free electrons! Consequently, Surface Plasmons, Part 2, A. Kolomenski, 9/26/2012 plasmon frequency
Remarks to Drude’s formula Bound electrons should be taken into account, then 1 -> , which takes into account the contribution of bound electrons. Also the mass of electron should be replaced with the effective mass of electron in the metal, . Plasmons correspond to , these are eigen (free) oscillations of the electronic plasma. Influence of attenuation For g << wp: Surface Plasmons, Part 2, A. Kolomenski, 9/26/2012
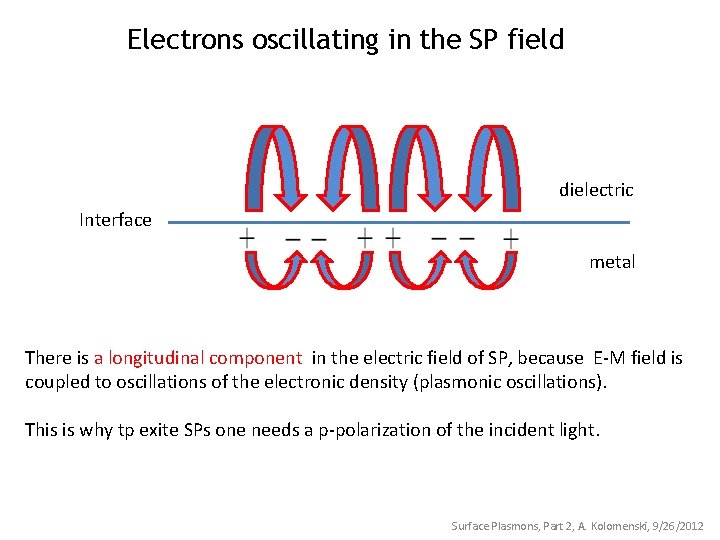
Electrons oscillating in the SP field dielectric Interface metal There is a longitudinal component in the electric field of SP, because E-M field is coupled to oscillations of the electronic density (plasmonic oscillations). This is why tp exite SPs one needs a p-polarization of the incident light. Surface Plasmons, Part 2, A. Kolomenski, 9/26/2012
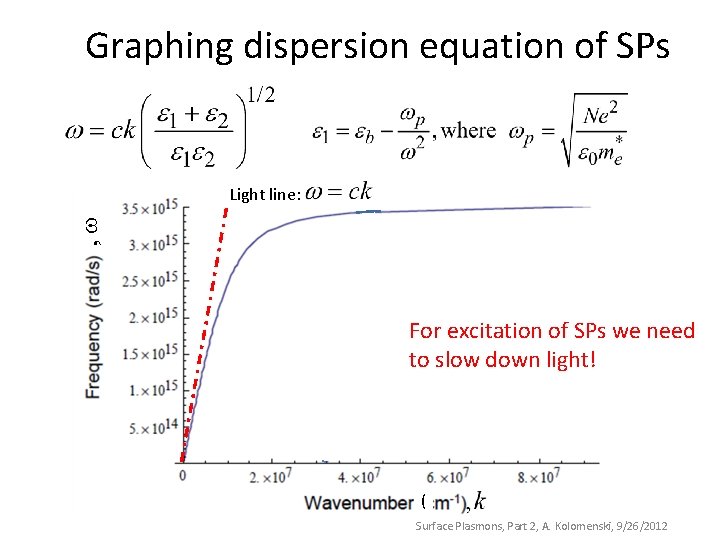
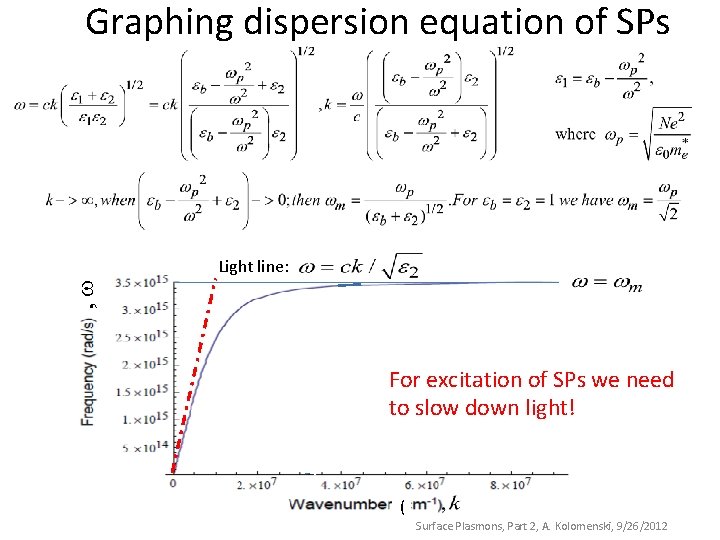
Graphing dispersion equation of SPs , Light line: For excitation of SPs we need to slow down light! ( Surface Plasmons, Part 2, A. Kolomenski, 9/26/2012
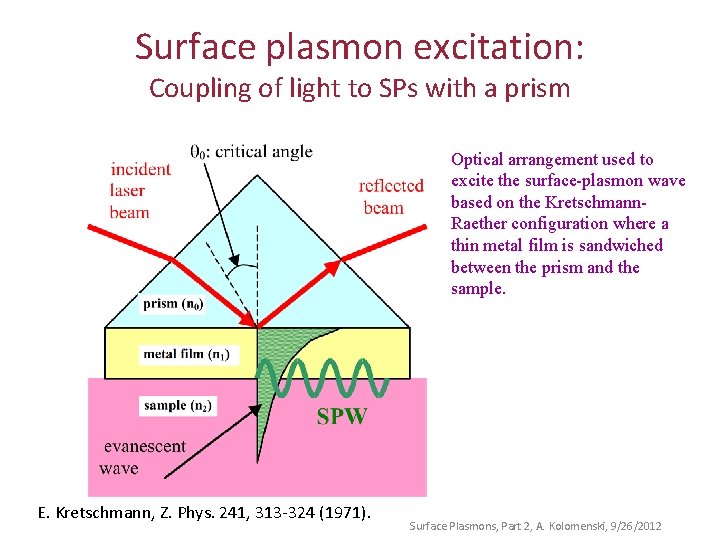
Surface plasmon excitation: Coupling of light to SPs with a prism Optical arrangement used to excite the surface-plasmon wave based on the Kretschmann. Raether configuration where a thin metal film is sandwiched between the prism and the sample. E. Kretschmann, Z. Phys. 241, 313 -324 (1971). Surface Plasmons, Part 2, A. Kolomenski, 9/26/2012
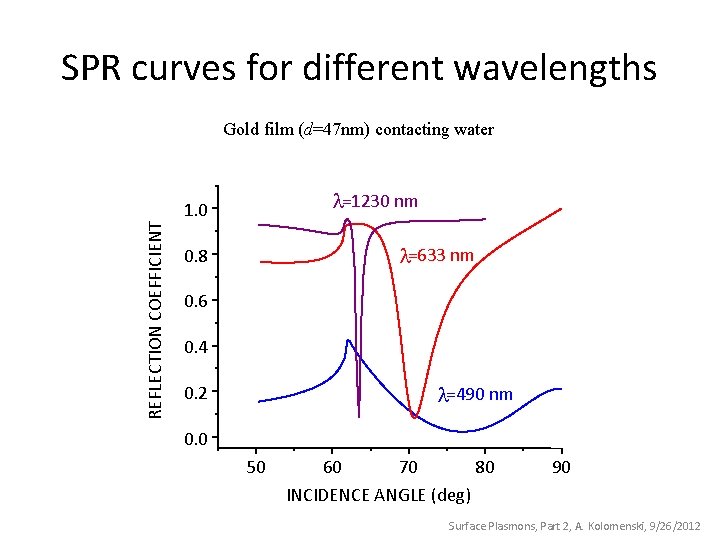
SPR curves for different wavelengths Gold film (d=47 nm) contacting water =1230 nm REFLECTION COEFFICIENT 1. 0 =633 nm 0. 8 0. 6 0. 4 =490 nm 0. 2 0. 0 50 60 70 80 INCIDENCE ANGLE (deg) 90 Surface Plasmons, Part 2, A. Kolomenski, 9/26/2012
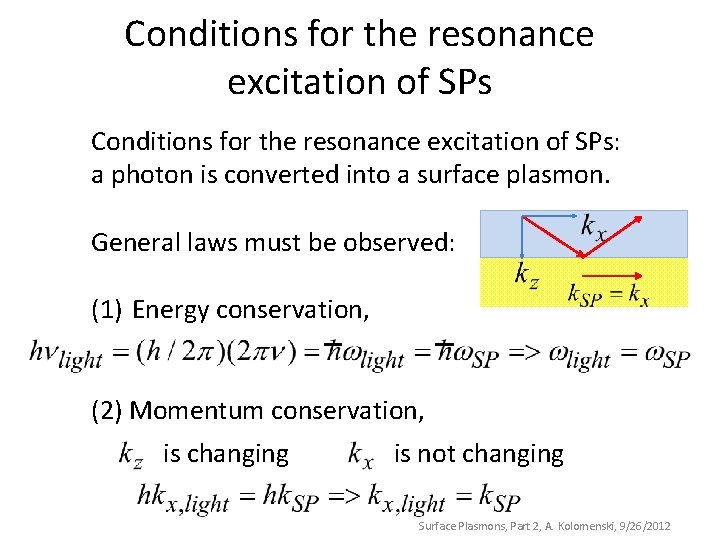
Conditions for the resonance excitation of SPs: a photon is converted into a surface plasmon. General laws must be observed: (1) Energy conservation, (2) Momentum conservation, is changing is not changing Surface Plasmons, Part 2, A. Kolomenski, 9/26/2012
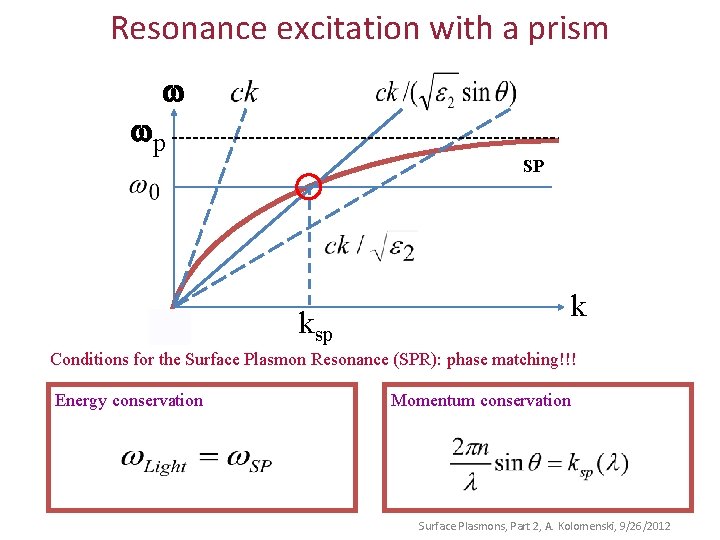
Resonance excitation with a prism w wp SP ksp k Conditions for the Surface Plasmon Resonance (SPR): phase matching!!! Energy conservation Momentum conservation Surface Plasmons, Part 2, A. Kolomenski, 9/26/2012
Questions?
Surface Plasmon Part 3
Graphing dispersion equation of SPs , Light line: For excitation of SPs we need to slow down light! ( Surface Plasmons, Part 2, A. Kolomenski, 9/26/2012
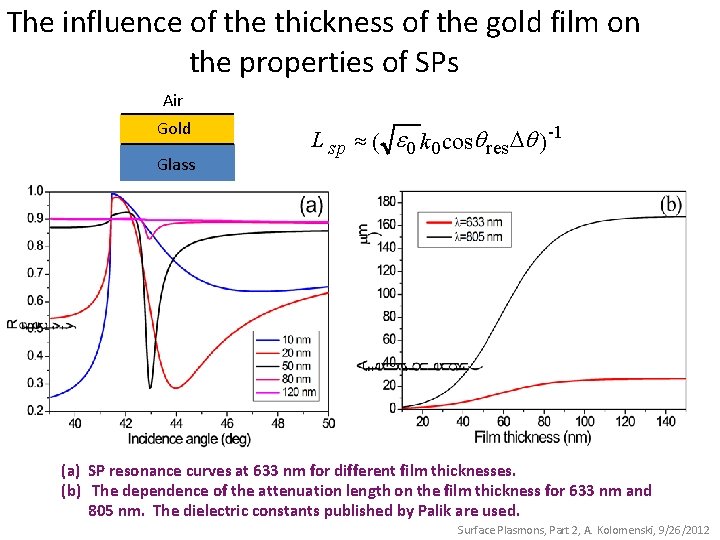
The influence of the thickness of the gold film on the properties of SPs Air Gold Glass L sp » ( e 0 k 0 cosq res Dq ) -1 (a) SP resonance curves at 633 nm for different film thicknesses. (b) The dependence of the attenuation length on the film thickness for 633 nm and 805 nm. The dielectric constants published by Palik are used. Surface Plasmons, Part 2, A. Kolomenski, 9/26/2012
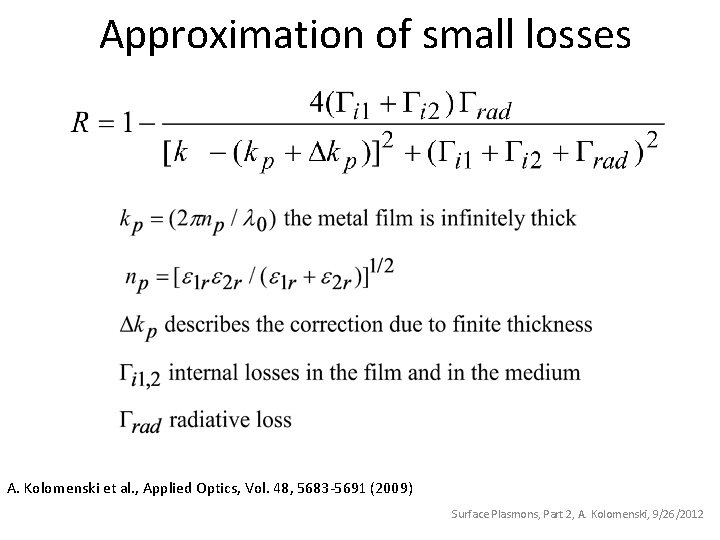
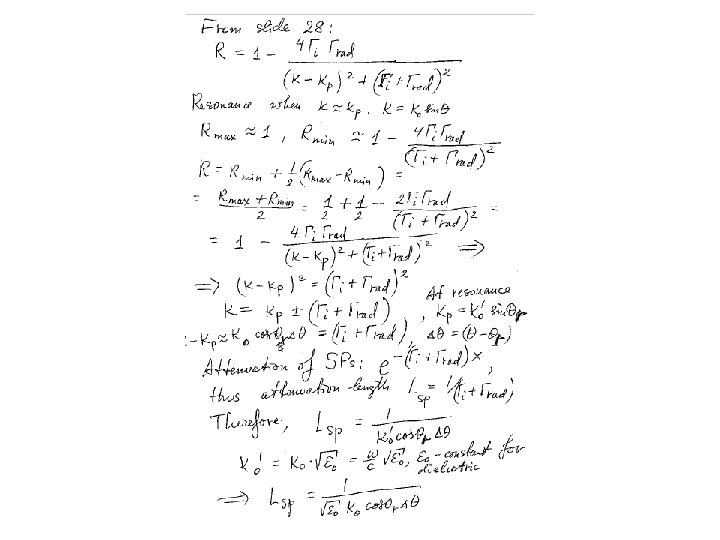
Approximation of small losses A. Kolomenski et al. , Applied Optics, Vol. 48, 5683 -5691 (2009) Surface Plasmons, Part 2, A. Kolomenski, 9/26/2012
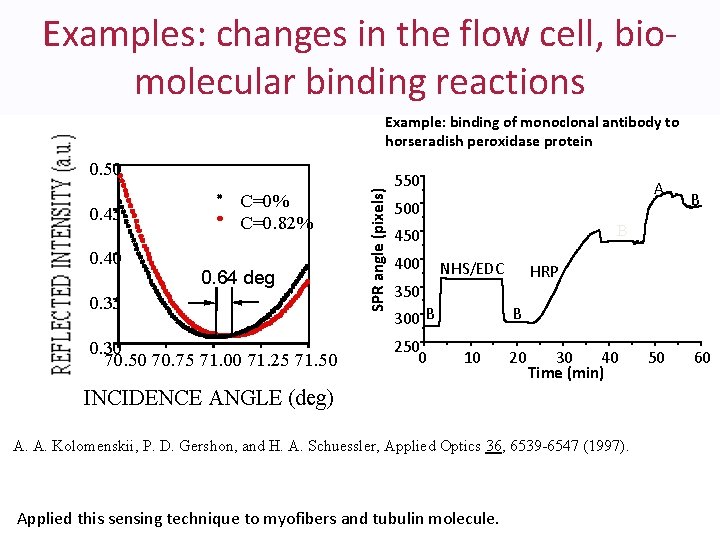
Examples: changes in the flow cell, biomolecular binding reactions Example: binding of monoclonal antibody to horseradish peroxidase protein 0. 45 0. 40 C=0% C=0. 82% 0. 64 deg 0. 35 0. 30 70. 50 70. 75 71. 00 71. 25 71. 50 SPR angle (pixels) 0. 50 550 A 500 B 450 400 NHS/EDC HRP 350 300 B 250 0 B B 10 20 30 40 Time (min) INCIDENCE ANGLE (deg) A. A. Kolomenskii, P. D. Gershon, and H. A. Schuessler, Applied Optics 36, 6539 -6547 (1997). Applied this sensing technique to myofibers and tubulin molecule. 50 60
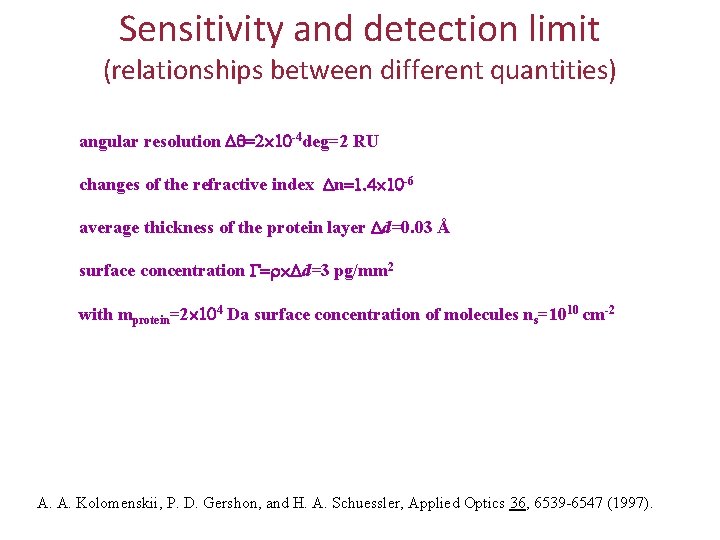
Sensitivity and detection limit (relationships between different quantities) angular resolution -4 deg=2 RU changes of the refractive index n -6 average thickness of the protein layer d=0. 03 Å surface concentration d=3 pg/mm 2 with mprotein=2 4 Da surface concentration of molecules ns=1010 cm-2 A. A. Kolomenskii, P. D. Gershon, and H. A. Schuessler, Applied Optics 36, 6539 -6547 (1997).
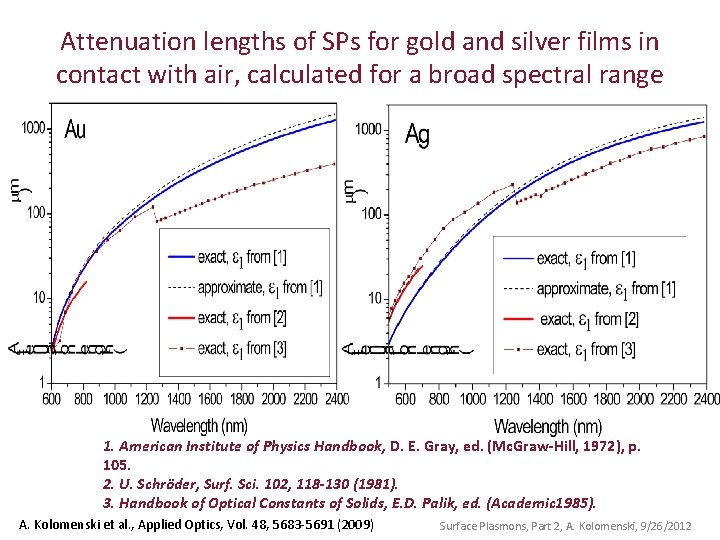
Attenuation lengths of SPs for gold and silver films in contact with air, calculated for a broad spectral range 1. American Institute of Physics Handbook, D. E. Gray, ed. (Mc. Graw-Hill, 1972), p. 105. 2. U. Schröder, Surf. Sci. 102, 118 -130 (1981). 3. Handbook of Optical Constants of Solids, E. D. Palik, ed. (Academic 1985). A. Kolomenski et al. , Applied Optics, Vol. 48, 5683 -5691 (2009) Surface Plasmons, Part 2, A. Kolomenski, 9/26/2012
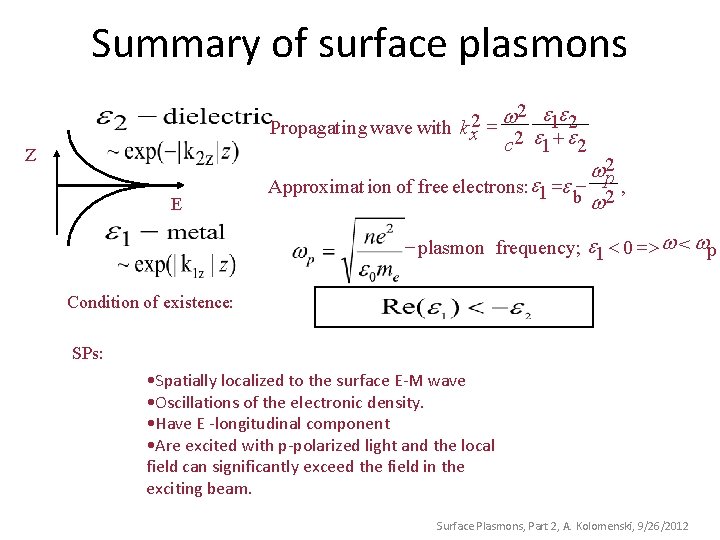
Summary of surface plasmons 2 ee w 2 Propagatin g wave with k x = 2 1 2 c e 1 + e 2 Z E w 2 p Approximat ion of free electrons: e 1 =e - 2 , b w - plasmon frequency; e 1 < 0 => w < wp Condition of existence: SPs: • Spatially localized to the surface E-M wave • Oscillations of the electronic density. • Have E -longitudinal component • Are excited with p-polarized light and the local field can significantly exceed the field in the exciting beam. Surface Plasmons, Part 2, A. Kolomenski, 9/26/2012
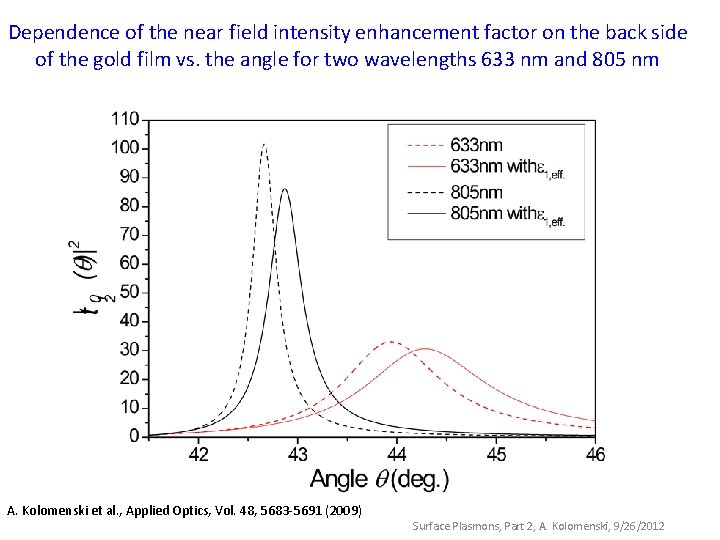
Dependence of the near field intensity enhancement factor on the back side of the gold film vs. the angle for two wavelengths 633 nm and 805 nm A. Kolomenski et al. , Applied Optics, Vol. 48, 5683 -5691 (2009) Surface Plasmons, Part 2, A. Kolomenski, 9/26/2012
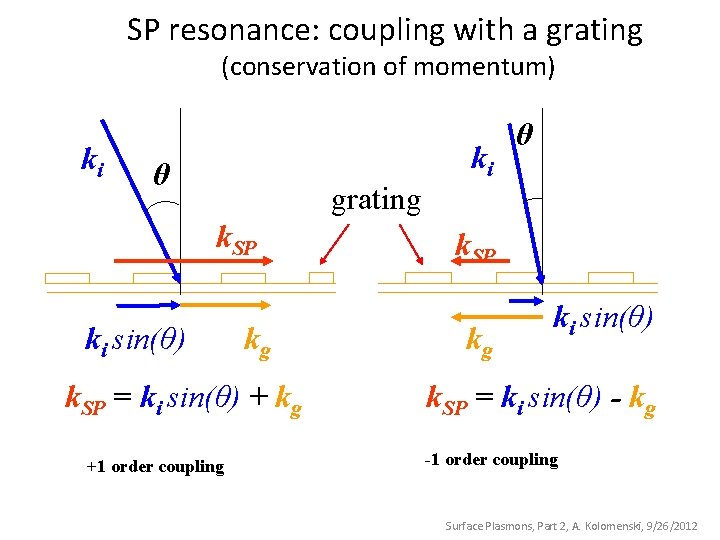
SP resonance: coupling with a grating (conservation of momentum) ki θ grating k. SP ki sin(θ) kg k. SP = ki sin(θ) + kg +1 order coupling ki θ k. SP kg ki sin(θ) k. SP = ki sin(θ) - kg -1 order coupling Surface Plasmons, Part 2, A. Kolomenski, 9/26/2012
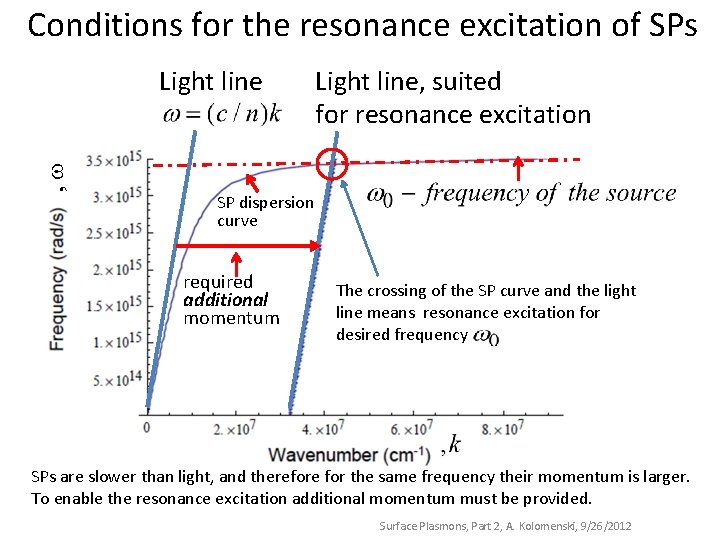
Conditions for the resonance excitation of SPs , Light line, suited for resonance excitation SP dispersion curve required additional momentum The crossing of the SP curve and the light line means resonance excitation for desired frequency SPs are slower than light, and therefore for the same frequency their momentum is larger. To enable the resonance excitation additional momentum must be provided. Surface Plasmons, Part 2, A. Kolomenski, 9/26/2012
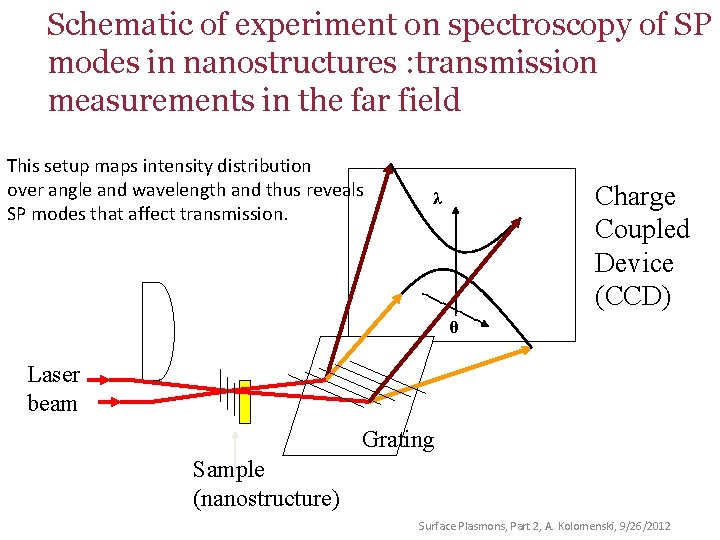
Schematic of experiment on spectroscopy of SP modes in nanostructures : transmission measurements in the far field This setup maps intensity distribution over angle and wavelength and thus reveals SP modes that affect transmission. λ Charge Coupled Device (CCD) θ Laser beam Grating Sample (nanostructure) Surface Plasmons, Part 2, A. Kolomenski, 9/26/2012
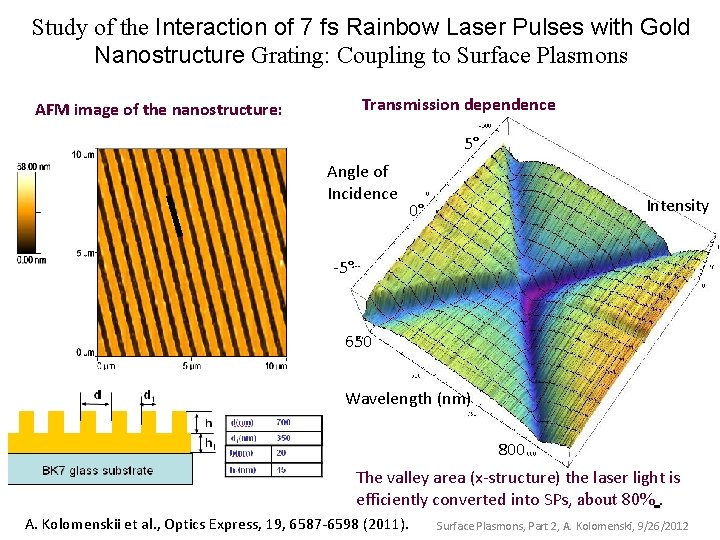
Study of the Interaction of 7 fs Rainbow Laser Pulses with Gold Nanostructure Grating: Coupling to Surface Plasmons Transmission dependence AFM image of the nanostructure: 5° Angle of Incidence Intensity 0° -5° 650 Wavelength (nm) 800 The valley area (x-structure) the laser light is efficiently converted into SPs, about 80%. A. Kolomenskii et al. , Optics Express, 19, 6587 -6598 (2011). Surface Plasmons, Part 2, A. Kolomenski, 9/26/2012
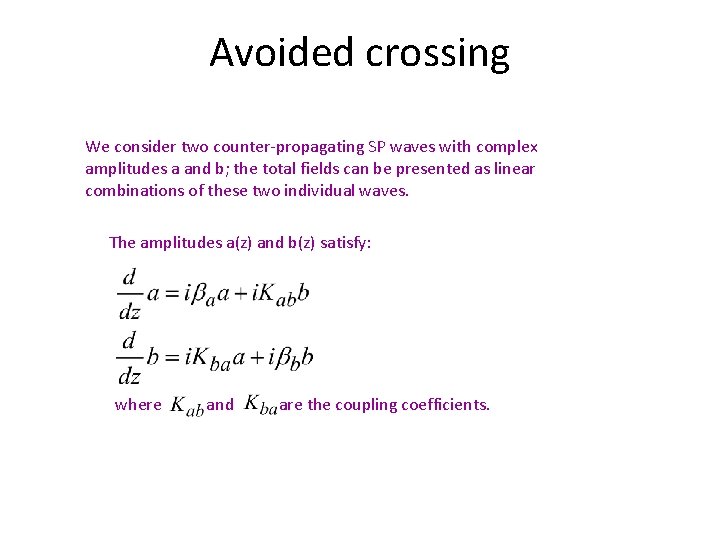
Avoided crossing We consider two counter-propagating SP waves with complex amplitudes a and b; the total fields can be presented as linear combinations of these two individual waves. The amplitudes a(z) and b(z) satisfy: where and are the coupling coefficients.
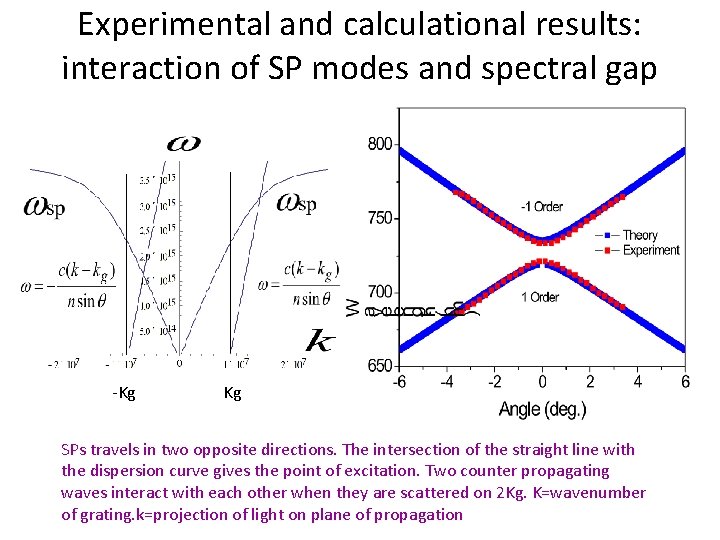
Experimental and calculational results: interaction of SP modes and spectral gap k Kg -Kg Kg SPs travels in two opposite directions. The intersection of the straight line with the dispersion curve gives the point of excitation. Two counter propagating waves interact with each other when they are scattered on 2 Kg. K=wavenumber of grating. k=projection of light on plane of propagation
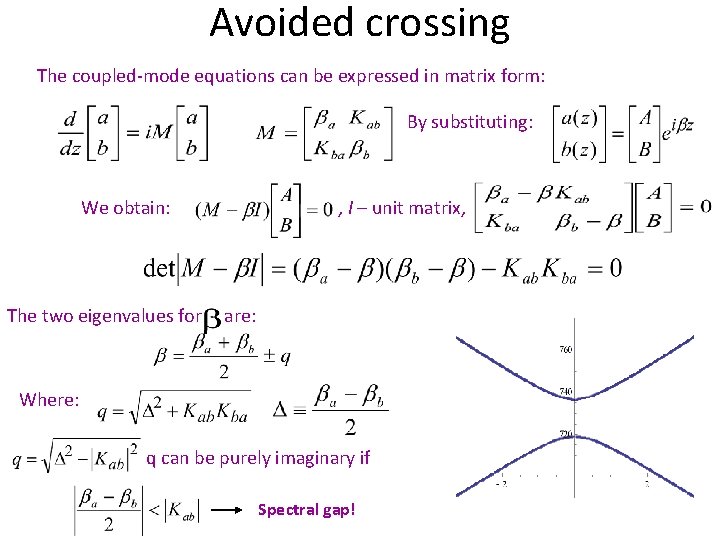
Avoided crossing The coupled-mode equations can be expressed in matrix form: By substituting: We obtain: , I – unit matrix, The two eigenvalues for are: Where: q can be purely imaginary if Spectral gap!
Questions?
Surface Plasmons Part 4
Optical detection of acoustic waves with surface plasmons
Abstract For fast and sensitive detection of acoustic waves the surface plasmon resonance (SPR) can be used, which responds to variations of dielectric properties in close proximity to a metal film supporting surface plasmon waves. When an acoustic wave is incident onto a receiving plate positioned within the penetration depth of the surface plasmons, it creates displacements of the surface of the plate and thus modulates the dielectric properties, affecting SPR and the reflection of the incident light. Here we study characteristics and determine the optimal configuration of such an acousto-optical transducer with surface plasmons for efficient conversion of an acoustic signal into an optical one. We simulate the properties of the transducer and present estimates showing that it can have a large frequency bandwidth and good sensitivity.
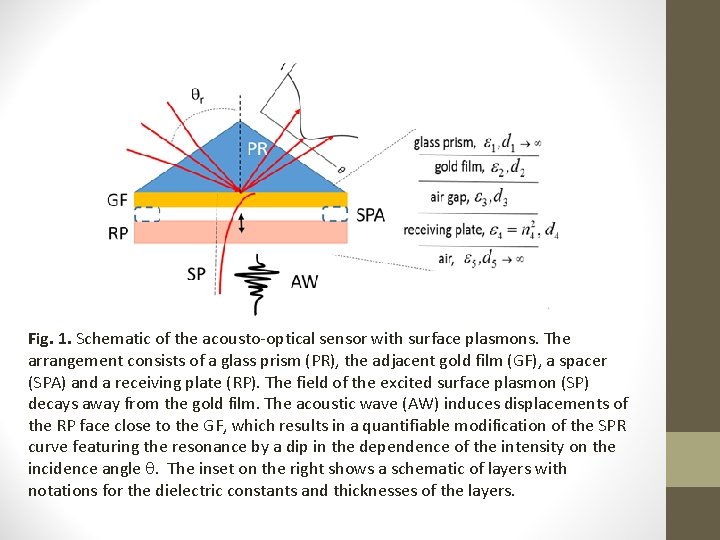
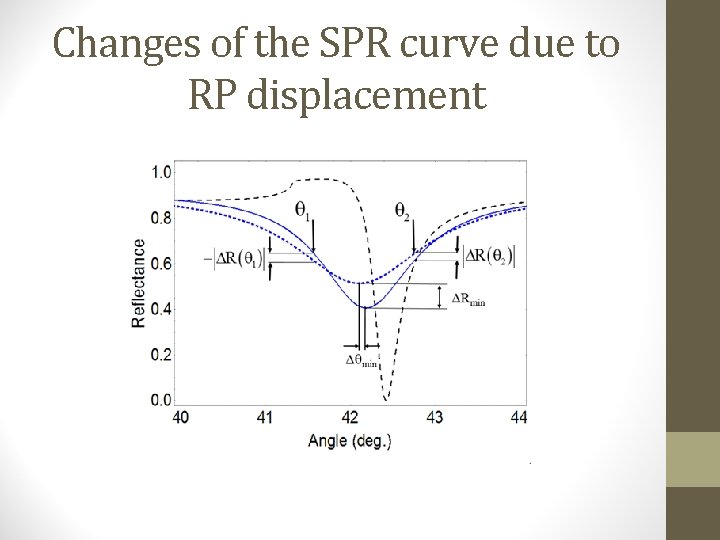
Fig. 1. Schematic of the acousto-optical sensor with surface plasmons. The arrangement consists of a glass prism (PR), the adjacent gold film (GF), a spacer (SPA) and a receiving plate (RP). The field of the excited surface plasmon (SP) decays away from the gold film. The acoustic wave (AW) induces displacements of the RP face close to the GF, which results in a quantifiable modification of the SPR curve featuring the resonance by a dip in the dependence of the intensity on the incidence angle . The inset on the right shows a schematic of layers with notations for the dielectric constants and thicknesses of the layers.
Changes of the SPR curve due to RP displacement
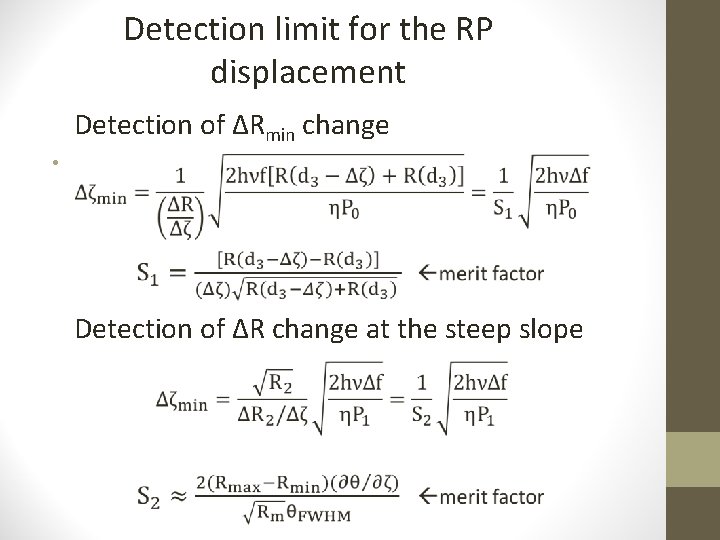
Detection limit for the RP displacement Detection of ΔRmin change • Detection of ΔR change at the steep slope
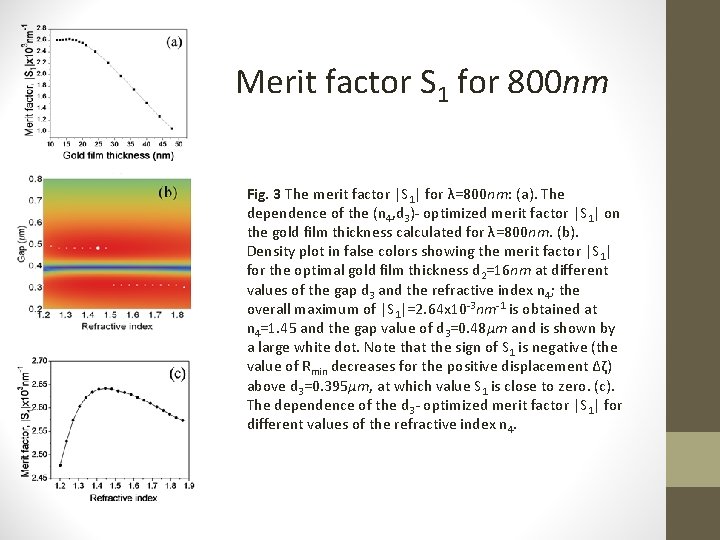
Merit factor S 1 for 800 nm Fig. 3 The merit factor |S 1| for λ=800 nm: (a). The dependence of the (n 4, d 3)- optimized merit factor |S 1| on the gold film thickness calculated for λ=800 nm. (b). Density plot in false colors showing the merit factor |S 1| for the optimal gold film thickness d 2=16 nm at different values of the gap d 3 and the refractive index n 4; the overall maximum of |S 1|=2. 64 x 10 -3 nm-1 is obtained at n 4=1. 45 and the gap value of d 3=0. 48μm and is shown by a large white dot. Note that the sign of S 1 is negative (the value of Rmin decreases for the positive displacement Δζ) above d 3=0. 395μm, at which value S 1 is close to zero. (c). The dependence of the d 3 - optimized merit factor |S 1| for different values of the refractive index n 4.
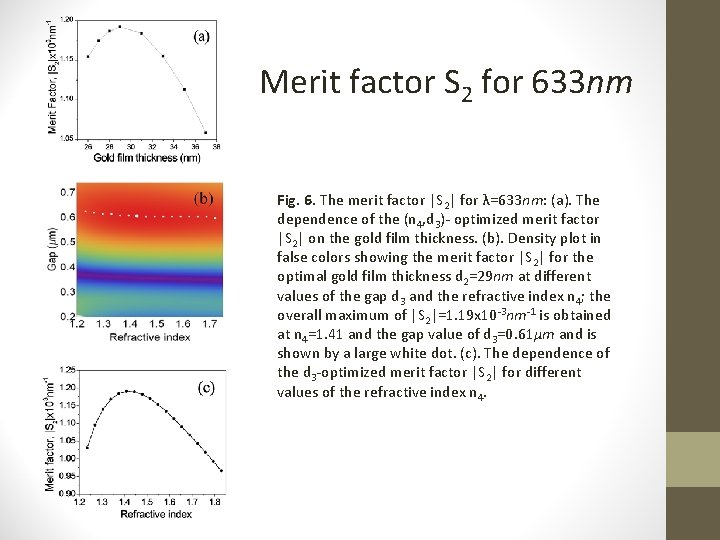
Merit factor S 2 for 633 nm Fig. 6. The merit factor |S 2| for λ=633 nm: (a). The dependence of the (n 4, d 3)- optimized merit factor |S 2| on the gold film thickness. (b). Density plot in false colors showing the merit factor |S 2| for the optimal gold film thickness d 2=29 nm at different values of the gap d 3 and the refractive index n 4; the overall maximum of |S 2|=1. 19 x 10 -3 nm-1 is obtained at n 4=1. 41 and the gap value of d 3=0. 61μm and is shown by a large white dot. (c). The dependence of the d 3 -optimized merit factor |S 2| for different values of the refractive index n 4.
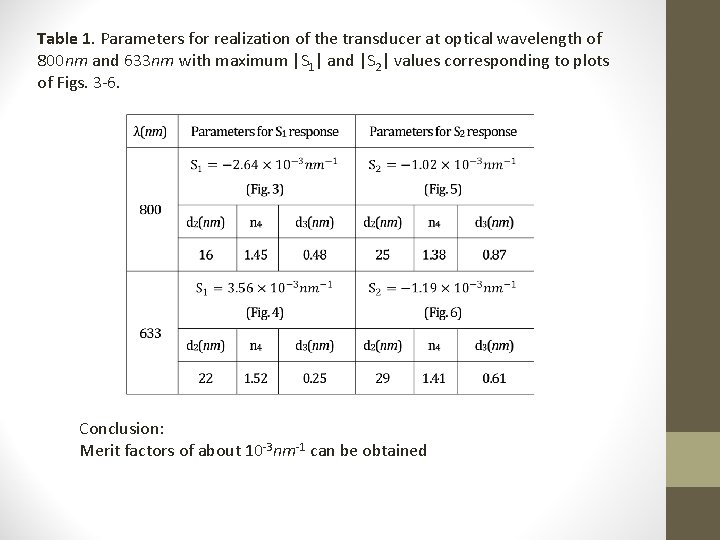
Table 1. Parameters for realization of the transducer at optical wavelength of 800 nm and 633 nm with maximum |S 1| and |S 2| values corresponding to plots of Figs. 3 -6. Conclusion: Merit factors of about 10 -3 nm-1 can be obtained
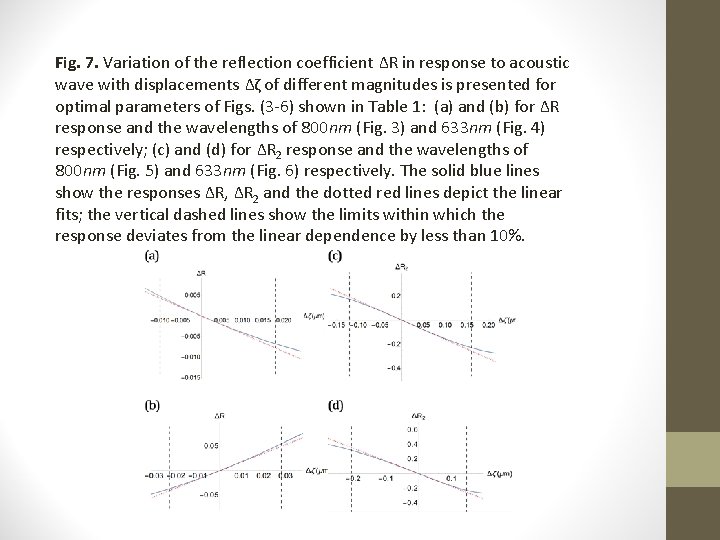
Fig. 7. Variation of the reflection coefficient ΔR in response to acoustic wave with displacements Δζ of different magnitudes is presented for optimal parameters of Figs. (3 -6) shown in Table 1: (a) and (b) for ΔR response and the wavelengths of 800 nm (Fig. 3) and 633 nm (Fig. 4) respectively; (c) and (d) for ΔR 2 response and the wavelengths of 800 nm (Fig. 5) and 633 nm (Fig. 6) respectively. The solid blue lines show the responses ΔR, ΔR 2 and the dotted red lines depict the linear fits; the vertical dashed lines show the limits within which the response deviates from the linear dependence by less than 10%.
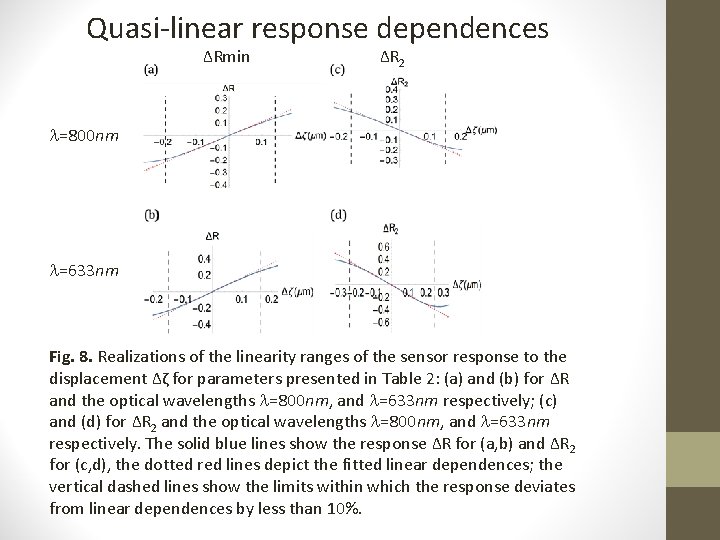
Quasi-linear response dependences ΔRmin ΔR 2 =800 nm =633 nm Fig. 8. Realizations of the linearity ranges of the sensor response to the displacement Δζ for parameters presented in Table 2: (a) and (b) for ΔR and the optical wavelengths =800 nm, and =633 nm respectively; (c) and (d) for ΔR 2 and the optical wavelengths =800 nm, and =633 nm respectively. The solid blue lines show the response ΔR for (a, b) and ΔR 2 for (c, d), the dotted red lines depict the fitted linear dependences; the vertical dashed lines show the limits within which the response deviates from linear dependences by less than 10%.
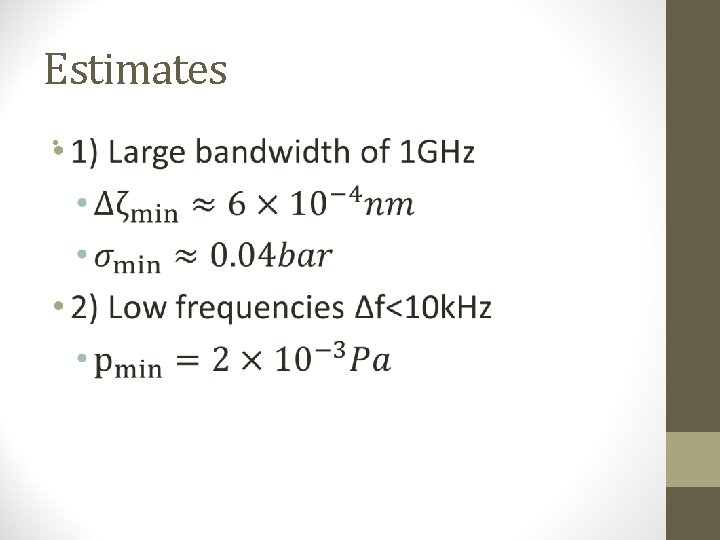
Estimates •
Questions?
Surface Plasmons Part 5 • Surface plasmon effects on nano particles
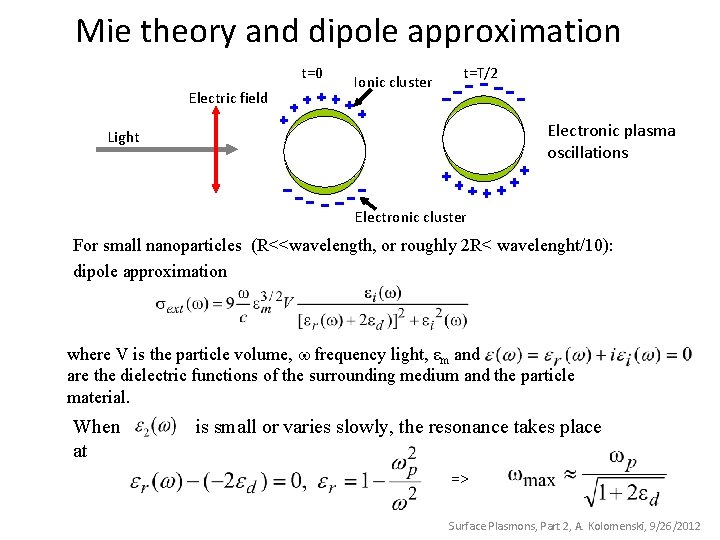
Mie theory and dipole approximation t=0 Electric field Ionic cluster t=T/2 Electronic plasma oscillations Light Electronic cluster For small nanoparticles (R<<wavelength, or roughly 2 R< wavelenght/10): dipole approximation where V is the particle volume, frequency light, εm and are the dielectric functions of the surrounding medium and the particle material. When at is small or varies slowly, the resonance takes place => Surface Plasmons, Part 2, A. Kolomenski, 9/26/2012
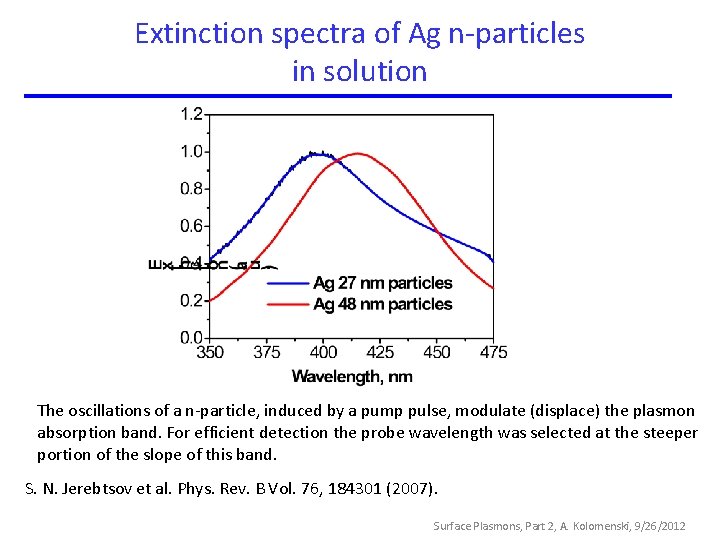
Extinction spectra of Ag n-particles in solution The oscillations of a n-particle, induced by a pump pulse, modulate (displace) the plasmon absorption band. For efficient detection the probe wavelength was selected at the steeper portion of the slope of this band. S. N. Jerebtsov et al. Phys. Rev. B Vol. 76, 184301 (2007). Surface Plasmons, Part 2, A. Kolomenski, 9/26/2012
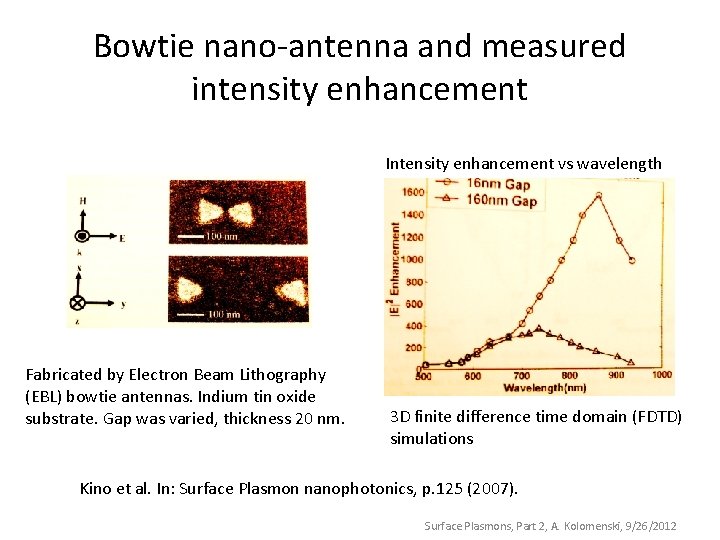
Bowtie nano-antenna and measured intensity enhancement Intensity enhancement vs wavelength Fabricated by Electron Beam Lithography (EBL) bowtie antennas. Indium tin oxide substrate. Gap was varied, thickness 20 nm. 3 D finite difference time domain (FDTD) simulations Kino et al. In: Surface Plasmon nanophotonics, p. 125 (2007). Surface Plasmons, Part 2, A. Kolomenski, 9/26/2012
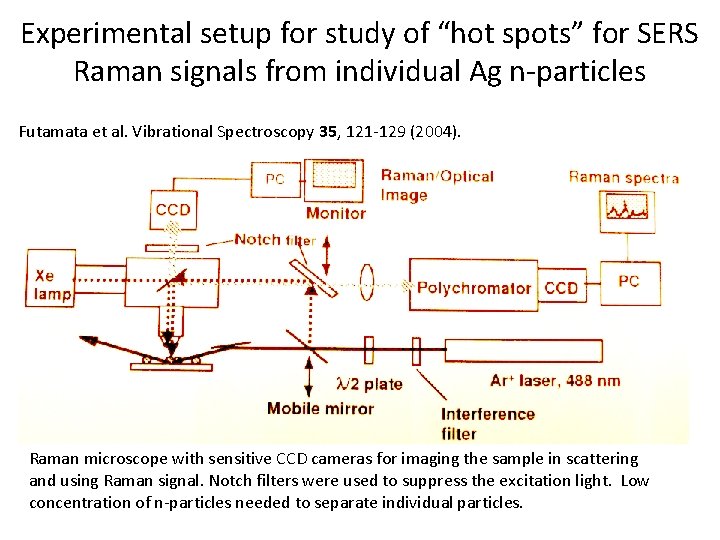
Experimental setup for study of “hot spots” for SERS Raman signals from individual Ag n-particles Futamata et al. Vibrational Spectroscopy 35, 121 -129 (2004). Raman microscope with sensitive CCD cameras for imaging the sample in scattering and using Raman signal. Notch filters were used to suppress the excitation light. Low concentration of n-particles needed to separate individual particles.
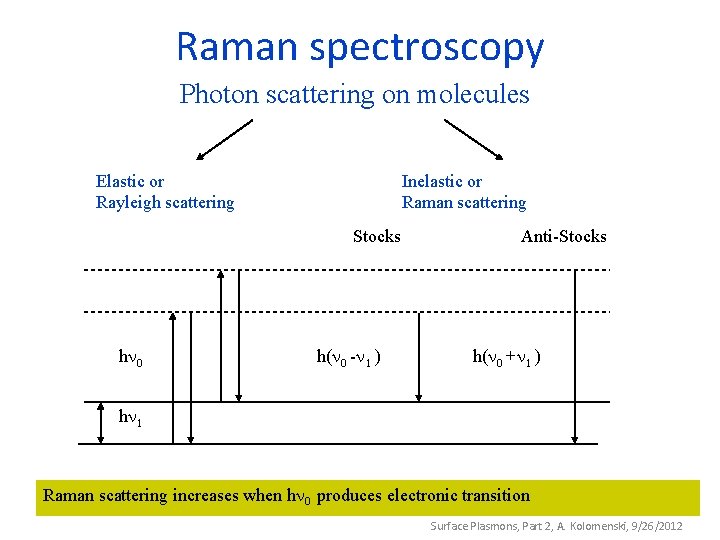
Raman spectroscopy Photon scattering on molecules Elastic or Rayleigh scattering Inelastic or Raman scattering Stocks h h( - ) Anti-Stocks h( + ) h Raman scattering increases when h produces electronic transition Surface Plasmons, Part 2, A. Kolomenski, 9/26/2012
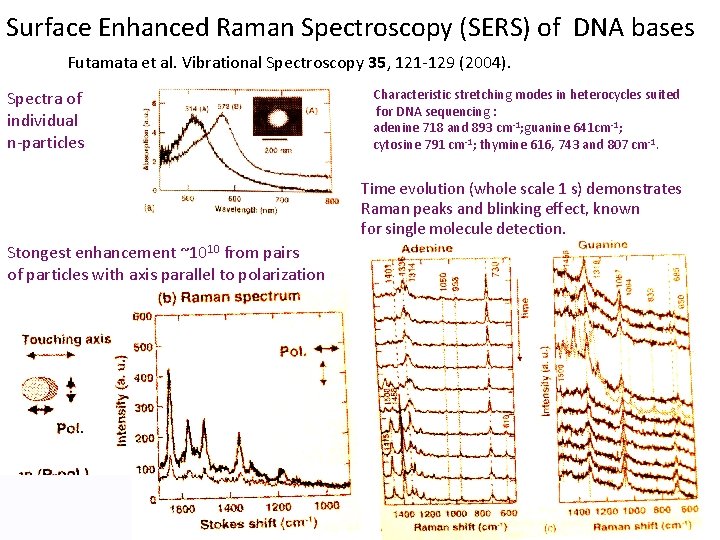
Surface Enhanced Raman Spectroscopy (SERS) of DNA bases Futamata et al. Vibrational Spectroscopy 35, 121 -129 (2004). Spectra of individual n-particles Characteristic stretching modes in heterocycles suited for DNA sequencing : adenine 718 and 893 cm-1; guanine 641 cm-1; cytosine 791 cm-1; thymine 616, 743 and 807 cm-1. Time evolution (whole scale 1 s) demonstrates Raman peaks and blinking effect, known for single molecule detection. Stongest enhancement ~1010 from pairs of particles with axis parallel to polarization