Statistical tools in Climatology Ren Garreaud www dgf

 Climatology: How to link local-scale phenomena with large scale atmospheric")


. Anomalies time n Event! time")


 rainfall and (c, d) SST anomaly overlaid on vectors")


")


 data sets • Allows")
 Pre-filter")


- Slides: 30
Statistical tools in Climatology René Garreaud www. dgf. uchile. cl/rene
Fundamental problem in (paleo) Climatology: How to link local-scale phenomena with large scale atmospheric patterns (if there such a link)? Local signal Internal dynamics Large scale climate Example of local scale signals: Rainfall, wind, temperature, tree-ring growth, lake level, wet deposition, charcoal accumulation, etc. Some times, we have local events: heavy rainfall, extended drought, lake desiccation, etc. Example of large scale climate: wind patterns, SST, precipitation elsewhere, etc….
Gridded Analysis: set of maps with data on a regular grid (e. g. , lat-lon, lon-lev) • Spatial structure at a given time (displayed with isolines or colors) • Time series at each grid point time n time 4 time 3 time 2 time 1 lat erie es Latitude Tim Map lon Longitude s at a d fixe p grid t oin
Basic Operation with gridded data Mean and Std Deviation time 4 time 3 time 2 lat time 1 Standard deviatio n Mean field Average, standard deviation and other statistical parameters (max, min, skewness, etc. ) are calculated using the time series at each grid point
Example of mean fields…
Basic Operation with gridded data Compositing Analysis (composite map). Anomalies time n Event! time 4 Event! time 3 time 2 lat time 1 Here one can use a univariate method (e. g. , t-test) at each point to test for statistical significance of the anomalies All mean Composite mean _ Composite anom alies =
Example of compositing analysis…spatial fields
Cold minus Warm composites to enhance signal
Composite maps of (a, b) rainfall and (c, d) SST anomaly overlaid on vectors of wind stress anomaly during dry and wet years. ® Mathew England 2005
Use compositing analysis to describe the spatial structure of selected climate variables during the occurrence of events at your site. SLP elsewhere Sometime, the events are associated to extreme values of a continuous time series. In this case, you can also use regression analysis (1 Point correlation map), but the later method will fail if there is no a linear relationship… Your events Your site specific variable
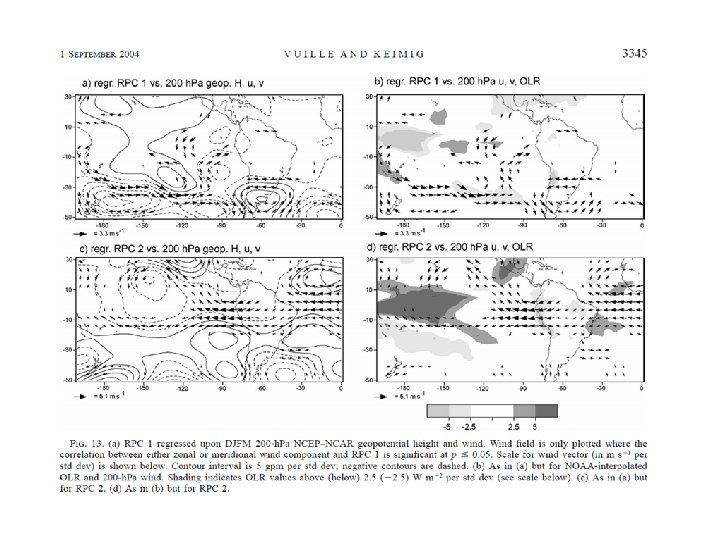
Basic Operation with gridded data 1 Point Correlation Map var f so e Tim rie e S ia X e l b time n time 4 time 3 time 2 time 1 lat time 1 ble f o s Correlation map p a M Here one can use a univariate method at each point to test for statistical significance of correlation ria a V Y
Annual mean Precip/SAT regressed upon index of large-scale modes (50 years of data)
How is the spatial pattern of SST when there is above/below normal Rainfall over the Altiplano?
Basic Operation with gridded data Point-Point Correlation Map time n time 3 time 4 time 2 time 3 time 1 time 4 time 2 le b a ri X a ps Ma V of Correlation map a ble f o ps ri a V Ma Here one can use a univariate method at each point to test for statistical significance of correlation Y
Precipitación en latitudes medias Garreaud 2007
Your Time Series may contain • Strong annual cycle (if or monthly data is available) • Moderate (but important) interannual or interdecadal variability • Long term trends • Errors! Need to examine and pre-filter data before analysis
Large annual cycle Small interannual variability Small annual cycle Large interannual variability Intraseasonal noise?
Nice trend Moderate annual cycle Some noise… Abrupt climate change? Strong annual cycle?
Stgo. Rainfall 1 -Point Correlation map Stgo. Rainfall – 1000 h. Pa air temperature Full time series Mix regular cycles and interannual variability
Stgo. Winter Rainfall 1 -Point Correlation map Stgo. Winter Rainfall – 1000 h. Pa air temperature
Alternatively, use the anomaly filter, i. e. substract annual mean cycle Caution with seasonally dependent signal Full time series Annual cycle Anomaly time series Mean annual cycle Anomalies
Caution with seasonally dependent signal 1 Point Correlation Map between U 300’ over the Andes and Precipitation DJF JJA All months
So far we have analyzed data at one site and its association with global fields. Global fields have spatial coherence and some common temporal variability arising from internal variability (e. g. ENSO) U 300 winter Stgo Winter Precip
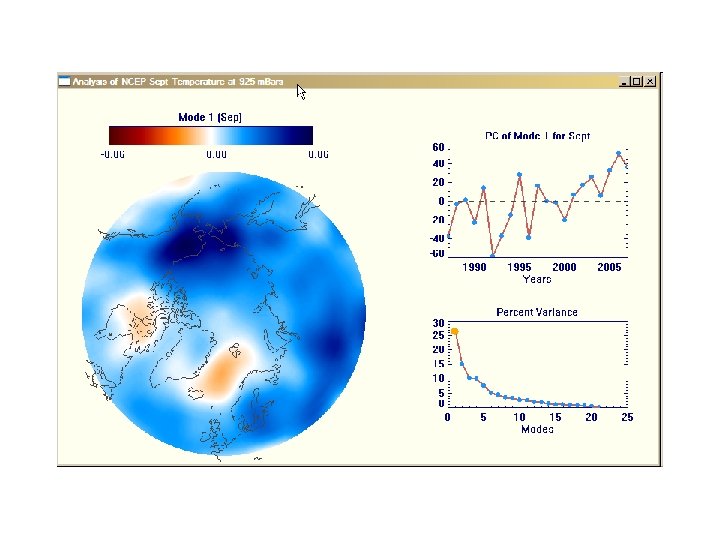
EOF / PC Analysis • Powerful method to synthesize (large) data sets • Allows to obtain the mode(s) that explain most of the variance in the data • Each mode composed by a spatial pattern (EOF), time pattern (PC, loading factors) and fraction of variance accounted by • It uses linear algebra: EOF/PC are linear combination of original data • EOF = Empirical orthogonal functions (instead of analytical orthogonal functions)
EOF / PC Analysis • • User has to decide spatial domain (large-small) Pre-filter data (at least remove mean field) How many modes are retained (North’s rule) Each mode is orthogonal with the rest…not always true in nature • Rotated EOFs / Extended EOFs
Synthesized information Original data time 1 time 2 Let the data speak by itself X(space) time 3 variable Leading EOF (dominant mode) EOF Analysis time 5 X(space) Principal Component loading variable time 4 1 2 3 4 5 …. . N time : fraction of variance accounted by a mode time N X(space)
Otros ejemplos de EOF
Otros ejemplos: Rotated EOF Many other techniques…. but keep it simple