Standardized Approaches An overview Anja Kollmuss head of

- Slides: 24
Standardized Approaches An overview Anja Kollmuss, head of consulting a. kollmuss@southpolecarbon. com
Content • • • Framing the issue Main points of standardization Learning from existing experience 2
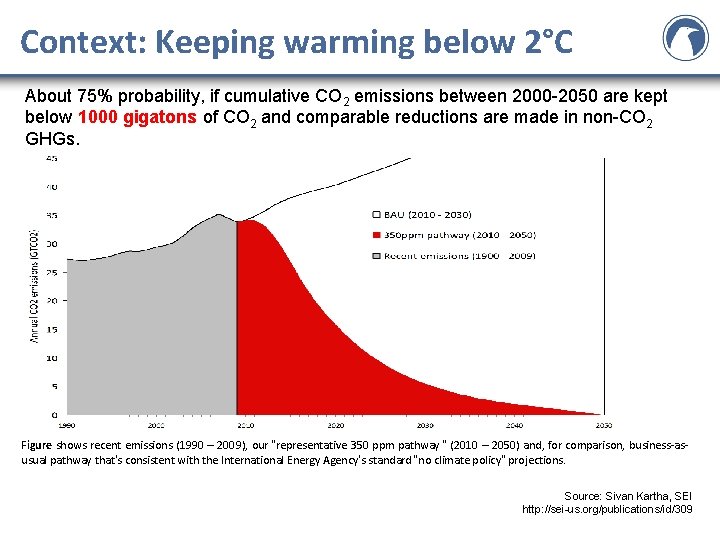
Context: Keeping warming below 2°C About 75% probability, if cumulative CO 2 emissions between 2000 -2050 are kept below 1000 gigatons of CO 2 and comparable reductions are made in non-CO 2 GHGs. Figure shows recent emissions (1990 – 2009), our “representative 350 ppm pathway “ (2010 – 2050) and, for comparison, business-asusual pathway that’s consistent with the International Energy Agency’s standard “no climate policy” projections. Source: Sivan Kartha, SEI http: //sei-us. org/publications/id/309
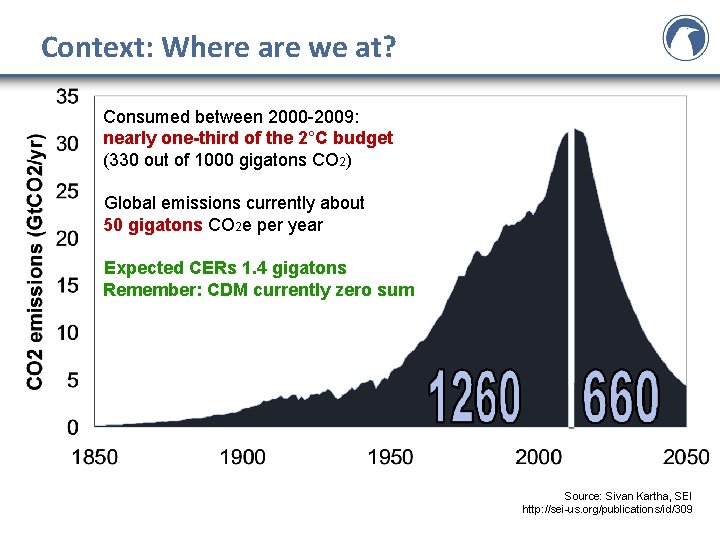
Context: Where are we at? Consumed between 2000 -2009: nearly one-third of the 2°C budget (330 out of 1000 gigatons CO 2) Global emissions currently about 50 gigatons CO 2 e per year Expected CERs 1. 4 gigatons Remember: CDM currently zero sum Source: Sivan Kartha, SEI http: //sei-us. org/publications/id/309
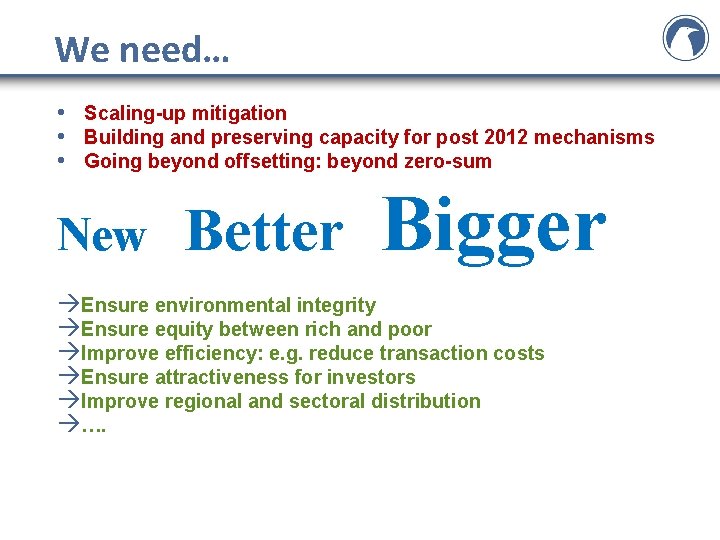
We need… • Scaling-up mitigation • Building and preserving capacity for post 2012 mechanisms • Going beyond offsetting: beyond zero-sum New Better Bigger Ensure environmental integrity Ensure equity between rich and poor Improve efficiency: e. g. reduce transaction costs Ensure attractiveness for investors Improve regional and sectoral distribution ….
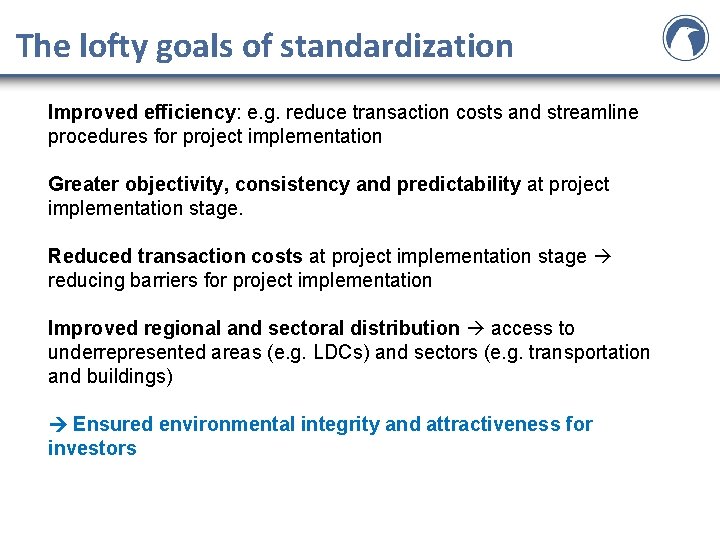
The lofty goals of standardization Improved efficiency: e. g. reduce transaction costs and streamline procedures for project implementation Greater objectivity, consistency and predictability at project implementation stage. Reduced transaction costs at project implementation stage reducing barriers for project implementation Improved regional and sectoral distribution access to underrepresented areas (e. g. LDCs) and sectors (e. g. transportation and buildings) Ensured environmental integrity and attractiveness for investors
What can be standardized? Offset Programs • Baseline emissions and/or • Additionality determination and/or • Certain parameters for project emission calculations Standartization can also be used in other contexts (e. g. allowance allocation, voluntary programs)
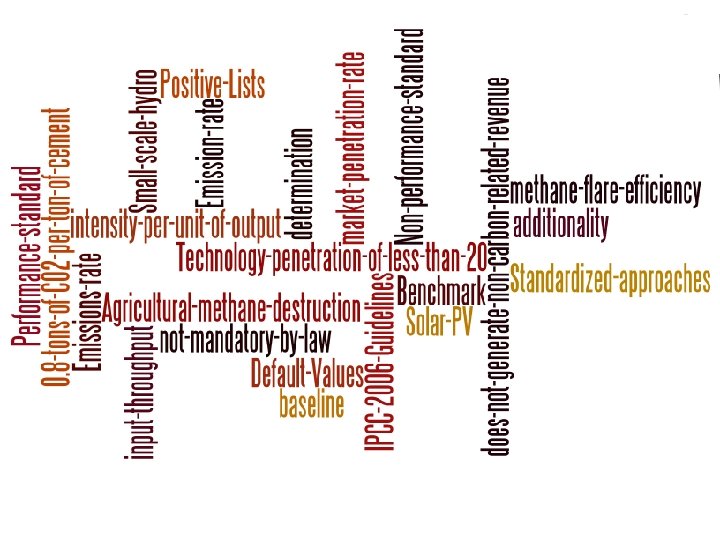
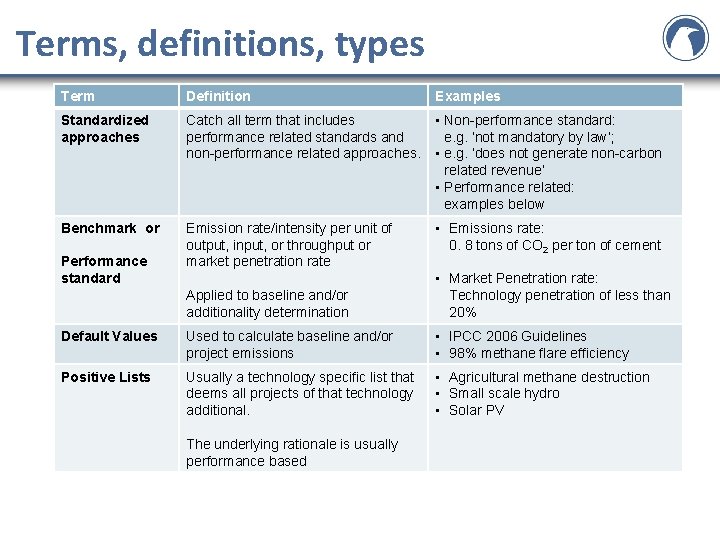
Terms, definitions, types Term Definition Examples Standardized approaches Catch all term that includes performance related standards and non-performance related approaches. • Non-performance standard: e. g. ‘not mandatory by law’; • e. g. ‘does not generate non-carbon related revenue’ • Performance related: examples below Benchmark or Emission rate/intensity per unit of output, input, or throughput or market penetration rate • Emissions rate: 0. 8 tons of CO 2 per ton of cement Performance standard Applied to baseline and/or additionality determination • Market Penetration rate: Technology penetration of less than 20% Default Values Used to calculate baseline and/or project emissions • IPCC 2006 Guidelines • 98% methane flare efficiency Positive Lists Usually a technology specific list that deems all projects of that technology additional. • Agricultural methane destruction • Small scale hydro • Solar PV The underlying rationale is usually performance based
Terms, definitions, types Term Definition Examples Standardized approaches Catch all term that includes performance related standards and non-performance related approaches. • Non-performance standard: e. g. ‘not mandatory by law’; • e. g. ‘does not generate non-carbon related revenue’ • Performance related: examples below Benchmark or Emission rate/intensity per unit of output, input, or throughput or market penetration rate • Emissions rate: 0. 8 tons of CO 2 per ton of cement Performance standard Applied to baseline and/or additionality determination • Market Penetration rate: Technology penetration of less than 20% Default Values Used to calculate baseline and/or project emissions • IPCC 2006 Guidelines • 98% methane flare efficiency Positive Lists Usually a technology specific list that deems all projects of that technology additional. • Agricultural methane destruction • Small scale hydro • Solar PV The underlying rationale is usually performance based
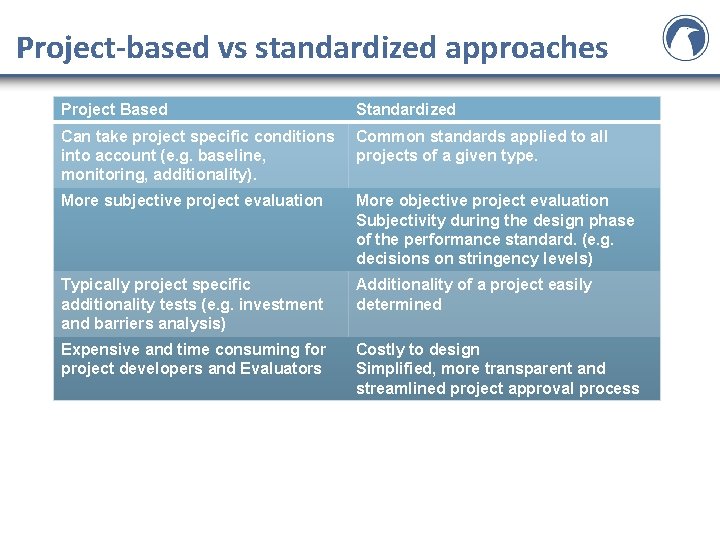
Project-based vs standardized approaches Project Based Standardized Can take project specific conditions into account (e. g. baseline, monitoring, additionality). Common standards applied to all projects of a given type. More subjective project evaluation More objective project evaluation Subjectivity during the design phase of the performance standard. (e. g. decisions on stringency levels) Typically project specific additionality tests (e. g. investment and barriers analysis) Additionality of a project easily determined Expensive and time consuming for project developers and Evaluators Costly to design Simplified, more transparent and streamlined project approval process
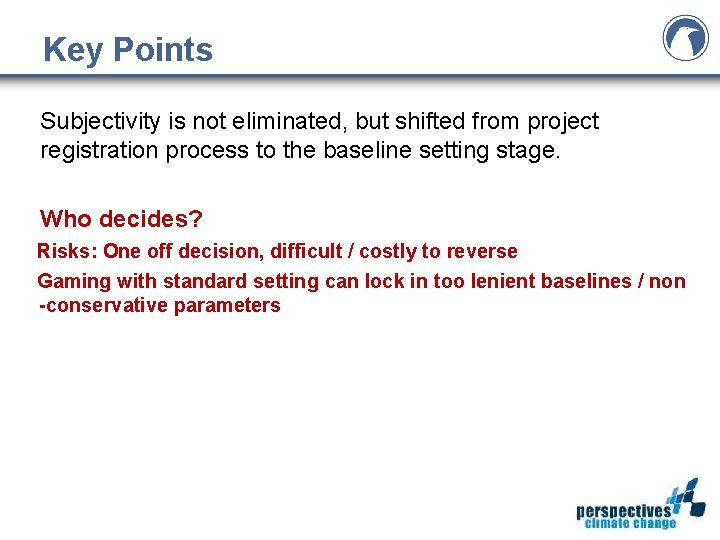
Key Points Subjectivity is not eliminated, but shifted from project registration process to the baseline setting stage. Who decides? Risks: One off decision, difficult / costly to reverse Gaming with standard setting can lock in too lenient baselines / non -conservative parameters
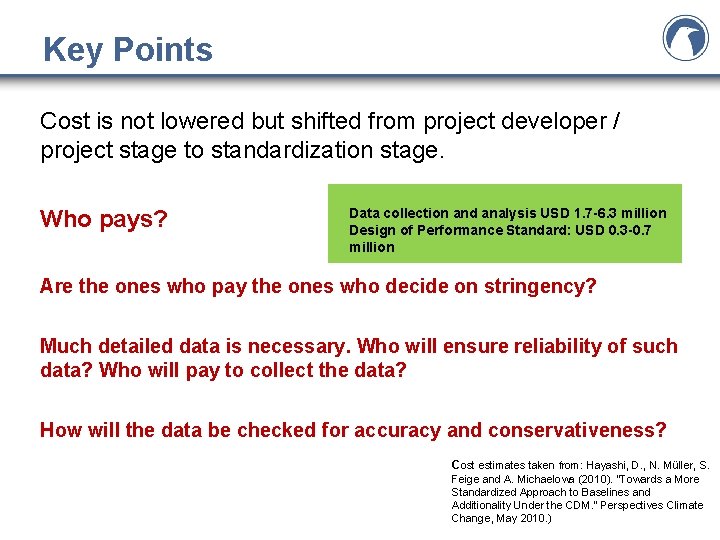
Key Points Cost is not lowered but shifted from project developer / project stage to standardization stage. Who pays? Data collection and analysis USD 1. 7 -6. 3 million Design of Performance Standard: USD 0. 3 -0. 7 million Are the ones who pay the ones who decide on stringency? Much detailed data is necessary. Who will ensure reliability of such data? Who will pay to collect the data? How will the data be checked for accuracy and conservativeness? Cost estimates taken from: Hayashi, D. , N. Müller, S. Feige and A. Michaelowa (2010). "Towards a More Standardized Approach to Baselines and Additionality Under the CDM. " Perspectives Climate Change, May 2010. )
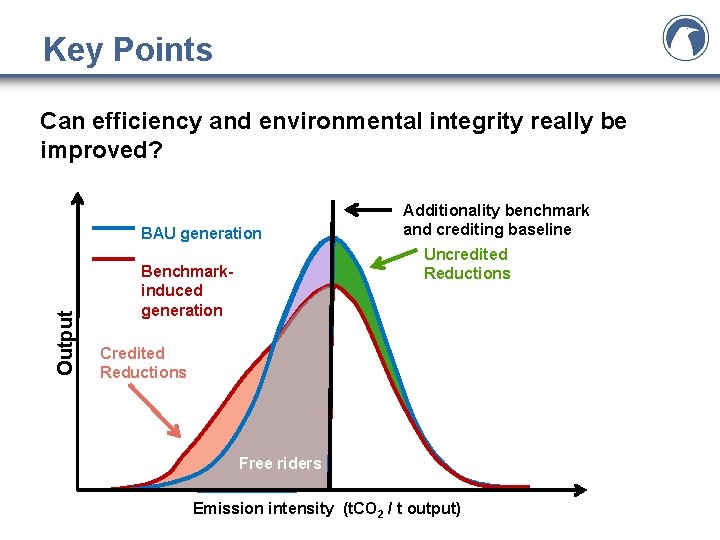
Key Points Can efficiency and environmental integrity really be improved?
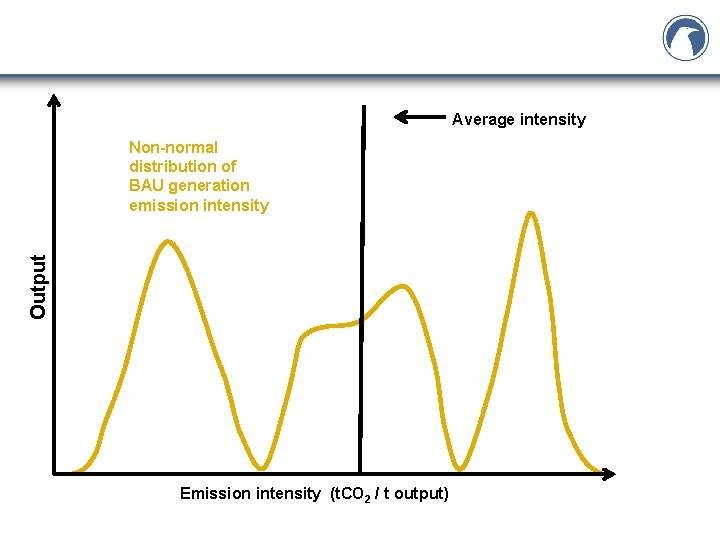
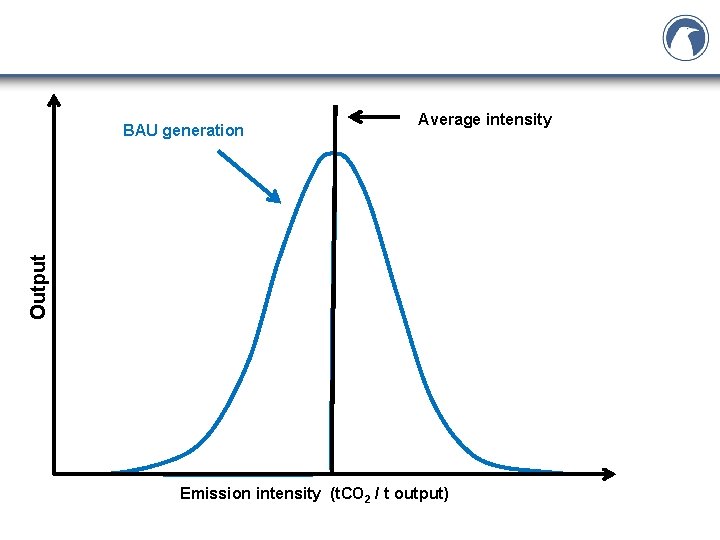
Average intensity Output Non-normal distribution of BAU generation emission intensity Emission intensity (t. CO 2 / t output)
Average intensity Output BAU generation Free riders Emission intensity (t. CO 2 / t output)
Key Points Can efficiency and environmental integrity really be improved? Output BAU generation Additionality benchmark and crediting baseline Uncredited Reductions Benchmarkinduced generation Credited Reductions Free riders Emission intensity (t. CO 2 / t output)
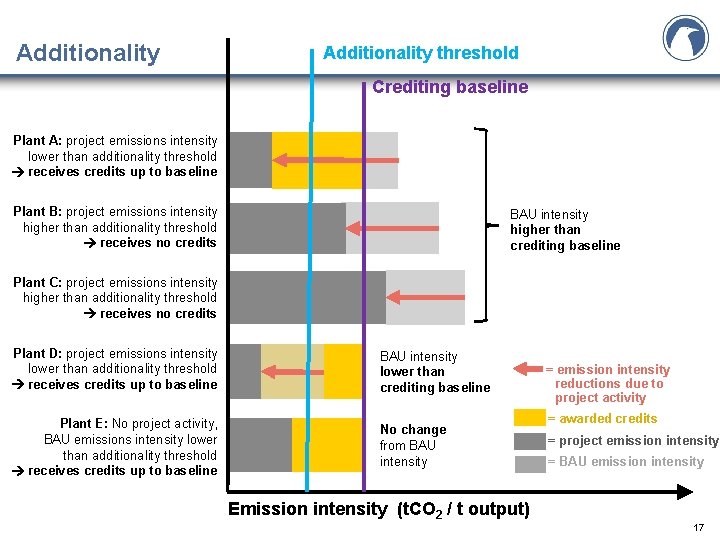
Additionality threshold Crediting baseline Plant A: project emissions intensity lower than additionality threshold receives credits up to baseline Plant B: project emissions intensity higher than additionality threshold receives no credits BAU intensity higher than crediting baseline Plant C: project emissions intensity higher than additionality threshold receives no credits Plant D: project emissions intensity lower than additionality threshold receives credits up to baseline BAU intensity lower than crediting baseline Plant E: No project activity, BAU emissions intensity lower than additionality threshold receives credits up to baseline No change from BAU intensity Emission intensity (t. CO 2 / t output) = emission intensity reductions due to project activity = awarded credits = project emission intensity = BAU emission intensity 17
Lessons learned from existing standardizations 1. CDM 2. JI 3. Climate Action Reserve
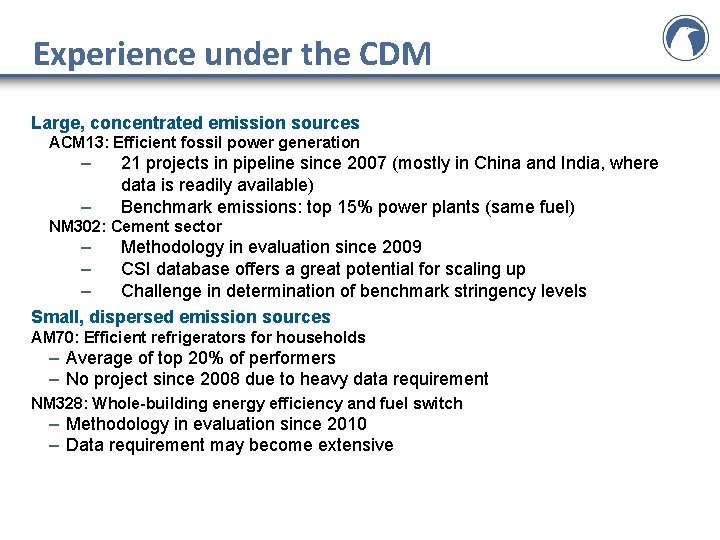
Experience under the CDM Large, concentrated emission sources ACM 13: Efficient fossil power generation – – 21 projects in pipeline since 2007 (mostly in China and India, where data is readily available) Benchmark emissions: top 15% power plants (same fuel) NM 302: Cement sector – Methodology in evaluation since 2009 – CSI database offers a great potential for scaling up – Challenge in determination of benchmark stringency levels Small, dispersed emission sources AM 70: Efficient refrigerators for households – Average of top 20% of performers – No project since 2008 due to heavy data requirement NM 328: Whole-building energy efficiency and fuel switch – Methodology in evaluation since 2010 – Data requirement may become extensive
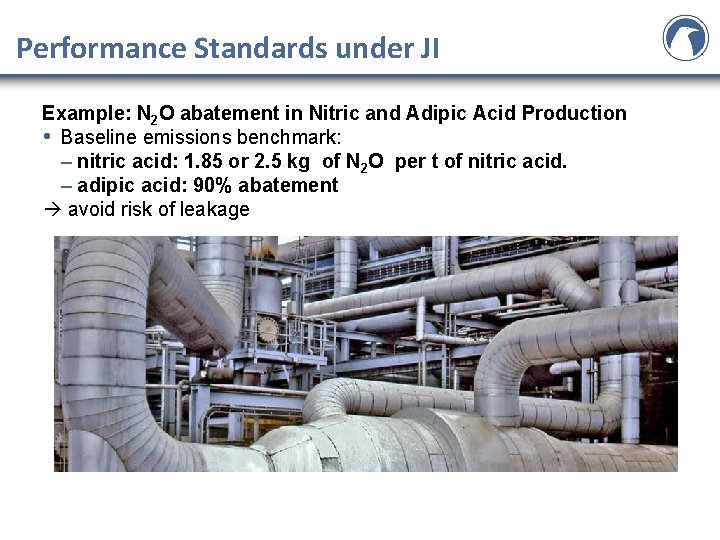
Performance Standards under JI Example: N 2 O abatement in Nitric and Adipic Acid Production • Baseline emissions benchmark: – nitric acid: 1. 85 or 2. 5 kg of N 2 O per t of nitric acid. – adipic acid: 90% abatement avoid risk of leakage
CAR Lessons Learned • To maintain environmental integrity, standardized baselines may need to be conservative • Use of standardized assumptions, emission factors, and parameters may lead to inaccuracy at the project level • Protocols generally compensate by adopting conservative assumptions, factors, parameters
CAR Lessons Learned • Standardized protocols work better for some project types than for others • Standardized baselines are more difficult with complex systems, where performance is subject to multiple drivers, or where multiple baseline alternatives are possible (e. g. , forestry!) • All protocols rely on project-specific details and parameters to some degree
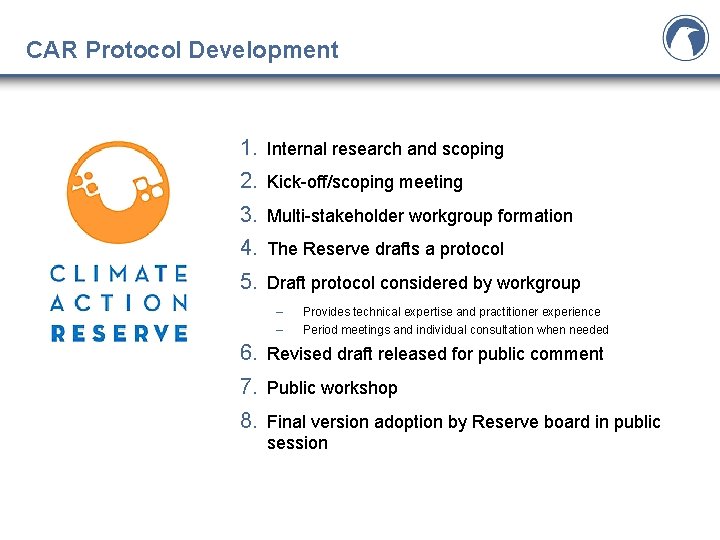
CAR Protocol Development 1. Internal research and scoping 2. Kick-off/scoping meeting 3. Multi-stakeholder workgroup formation 4. The Reserve drafts a protocol 5. Draft protocol considered by workgroup – Provides technical expertise and practitioner experience – Period meetings and individual consultation when needed 6. Revised draft released for public comment 7. Public workshop 8. Final version adoption by Reserve board in public session
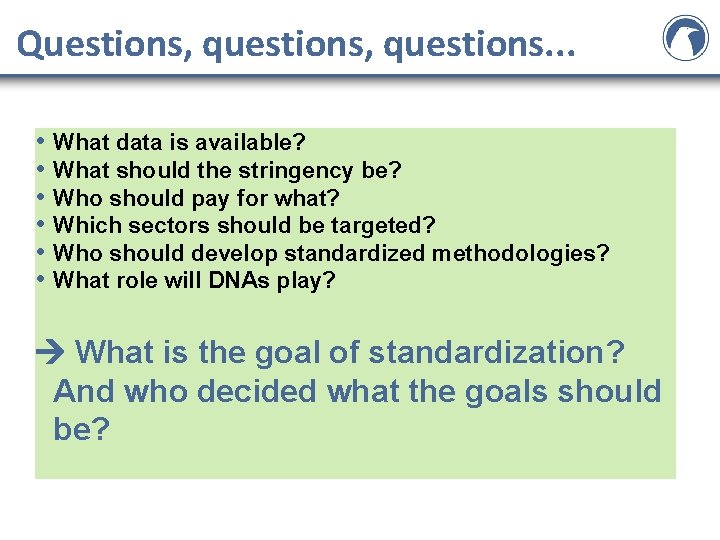
Questions, questions. . . • What data is available? • What should the stringency be? • Who should pay for what? • Which sectors should be targeted? • Who should develop standardized methodologies? • What role will DNAs play? What is the goal of standardization? And who decided what the goals should be?