SPECTROSCOPY OF Ti O SINGLET STATES DROR M


 was reported for: • HD 209458")


- Slides: 12
SPECTROSCOPY OF Ti. O SINGLET STATES DROR M. BITTNER AND PETER F. BERNATH Department of Chemistry and Biochemistry, Old Dominion University, Norfolk, VA, USA.
Introduction • Ti. O is present in the atmospheres of oxygen-rich low-mass stellar objects. • M dwarfs have strong absorption features from Ti. O bands. • In later spectral types, L and T, Ti. O features are weaker or absent. • Model atmosphere calculations have been performed for M dwarfs and require the inclusion of Ti. O opacities.
Detections of Ti. O (other than M dwarfs) was reported for: • HD 209458 b • WASP-19 b • WASP-76 b • WASP-33 b (by cross correlation) • Perhaps on WASP-121 b • Red supergiant VY Canis Majoris and its circumstellar environment
Cross correlation • Cross correlation of the high resolution transmission spectrum of HD 209458 b with synthetic spectra of model atmospheres containing Ti. O transitions tentatively ruled out detection of Ti. O in the exoplanet atmosphere (Hoeijmakerset al. 2015). • The model atmospheres used Ti. O line lists by Schwenke and Plez, and these line lists were found to be unsatisfactory.
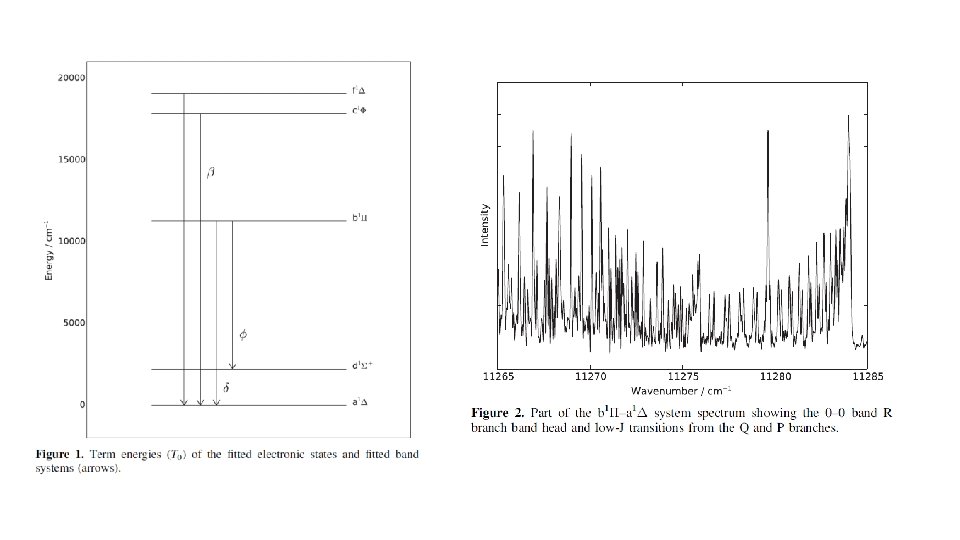
Laboratory experiments • The b 1Π-a 1Δ, b 1Π -d 1Σ+, c 1Φ-a 1Δ, f 1Δ-a 1Δ and e 1Σ+-d 1Σ+ have been previously analyzed • Several FT spectra, spectrograph spectra and laser spectra • First measurement to contain rotational analysis was by Phillips (1950) of the b-a and c-a systems
Experimental • Three FTS emission spectra • 1 -m Fourier transform interferometer at Kitt Peak • 9000 -22000 cm-1, 3800 -12000 cm-1 and 9000 -21000 cm-1 • 0. 015 – 0. 044 cm-1 spectral resolution • Precision of about 0. 003 -0. 007 cm-1 • 1950 K carbon furnace for the 9000 -21000 cm-1, microwave discharge for 9000 -22000 cm-1 and 3800 -12000 cm-1
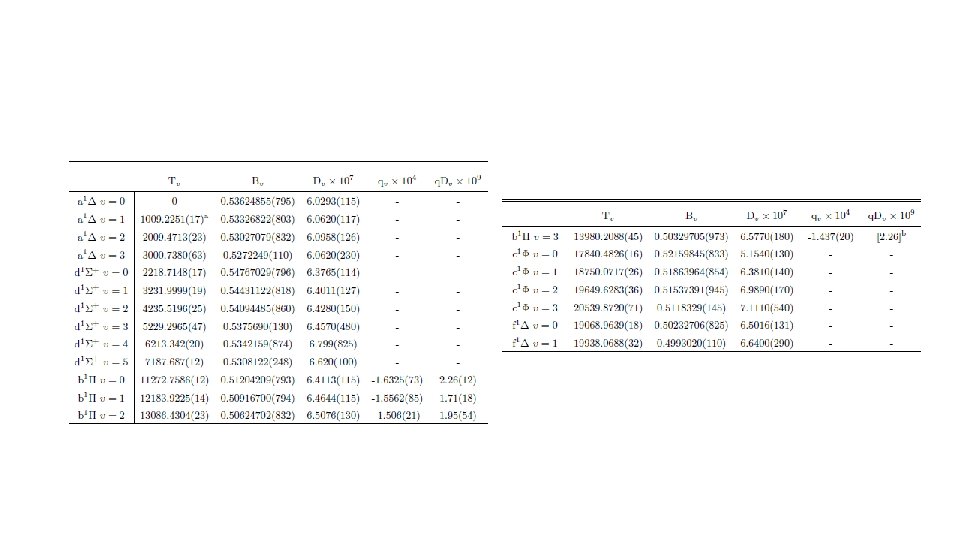
Results • We did not observe the e 1Σ+-d 1Σ+ system • A consistent set of constants is determined from a simultaneous fit of all lines of the b 1Π-a 1Δ, b 1Π -d 1Σ+, c 1Φ-a 1Δ and f 1Δ-a 1Δ bands • First fit of the 0 -1, 1 -0, 1 -2 and 2 -3 bands of the b-a system • First fit of the 1 -0, 2 -1 and 3 -2 bands of the c-a system and first extensive analysis of the system using FT spectroscopy
Perturbation • Perturbation was observed for the c-a bands • Effective constants were determined for the c v=0 state • We have fitted the perturbed c 1Φ-C 3Δ system by spin-orbit interaction
Concluding Remarks • We have used three FTS spectra in our analysis • A consistent set of spectroscopic constants for most of the known singlet states of Ti. O have been determined • Improved accuracy and precision over the previous data • Bittner, D. M. , & Bernath, P. F. , 2018, Ap. JS, 236, 46
Acknowledgements • Bernath’s Group