NMR SPECTROSCOPY Protons and neutrons can be regarded

NMR SPECTROSCOPY

• Protons and neutrons can be regarded as spinning about their axis. • In many atoms these spins are paired against each other and so the nucleus has no overall spin (e. g. 12 C). • In some atoms (e. g. 1 H and 13 C) the nucleus has an overall spin. • A nucleus that spins generates a magnetic field. • The direction of the magnetic field depends which way the nucleus spins.

• Usually the two possible spin states of the nucleus have the same amount of energy. • However, in a magnetic field, the two spin states have different energies. Energy Magnetic field opposed to applied field Energy gap corresponds to frequency of radiowaves Magnetic field in same direction as applied field Applied magnetic field

butanone

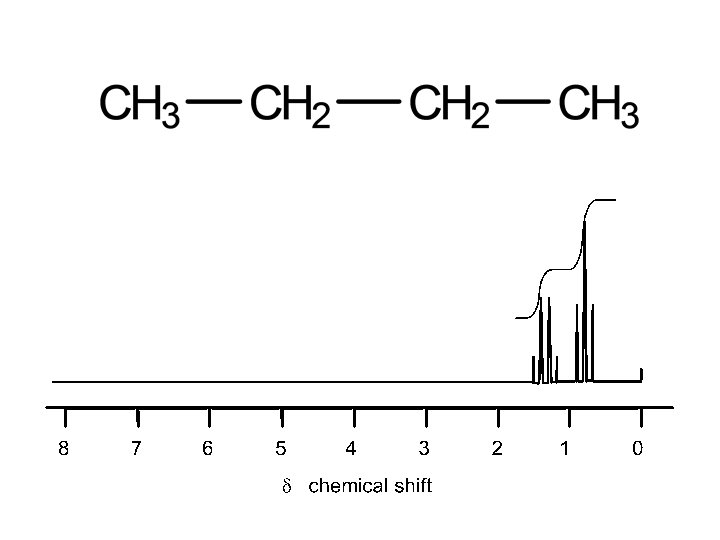
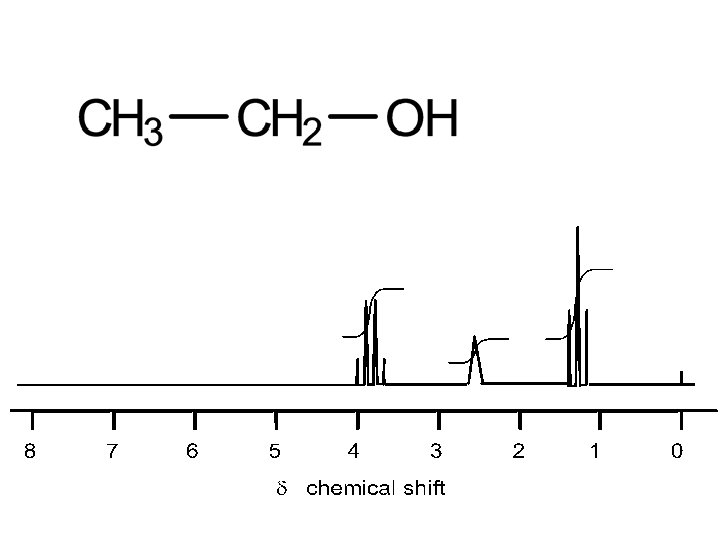
• • In a spectrum, there is one signal for each set of equivalent H atoms i. e. those H atoms in the same environment The intensity or area of each signal being proportional to the number of equivalent H atoms it represents.

To identify hydrogen environments we need to look at the molecule: 1. Draw out the molecule in full. 2. Circle the first environment in one colour 3. Circle the next environment in another colour 4. Continue this process till there are no more hydrogen environments 5. Then work out the number of protons in each hydrogen environment to give you the peak ratio`s (peak areas).
 4 sets of equivalent")
2 sets of equivalent H’s: ratio 6: 2 (3: 1) 4 sets of equivalent H’s: ratio 3: 1: 2: 3 5 sets of equivalent H’s: ratio 3: 1: 2: 2: 3 4 sets of equivalent H’s: ratio 6: 1: 2: 3

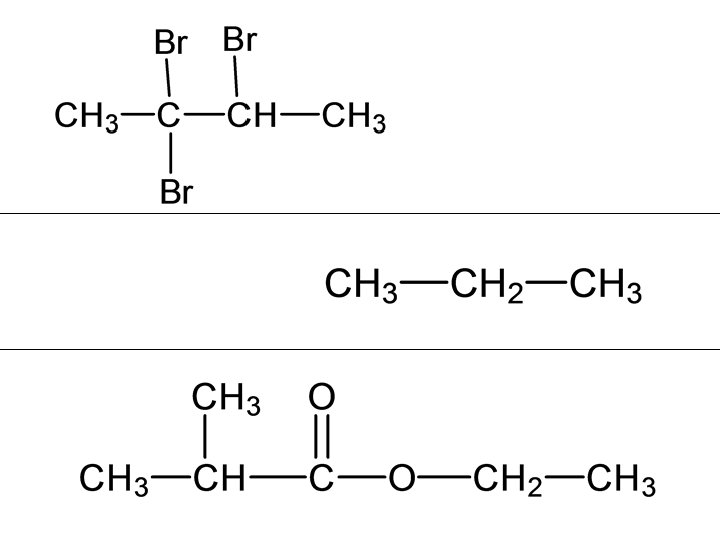
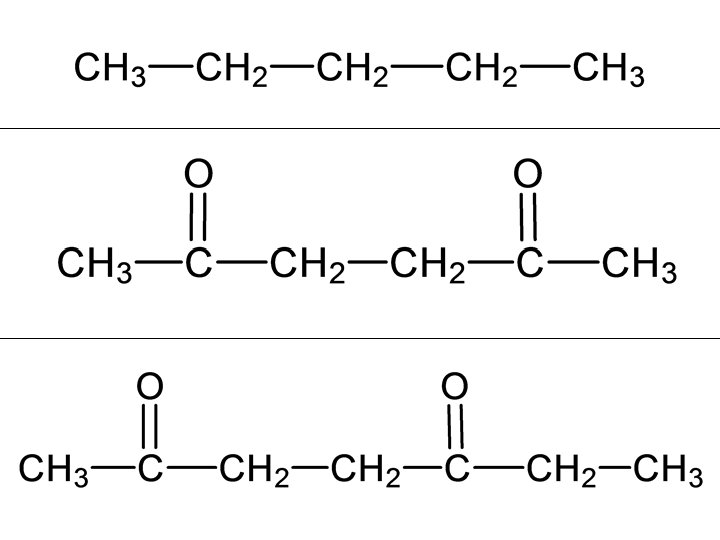
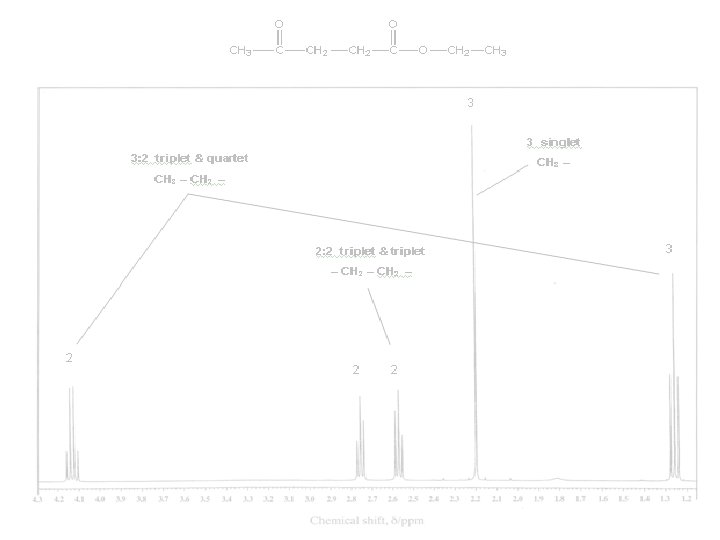
For each of the following compounds, predict the number of signals and the relative intensity of the signals. a) b) c) d) e) methylpropene 2 -chloropropane propanone methylamine f) ethyl propanoate g) 1, 2 -dibromopropane h) dimethyl propanoate i) but-2 -ene
 1 signal 3 signals: ratio 2: 1:")
2 signals: ratio 6: 2 (3: 1) 1 signal 3 signals: ratio 2: 1: 3 2 signals: ratio 3: 2 2 signals: ratio 6: 1 4 signals: ratio 3: 2: 2: 3

3 signals: ratio 2: 1: 3 3 signals: ratio 3: 2: 9 2 signals: ratio 6: 2 (3: 1)

• Samples are dissolved in solvents free of 1 H atoms, e. g. CCl 4, CDCl 3. • A small amount of TMS (tetramethylsilane) is added to calibrate the spectrum. • It is used because: • • • its signal is away from all the others it only gives one signal it is non-toxic it is inert it has a low boiling point so is easy to remove
 of how")
• The d is a measure in parts per million (ppm) of how far the magnetic field required for absorption is shifted away from that for TMS. • The d depends on what other atoms/groups are near the H – more electronegative groups gives a greater shift.

Coupling / Splitting / Multiplicity Number of H’s next door +1

Data from AQA datasheet

This is the table that should be used when doing questions on NMR Hydrogen Environment Number of Hydrogens Ratio (peak area) Splitting Pattern

Example 1 1 2 3 Hydrogen Environment Number 1 Number of Hydrogens Ratio (peak area) Splitting Pattern

Example 1 1 2 3 Hydrogen Environment Number of Hydrogens 1 3 Ratio (peak area) Splitting Pattern
 1")
Example 1 1 2 3 Hydrogen Environment Number of Hydrogens Ratio (peak area) 1 3 3 Splitting Pattern
 1")
Example 1 1 2 3 Hydrogen Environment Number of Hydrogens Ratio (peak area) 1 3 3 Splitting Pattern 0. 7 -1. 2
 1")
Example 1 1 2 3 Hydrogen Environment Number of Hydrogens Ratio (peak area) 1 3 3 Splitting Pattern 0. 7 -1. 2 triplet
 1")
Example 1 1 2 3 Hydrogen Environment Number of Hydrogens Ratio (peak area) 1 3 3 2 Splitting Pattern 0. 7 -1. 2 triplet
 1")
Example 1 1 2 3 Hydrogen Environment Number of Hydrogens Ratio (peak area) 1 3 3 2 2 Splitting Pattern 0. 7 -1. 2 triplet
 1")
Example 1 1 2 3 Hydrogen Environment Number of Hydrogens Ratio (peak area) 1 3 3 2 2 2 Splitting Pattern 0. 7 -1. 2 triplet
 Splitting")
Example 1 1 2 3 Hydrogen Environment Number of Hydrogens Ratio (peak area) Splitting Pattern 1 3 3 0. 7 -1. 2 2 2. 1 -2. 6 triplet
 Splitting")
Example 1 1 2 3 Hydrogen Environment Number of Hydrogens Ratio (peak area) Splitting Pattern 1 3 3 0. 7 -1. 2 triplet 2 2. 1 -2. 6 quartet
 1")
Example 1 1 2 3 Hydrogen Environment Number of Hydrogens Ratio (peak area) 1 3 3 0. 7 -1. 2 triplet 2 2. 1 -2. 6 quartet 3 Splitting Pattern
 Splitting")
Example 1 1 2 3 Hydrogen Environment Number of Hydrogens Ratio (peak area) Splitting Pattern 1 3 3 0. 7 -1. 2 triplet 2 2. 1 -2. 6 quartet 3 1
 Splitting")
Example 1 1 2 3 Hydrogen Environment Number of Hydrogens Ratio (peak area) Splitting Pattern 1 3 3 0. 7 -1. 2 triplet 2 2. 1 -2. 6 quartet 3 1 1
 Splitting")
Example 1 1 2 3 Hydrogen Environment Number of Hydrogens Ratio (peak area) Splitting Pattern 1 3 3 0. 7 -1. 2 triplet 2 2. 1 -2. 6 quartet 3 1 1 9. 0 -10. 0
 Splitting")
Example 1 1 2 3 Hydrogen Environment Number of Hydrogens Ratio (peak area) Splitting Pattern 1 3 3 0. 7 -1. 2 triplet 2 2. 1 -2. 6 quartet 3 1 1 9. 0 -10. 0 triplet

Example 2 3 4 1 2 Hydrogen Environment Number 1 Number of Hydrogens Ratio (peak area) Splitting Pattern

Example 2 3 4 1 2 Hydrogen Environment Number of Hydrogens 1 6 Ratio (peak area) Splitting Pattern
")
Example 2 3 4 1 2 Hydrogen Environment Number of Hydrogens Ratio (peak area) 1 6 6 Splitting Pattern
")
Example 2 3 4 1 2 Hydrogen Environment Number of Hydrogens Ratio (peak area) 1 6 6 Splitting Pattern 0. 7 -1. 2
")
Example 2 3 4 1 2 Hydrogen Environment Number of Hydrogens Ratio (peak area) 1 6 6 Splitting Pattern 0. 7 -1. 2 doublet
")
Example 2 3 4 1 2 Hydrogen Environment Number of Hydrogens Ratio (peak area) 1 6 6 2 Splitting Pattern 0. 7 -1. 2 doublet
")
Example 2 3 4 1 2 Hydrogen Environment Number of Hydrogens Ratio (peak area) 1 6 6 2 1 Splitting Pattern 0. 7 -1. 2 doublet
")
Example 2 3 4 1 2 Hydrogen Environment Number of Hydrogens Ratio (peak area) 1 6 6 2 1 1 Splitting Pattern 0. 7 -1. 2 doublet
")
Example 2 3 4 1 2 Hydrogen Environment Number of Hydrogens Ratio (peak area) Splitting Pattern 1 6 6 0. 7 -1. 2 2 1 1 2. 1 -2. 6 doublet
")
Example 2 3 4 1 2 Hydrogen Environment Number of Hydrogens Ratio (peak area) Splitting Pattern 1 6 6 0. 7 -1. 2 doublet 2 1 1 2. 1 -2. 6 multitet
")
Example 2 3 4 1 2 Hydrogen Environment Number of Hydrogens Ratio (peak area) 1 6 6 0. 7 -1. 2 doublet 2 1 1 2. 1 -2. 6 multitet 3 Splitting Pattern
")
Example 2 3 4 1 2 Hydrogen Environment Number of Hydrogens Ratio (peak area) Splitting Pattern 1 6 6 0. 7 -1. 2 doublet 2 1 1 2. 1 -2. 6 multitet 3 2
")
Example 2 3 4 1 2 Hydrogen Environment Number of Hydrogens Ratio (peak area) Splitting Pattern 1 6 6 0. 7 -1. 2 doublet 2 1 1 2. 1 -2. 6 multitet 3 2 2
")
Example 2 3 4 1 2 Hydrogen Environment Number of Hydrogens Ratio (peak area) Splitting Pattern 1 6 6 0. 7 -1. 2 doublet 2 1 1 2. 1 -2. 6 multitet 3 2 2 3. 1 -3. 9 quartet 4 3 3 triplet
 1 H next door doublet (d) 2")
n+1 0 H next door singlet (s) 1 H next door doublet (d) 2 H next door triplet (t) 3 H next door quartet (q) more H next door multiplet (m)

signal singlet doublet triplet quartet number of lines 1 2 3 4 number of H’s next door 0 1 2 3 appearance

Number of H’s next door +1 But you don’t couple to • H’s that are equivalent • H’s on O’s

Number of signals how many different sets of equivalent H atoms there are Position of signals information about chemical environment of H atom Relative intensities gives ratio of H atoms for peaks Splitting how many H atoms on adjacent C atoms

For each of the following compounds, predict the number of signals, the relative intensity of the signals, and the multiplicity of each signal. a) b) c) d) e) methylpropene 2 -chloropropane propanone methylamine f) ethyl propanoate g) 1, 2 -dibromopropane h) dimethyl propanoate i) but-2 -ene
 s s 3 signals: ratio")
2 peaks: ratio 6 : 2 (3 : 1) s s 3 signals: ratio 2 : 1 : 3 d m d 2 signals: ratio 6 : 1 d m 1 signal 2 signals: ratio 3 : 2 t q 4 signals: ratio 3 : 2 : 3 t q q t

3 signals: ratio 2 : 1 : 3 d m d 3 signals: ratio 3 : 2 : 9 t q s 2 signals: ratio 6 : 2 (3 : 1) d q
- Slides: 57