Session Length Prediction for Streaming Services Jayashree Raman
- Slides: 22
Session Length Prediction for Streaming Services Jayashree Raman, Ranga Muvavarirwa, Nishanth Nair
Motivation ➢ User session length is an important metric that determines a user’s satisfaction with a streaming service. ➢ It provides a baseline for user engagement with any app, web content or streaming service. ➢ Predicting user session length is extremely useful for tasks like ad scheduling and recommendations. ➢ The challenges in predicting session length arise due to unobservable effects and lack of predictive covariates.
Objective ➢ The current state of the art research used survival analysis techniques and outperforms a baseline estimator by a margin of 13% to 19% in terms of Mean Absolute Error measured in seconds on 2 different real world datasets. ➢ Examine models that take into account the time component of the data - Time series, Panel Data techniques and also other approaches in Machine Learning, Deep Learning/Neural Networks ➢ Our goal is to explore these techniques and also Ensemble models that can perform better than the current state of the art in session length predictions.
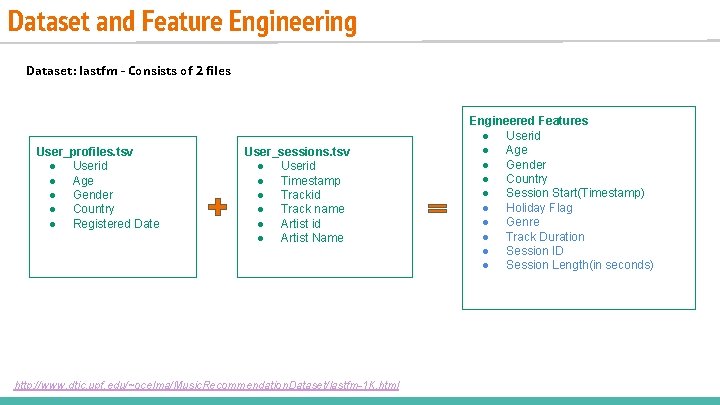
Dataset and Feature Engineering Dataset: lastfm - Consists of 2 files User_profiles. tsv ● Userid ● Age ● Gender ● Country ● Registered Date User_sessions. tsv ● Userid ● Timestamp ● Trackid ● Track name ● Artist id ● Artist Name http: //www. dtic. upf. edu/~ocelma/Music. Recommendation. Dataset/lastfm-1 K. html Engineered Features ● Userid ● Age ● Gender ● Country ● Session Start(Timestamp) ● Holiday Flag ● Genre ● Track Duration ● Session ID ● Session Length(in seconds)
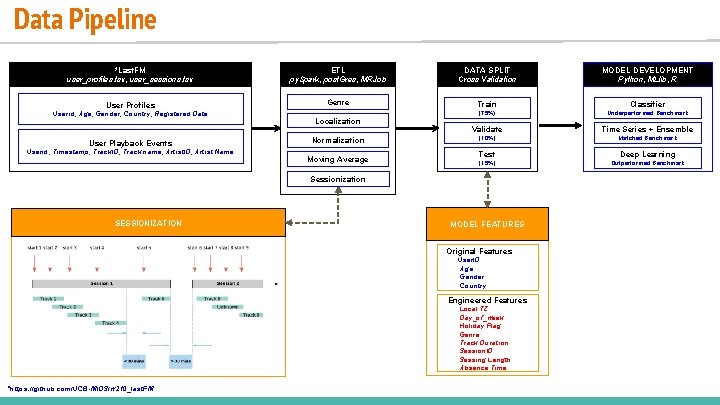
Data Pipeline *Last. FM user_profiles. tsv, user_sessions. tsv ETL py. Spark, post. Gres, MRJob DATA SPLIT Cross Validation User Profiles Genre Train Classifier (75%) Underperformed Benchmark Validate Time Series + Ensemble (10%) Matched Benchmark Userid, Age, Gender, Country, Registered Date User Playback Events Userid, Timestamp, Track. ID, Track name, Artist. ID, Artist Name Localization Normalization Moving Average Test Deep Learning (15%) Outperformed Benchmark Sessionization SESSIONIZATION MODEL FEATURES Original Features User. ID Age Gender Country Engineered Features Local TZ Day_of_week Holiday Flag Genre Track Duration Session. ID Sessing Length Absence Time *https: //github. com/UCB-MIDS/w 210_last. FM MODEL DEVELOPMENT Python, MLlib, R
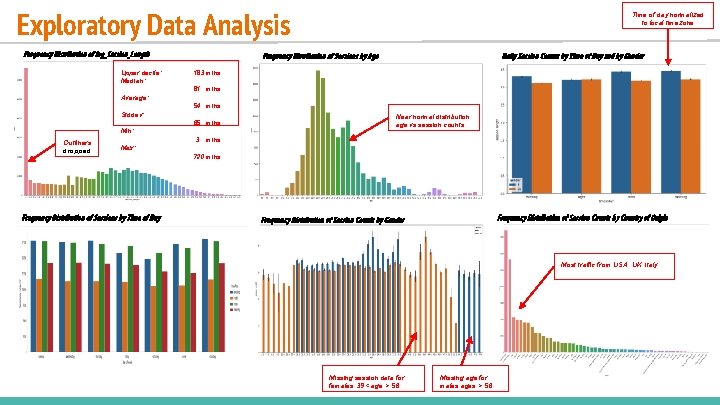
Exploratory Data Analysis Frequency Distribution of log_Session_Length Upper decile: Median: Time of day normalized to local timezone Frequency Distribution of Sessions by Age Daily Session Counts by Time of Day and by Gender 183 mins 81 mins Average: 54 mins Stddev: 65 mins Min: Outliners dropped 3 Near normal distribution age vs session counts mins Max: Frequency Distribution of Sessions by Time of Day 720 mins Frequency Distribution of Session Counts by Country of Origin Frequency Distribution of Session Counts by Gender Most traffic from USA, UK, Italy Missing session data for females 39 < age > 56 Missing age for males ages > 56
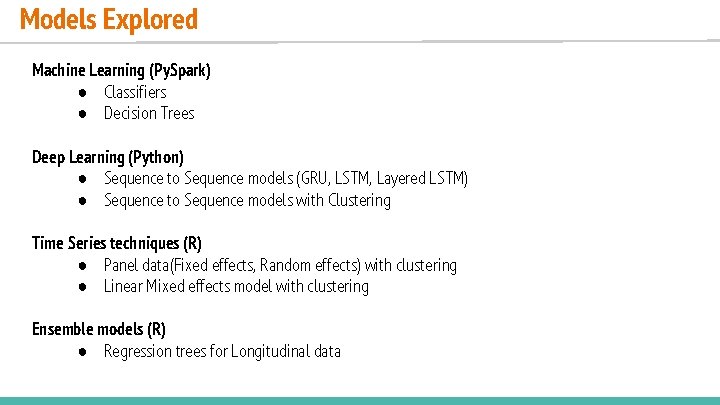
Models Explored Machine Learning (Py. Spark) ● Classifiers ● Decision Trees Deep Learning (Python) ● Sequence to Sequence models (GRU, LSTM, Layered LSTM) ● Sequence to Sequence models with Clustering Time Series techniques (R) ● Panel data(Fixed effects, Random effects) with clustering ● Linear Mixed effects model with clustering Ensemble models (R) ● Regression trees for Longitudinal data
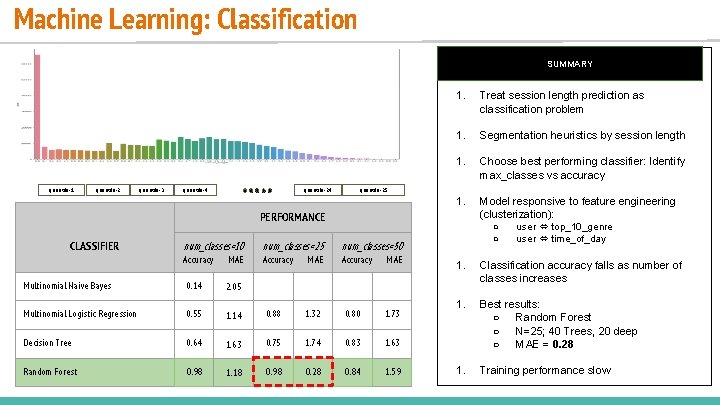
Machine Learning: Classification SUMMARY quantile-1 quantile-2 quantile-3 quantile-4 quantile-24 1. Treat session length prediction as classification problem 1. Segmentation heuristics by session length 1. Choose best performing classifier: Identify max_classes vs accuracy 1. Model responsive to feature engineering (clusterization): quantile-25 PERFORMANCE CLASSIFIER num_classes=10 Accuracy MAE num_classes=25 Accuracy MAE ○ ○ num_classes=30 Accuracy MAE Multinomial Naive Bayes 0. 14 2. 05 Multinomial Logistic Regression 0. 55 1. 14 0. 88 1. 32 0. 80 1. 73 Decision Tree 0. 64 1. 63 0. 75 1. 74 0. 83 1. 63 Random Forest 0. 98 1. 18 0. 98 0. 28 0. 84 1. 59 user ⇔ top_10_genre user ⇔ time_of_day 1. Classification accuracy falls as number of classes increases 1. Best results: ○ Random Forest ○ N=25; 40 Trees, 20 deep ○ MAE = 0. 28 1. Training performance slow
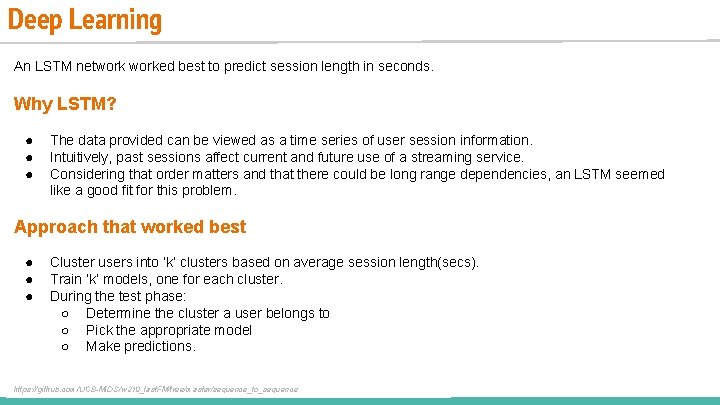
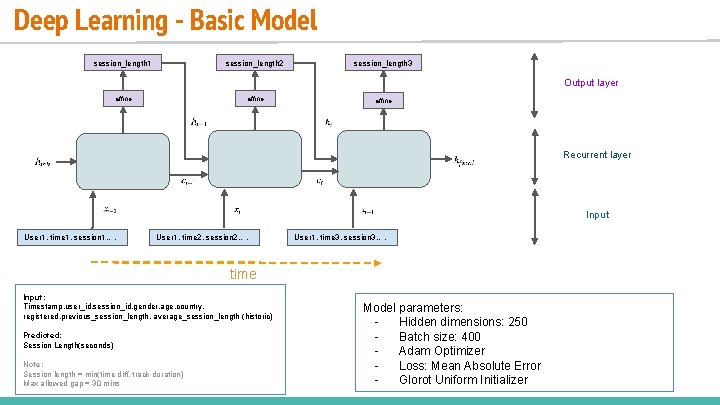
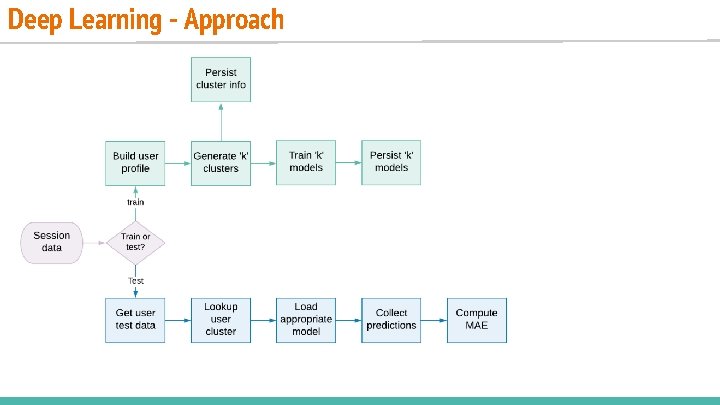
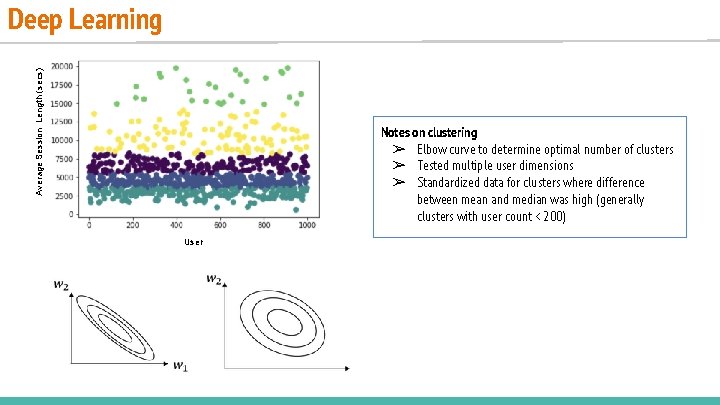
Deep Learning An LSTM networked best to predict session length in seconds. Why LSTM? ● ● ● The data provided can be viewed as a time series of user session information. Intuitively, past sessions affect current and future use of a streaming service. Considering that order matters and that there could be long range dependencies, an LSTM seemed like a good fit for this problem. Approach that worked best ● ● ● Cluster users into ‘k’ clusters based on average session length(secs). Train ‘k’ models, one for each cluster. During the test phase: ○ Determine the cluster a user belongs to ○ Pick the appropriate model ○ Make predictions. https: //github. com/UCB-MIDS/w 210_last. FM/tree/master/sequence_to_sequence
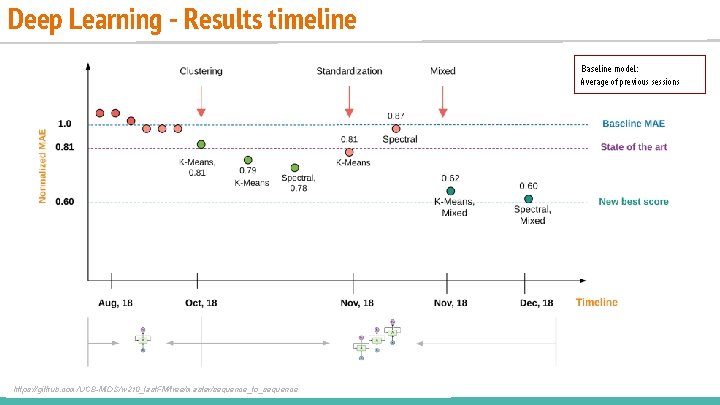
Deep Learning - Results timeline Baseline model: Average of previous sessions https: //github. com/UCB-MIDS/w 210_last. FM/tree/master/sequence_to_sequence
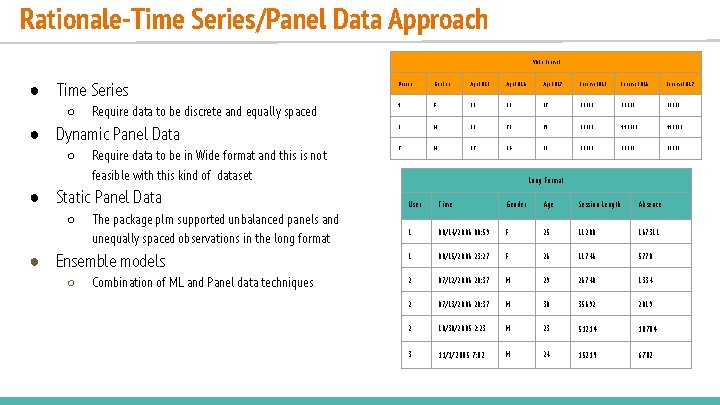
Rationale-Time Series/Panel Data Approach Wide Format ● Time Series ○ Require data to be discrete and equally spaced ● Dynamic Panel Data ○ Require data to be in Wide format and this is not feasible with this kind of dataset ● Static Panel Data ○ The package plm supported unbalanced panels and unequally spaced observations in the long format ● Ensemble models ○ Combination of ML and Panel data techniques Person Gender Age 2015 Age 2016 Age 2017 Income 2015 Income 2016 Income 2017 1 F 25 26 27 60000 65000 80000 2 M 29 30 31 85000 112000 115000 3 M 23 24 25 50000 55000 60000 Long Format User Time Gender Age Session Length Absence 1 08/14/2006 00: 59 F 25 11200 167311 1 08/15/2006 23: 27 F 26 11746 5778 2 07/12/2006 20: 37 M 29 26740 1334 2 07/13/2006 20: 37 M 30 35692 2819 2 10/30/2005 2: 23 M 23 51214 10704 3 11/1/2005 7: 02 M 24 15219 6782
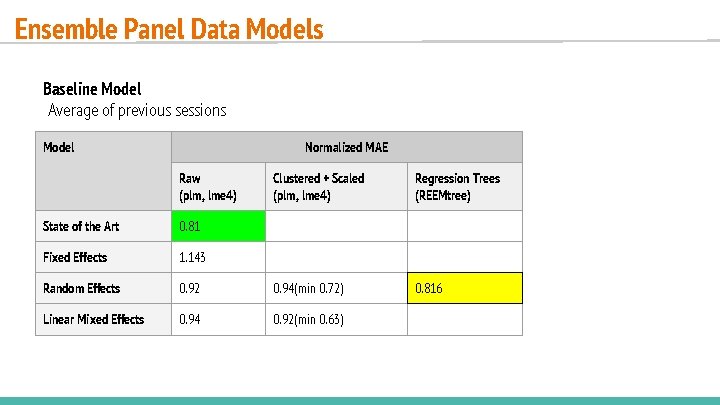
Ensemble Panel Data Models Baseline Model Average of previous sessions Model Normalized MAE Raw (plm, lme 4) Clustered + Scaled (plm, lme 4) Regression Trees (REEMtree) 0. 816 State of the Art 0. 81 Fixed Effects 1. 143 Random Effects 0. 92 0. 94(min 0. 72) Linear Mixed Effects 0. 94 0. 92(min 0. 63)
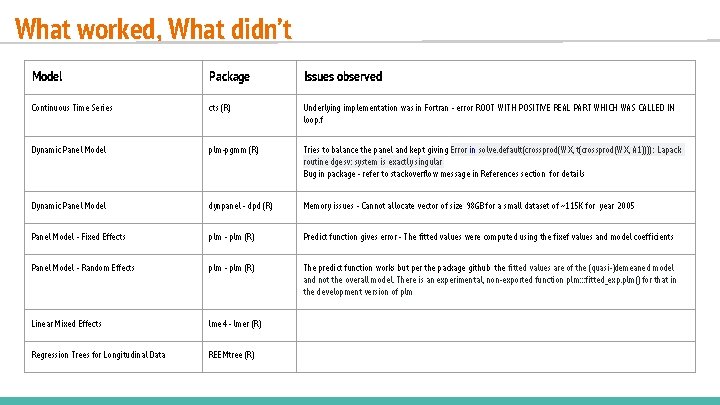
What worked, What didn’t Model Package Issues observed Continuous Time Series cts (R) Underlying implementation was in Fortran - error ROOT WITH POSITIVE REAL PART WHICH WAS CALLED IN loop. f Dynamic Panel Model plm-pgmm (R) Tries to balance the panel and kept giving Error in solve. default(crossprod(WX, A 1)))) : Lapack routine dgesv: system is exactly singular Bug in package - refer to stackoverflow message in References section for details Dynamic Panel Model dynpanel - dpd (R) Memory issues - Cannot allocate vector of size 98 GB for a small dataset of ~115 K for year 2005 Panel Model - Fixed Effects plm - plm (R) Predict function gives error - The fitted values were computed using the fixef values and model coefficients Panel Model - Random Effects plm - plm (R) The predict function works but per the package github the fitted values are of the (quasi-)demeaned model and not the overall model. There is an experimental, non-exported function plm: : : fitted_exp. plm() for that in the development version of plm Linear Mixed Effects lme 4 - lmer (R) Regression Trees for Longitudinal Data REEMtree (R)
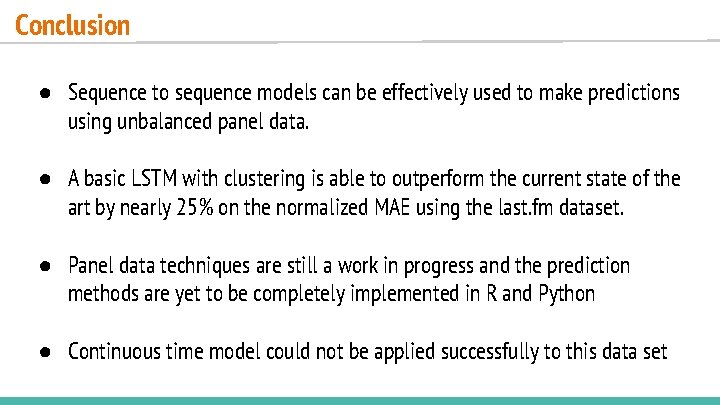
Conclusion ● Sequence to sequence models can be effectively used to make predictions using unbalanced panel data. ● A basic LSTM with clustering is able to outperform the current state of the art by nearly 25% on the normalized MAE using the last. fm dataset. ● Panel data techniques are still a work in progress and the prediction methods are yet to be completely implemented in R and Python ● Continuous time model could not be applied successfully to this data set
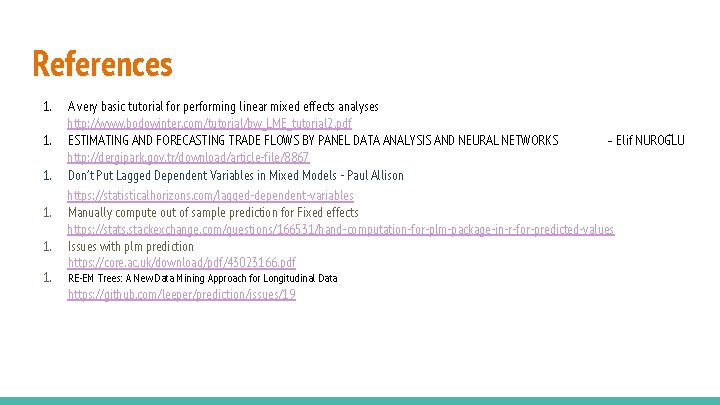
References 1. 1. 1. A very basic tutorial for performing linear mixed effects analyses http: //www. bodowinter. com/tutorial/bw_LME_tutorial 2. pdf ESTIMATING AND FORECASTING TRADE FLOWS BY PANEL DATA ANALYSIS AND NEURAL NETWORKS - Elif NUROG LU http: //dergipark. gov. tr/download/article-file/8867 Don’t Put Lagged Dependent Variables in Mixed Models - Paul Allison https: //statisticalhorizons. com/lagged-dependent-variables Manually compute out of sample prediction for Fixed effects https: //stats. stackexchange. com/questions/166531/hand-computation-for-plm-package-in-r-for-predicted-values Issues with plm prediction https: //core. ac. uk/download/pdf/43023166. pdf RE-EM Trees: A New Data Mining Approach for Longitudinal Data https: //github. com/leeper/prediction/issues/19
Acknowledgements Thank you to: ○ Prof. Vahabi and Prof. Todeschini for their guidance and support ○ Simon Storey for his help in debugging the problem with the pgmm package and suggestions for the model
Backup
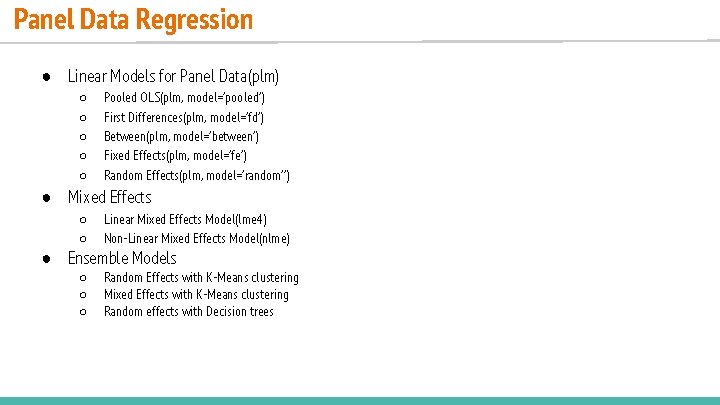
Panel Data Regression ● Linear Models for Panel Data(plm) ○ ○ ○ Pooled OLS(plm, model=’pooled’) First Differences(plm, model=’fd’) Between(plm, model=’between’) Fixed Effects(plm, model=’fe’) Random Effects(plm, model=’random’’) ● Mixed Effects ○ ○ Linear Mixed Effects Model(lme 4) Non-Linear Mixed Effects Model(nlme) ○ ○ ○ Random Effects with K-Means clustering Mixed Effects with K-Means clustering Random effects with Decision trees ● Ensemble Models
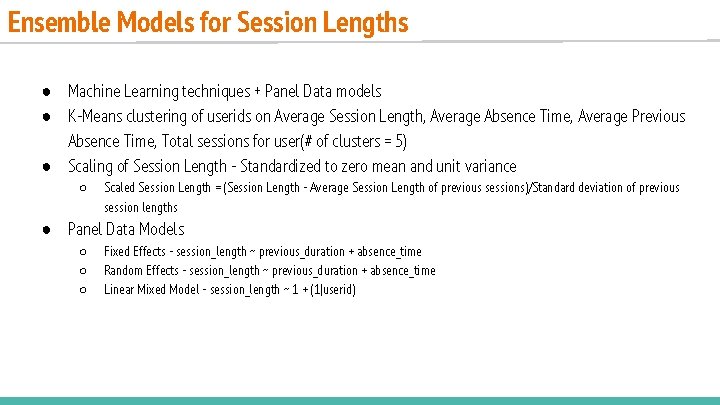
Ensemble Models for Session Lengths ● Machine Learning techniques + Panel Data models ● K-Means clustering of userids on Average Session Length, Average Absence Time, Average Previous Absence Time, Total sessions for user(# of clusters = 5) ● Scaling of Session Length - Standardized to zero mean and unit variance ○ Scaled Session Length = (Session Length - Average Session Length of previous sessions)/Standard deviation of previous session lengths ● Panel Data Models ○ ○ ○ Fixed Effects - session_length ~ previous_duration + absence_time Random Effects - session_length ~ previous_duration + absence_time Linear Mixed Model - session_length ~ 1 + (1|userid)
Deep Learning - Basic Model session_length 1 session_length 2 session_length 3 Output layer affine Recurrent layer Input User 1, time 1, session 1…. User 1, time 2, session 2…. User 1, time 3, session 3…. time Input: Timestamp, user_id, session_id, gender, age, country, registered, previous_session_length, average_session_length (historic) Predicted: Session Length(seconds) Note: Session length = min(time diff, track duration) Max allowed gap = 30 mins Model parameters: Hidden dimensions: 250 Batch size: 400 Adam Optimizer Loss: Mean Absolute Error Glorot Uniform Initializer
Deep Learning - Approach
Average Session Length (secs) Deep Learning Notes on clustering ➢ Elbow curve to determine optimal number of clusters ➢ Tested multiple user dimensions ➢ Standardized data for clusters where difference between mean and median was high (generally clusters with user count < 200) User