Role of Raman Spectroscopy in Bio Agriculture Mushtaq

Role of Raman Spectroscopy in Bio & Agriculture Mushtaq Ahmed National Institute of Lasers and Optronics (NILOP)

Raman Spectroscopy Outline ● Introduction ● Applications o o o Food Geology Gemology Material Medical ● Raman Spectroscopic activities at NILOP

Raman Spectroscopy History ● 1923 – Inelastic light scattering predicted by A. Smekel ● 1928 – Landsberg and Mandelstam see unexpected frequency shifts in scattering from quartz ● 1928 – C. V. Raman and K. S. Krishnan see “feeble fluorescence” from neat solvents ● 1930 – C. V. Raman wins Nobel Prize in Physics ● 1961 – Invention of laser makes Raman experiments reasonable ● 1977 – Surface-enhanced Raman scattering (SERS) is discovered ● 1997 – Single molecule SERS is possible Filtered Hg arc lamp spectrum C 6 H 6 Scattering First Raman Spectra

Raman Spectroscopy Layout of Original Raman Experiment q Presently used dispersive Raman system lay out Precise measurements were made with this quartz spectrograph and first made public by Raman in a lecture in Bangalore on March 16, 1928.

Raman Spectroscopy Raman Scattering Selection rule: Dv = ± 1 Overtones: Dv = ± 2, ± 3, … Incident Light Must also have a change in polarizability Classical Description does not suggest any difference between Stokes and Anti-Stokes intensities Scattered Light

Raman Spectroscopy When light interacts with a vibrating diatomic molecule, the induced dipole moment has 3 components: Rayleigh scatter Anti-Stokes Raman scatter
 – Raman scattering cross-section")
Raman Spectroscopy Raman Intensities Radiant power of Raman scattering: s(nex) – Raman scattering cross-section (cm 2) nex – excitation frequency E 0 – incident beam irradiance ni – number density in state i exponential – Boltzmann factor for state i s(nex) - target area presented by a molecule for scattering

Raman Spectroscopy 1 in 107 photons is scattered in elastically Rotational Raman Vibrational Raman Electronic Raman Scattered Excitation virtual state v” = 1 v” = 0 Infrared Raman (absorption) (scattering)
 absorption UV 10")
Raman Spectroscopy Raman scattering Cross-Sections Process Cross-Section of s (cm 2) absorption UV 10 -18 absorption IR 10 -21 emission Fluorescence 10 -19 scattering Rayleigh 10 -26 scattering Raman 10 -29 scattering RR 10 -24 scattering SERRS 10 -15 scattering SERS 10 -16 s(nex) - target area presented by a molecule for scattering q Table adapted from Aroca, Surface Enhanced Vibrational Spectroscopy, 2006
 s ( x 10 -28 cm 2)")
Raman Spectroscopy Raman scattering Cross-Sections lex (nm) s ( x 10 -28 cm 2) 532. 0 0. 66 435. 7 1. 66 368. 9 3. 76 355. 0 4. 36 319. 9 7. 56 282. 4 13. 06 CHCl 3: C-Cl stretch at 666 cm-1 q Table adapted from Aroca, Surface Enhanced Vibrational Spectroscopy, 2006

Raman Spectroscopy Raman Strength & Limitations ● Easily identify chemical structure – (Figure print technique) ● Widely applicable for various materials. ● Samples can be solid or aqueous (water is a weak Raman scattered) ● Little or no simple preparation required ● Non-invasive, non-destructive method. ● Remote control with the fiber optics ● ● ● Fluorescence especially when the incident light goes to blue Technique and cost or laser sources Low excitation probability : 1 per 107 or 108 Specially refrained by optical limit Distanced Raman

Raman Spectroscopy Raman Spectroscopic Applications

Raman Spectroscopy Applications in Daily Life ● Fingerprinting the universe ● Advantages: o Fingerprint spectra (molecular signature) o Structural orientation/conformation o Intermolecular interactions ● Laser-based spectroscopy ● Small sample size (0. 5 – 1. 0 L) – Clinical use ● Test low concentration samples (single molecule sensitivity) ● Used in detecting explosives, nuclear waste, water pollution, etc. Useful for police officers, medical staff, forensic scientists

Raman Spectroscopy Raman Applications Moving from Discovery to Practice ● ● ● Pharmaceutical/Biomedical Material Science/Nanotechnology Forensic/anti-crime/anti-terrorism Gemmology/geology/mineralogy Archaeology/art/heritage ● ● ● Easily identify chemical structure-finger print technique Widely applicable for various materials Simples can be solid or aqueous (water is a weak Raman scattered) Little or no simple preparation required. Non-invasive, non-destructive method. Remote control with fiber optics ………. Anywhere need identifications with close proximity between inspecting tools (including fiver laser source and examples.

Raman Spectroscopy Raman Morphological Model Basis Spectra

Raman Spectroscopy Raman spectroscopy of Breast Normal & Cancerous Tissue

Raman Spectroscopy in Food Sciences

Raman Spectroscopy Material Science

Raman Spectroscopy X-Rays Analysis & Raman Spectroscopy

Raman Spectroscopy Raman Spectroscopic Activities at NILOP

Raman Spectroscopy Raman spectrometer with microscope

Raman Spectroscopy Raman signal intensity Raman Spectra of Leaf Normal & Rusted Raman shift (cm-1)

Raman Spectroscopy Raman spectra of male and female feather Male Feather Female Feather

Raman Spectroscopy Raman Spectra – Edible oils, spreads and ghee Raman intensity (a. u. ) Desi ghee (home made), Desi ghee (market), Banaspati ghee (I, III) Cooking oil, Sunflower oil, Canola oil, Canolive oil, Olive oil Margarine, sunflower spread, Rapeseed spread, Lurpak spread, Extra virgin olive oil spread Raman shift (cm-1)
 % Raman Spectra – Edible oils, Spreads")
Raman Spectroscopy Second principal component (20. 2) % Raman Spectra – Edible oils, Spreads and Ghee Desi ghee (home made) Desi ghee (market) Banaspati ghee (II) Banaspati ghee (III) Mmargarine Sunflower spread Canola and sunflower spread Rapeseed spread Extra virgin olive oil spread Cooking oil (blend of can, soy, sun) Sunflower oil Canola oil Canolive oil (blend of olive, canola, sun) Olive oil First principal component (45. 3) %
")
Raman Spectroscopy Diagnosis of Hepatitis C blood Serum (body fluids)

Raman Spectroscopy Diagnosis of Hepatitis C Principal Component Analysis Normal blood sera samples HCV infected blood sera samples First principal component (68. 1 %)
")
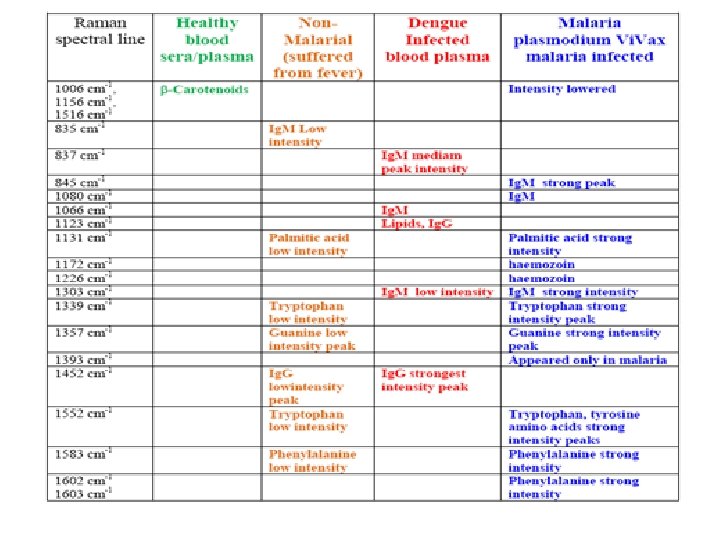
Raman Spectroscopy Diagnosis of Dengue Virus Infection & Malaria in blood serum (body fluids) q Journal of Biomedical Optics 20(1), 017002 (January 2015)
 and Pure Lactate (Red)")
Raman Spectroscopy Raman Spectra of normal Sera (green) and Pure Lactate (Red)

Raman Spectroscopy Raman Spectra of normal Blood Sera with addition of Lactate

Raman Spectroscopy Non-invasive Diagnosis of Malaria Using Laser Transdermal Detection

Raman Spectroscopy Non-invasive Diagnosis of Malaria Using Laser Transdermal Detection Laser Parameters: § Wavelength: nm § Pulse: § Fluence: 532 200 ps 36 m. J/cm 2 q Acoustic traces obtained in vitro in response to a single laser pulse exposure

Raman Spectroscopy Collaboration ● ● ● ● NORI Hospital Islamabad PAEC General Hospital Islamabad IRNOM Hospital Peshawar Mayo Hospital Lahore Institute of Public Health Lahore Holy Family Hospital Department Biotechnology QAU Islamabad National Institute of Physics (Nano-medicine) NARC (National Agricultural Research Council) NIA (Nuclear Institute of Agriculture) NIFA (National Institute of Food and Agriculture) NIBGE (National Institute for Biotechnology and Genetic Engineering) NIAB (Nuclear Institute of Agriculture and Biology) Institute of Photonics Technology GENA Germany Biophotonics Group, Lund University Seweden

Raman Spectroscopy International research collaborators Prof. Dr. Stefan Andersson-Engels Biophotonics Group, Atomic Physics Division, Lund University, Sweden. Prof. Dr. Jürgen Popp Institute of Photonic Technology (IPHT), Institute of Physical Chemistry and Abbe Center of Photonics, Jena University, Germany. Prof. Vanderlei Salvador Bagnato Universidade de São Paulo - Instituto de Física de São Carlos

Thanks for listening Welcome for Research collaboration Light for Health
- Slides: 36