SCH 502 DISTILLATION PROF HELEN NJENGA University of

- Slides: 35
SCH 502 DISTILLATION PROF. HELEN NJENGA University of Nairobi ISO 9001: 2008 1 Certified http: //www. uonbi. ac. ke
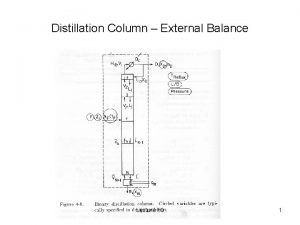
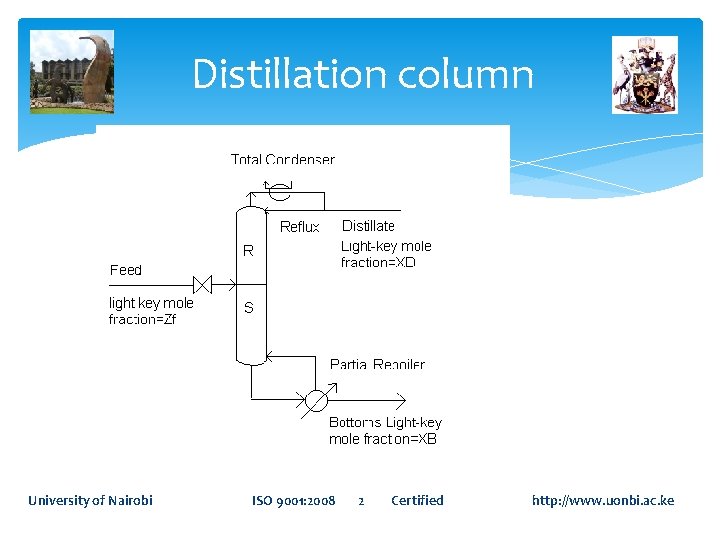
Distillation column University of Nairobi ISO 9001: 2008 2 Certified http: //www. uonbi. ac. ke
The distillation column contains one feed stream and two product streams. The feed contains a mole percent of the light component, XF. The product stream exiting the top has a composition of XD of the light component. The product stream leaving the bottom contains a composition of XB of the light component. University of Nairobi ISO 9001: 2008 3 Certified http: //www. uonbi. ac. ke
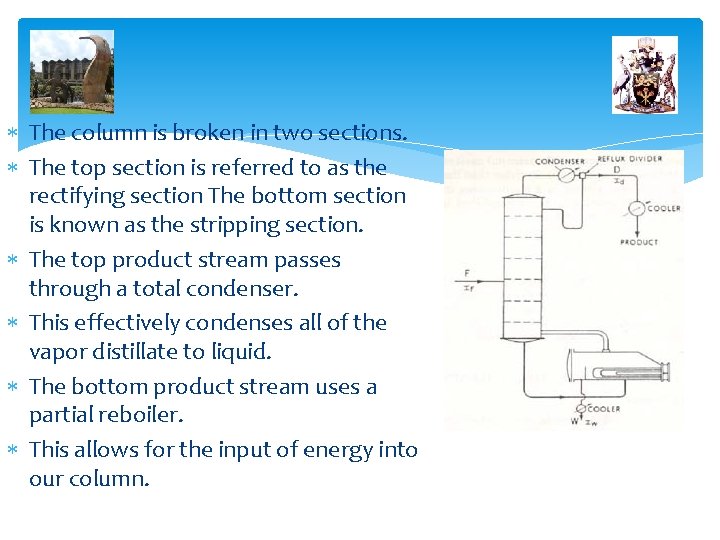
The column is broken in two sections. The top section is referred to as the rectifying section The bottom section is known as the stripping section. The top product stream passes through a total condenser. This effectively condenses all of the vapor distillate to liquid. The bottom product stream uses a partial reboiler. This allows for the input of energy into our column.
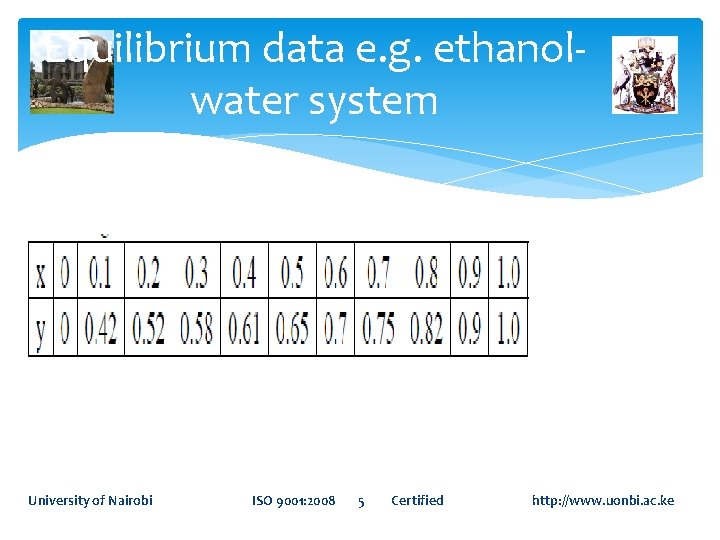
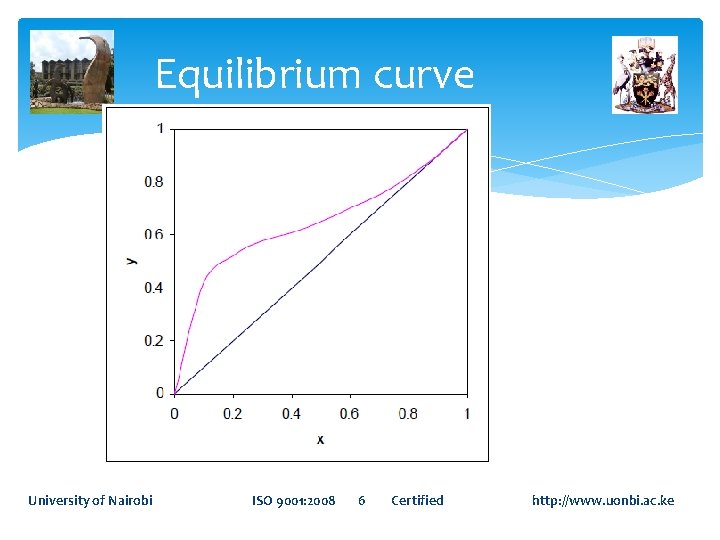
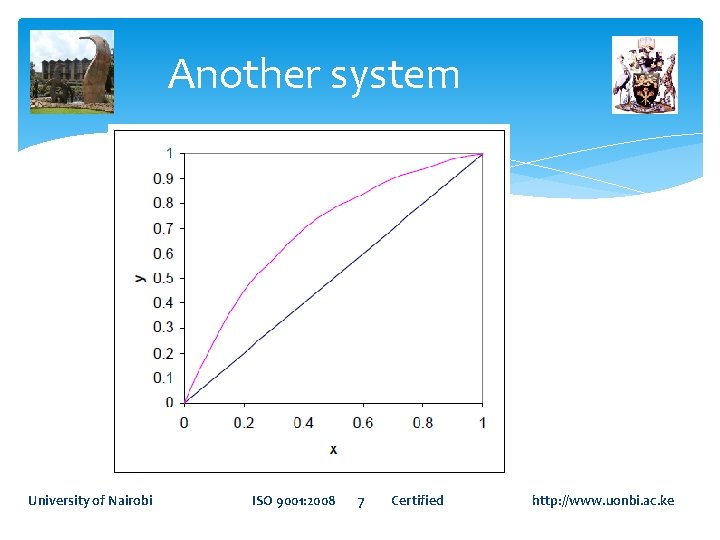
Equilibrium data e. g. ethanolwater system University of Nairobi ISO 9001: 2008 5 Certified http: //www. uonbi. ac. ke
Equilibrium curve University of Nairobi ISO 9001: 2008 6 Certified http: //www. uonbi. ac. ke
Another system University of Nairobi ISO 9001: 2008 7 Certified http: //www. uonbi. ac. ke
Rectification Multiple stages with reflux. On each stage the liquid and vapor flow countercurrently, are mixed ideally equilibrated on each stage. The final vapor coming from overhead contains high concentration of the more volatile component (M. V. C. ), is condensed A portion of it is removed as top product, while the remaining liquid is returned to the top tray of the column as reflux liquid. University of Nairobi ISO 9001: 2008 8 Certified http: //www. uonbi. ac. ke
Stripping The liquid leaving the bottom, which is less in the M. V. C. or in other words rich of the less volatile component (L. V. C. ), is withdrawn as bottom product Portion of this product is evaporated in the re-boiler and sent back to the bottom stage (or tray) University of Nairobi ISO 9001: 2008 9 Certified http: //www. uonbi. ac. ke
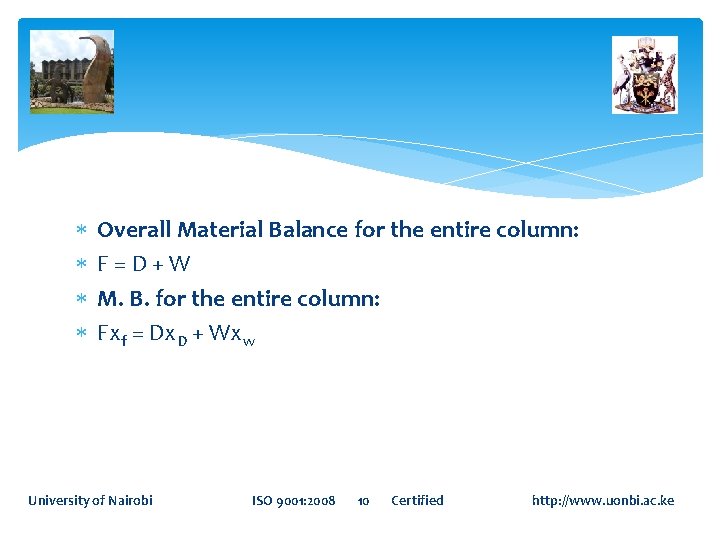
Overall Material Balance for the entire column: F=D+W M. B. for the entire column: Fxf = Dx. D + Wxw University of Nairobi ISO 9001: 2008 10 Certified http: //www. uonbi. ac. ke
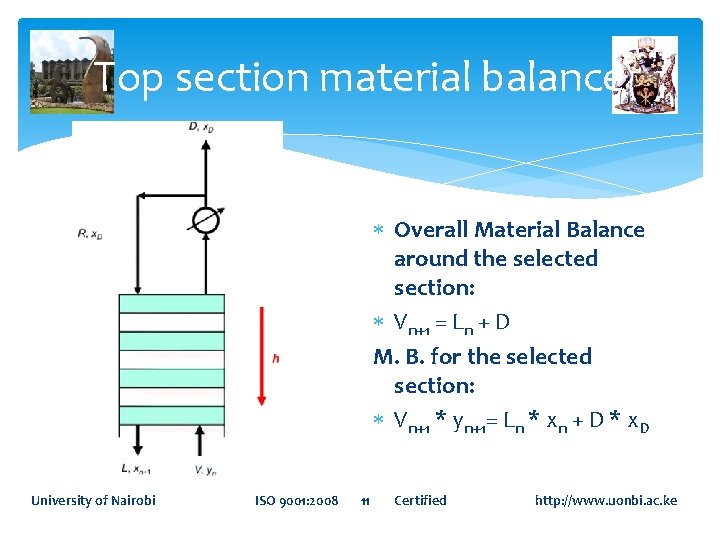
Top section material balance Overall Material Balance around the selected section: Vn+1 = Ln + D M. B. for the selected section: Vn+1 * yn+1= Ln * xn + D * x. D University of Nairobi ISO 9001: 2008 11 Certified http: //www. uonbi. ac. ke
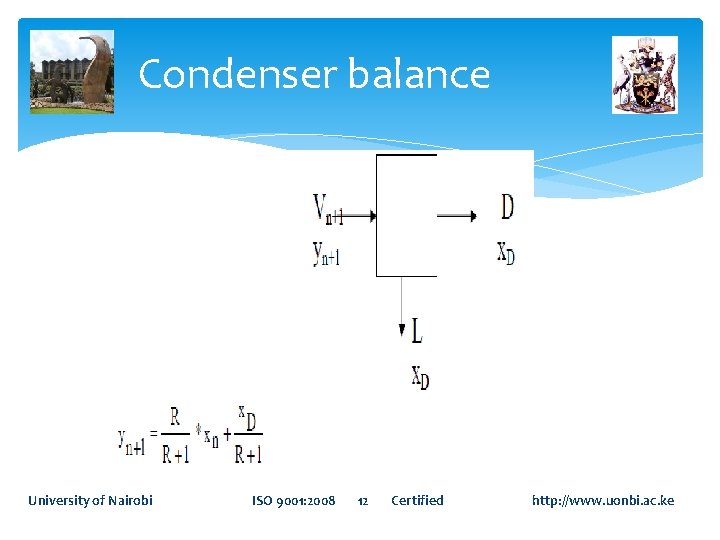
Condenser balance University of Nairobi ISO 9001: 2008 12 Certified http: //www. uonbi. ac. ke
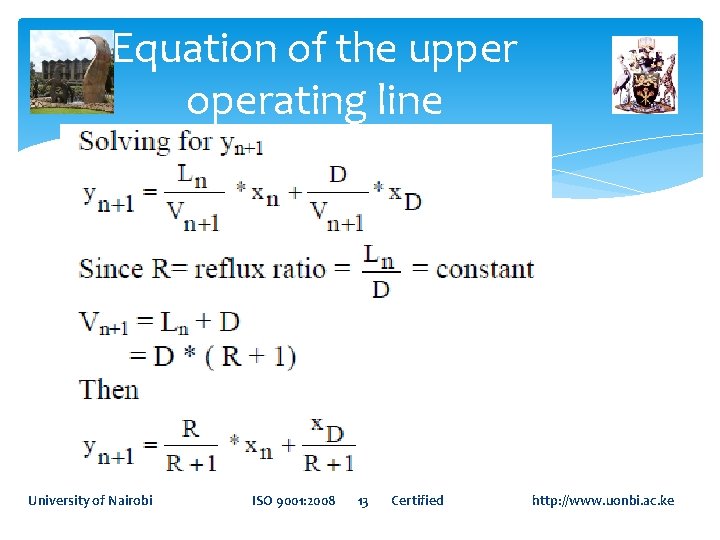
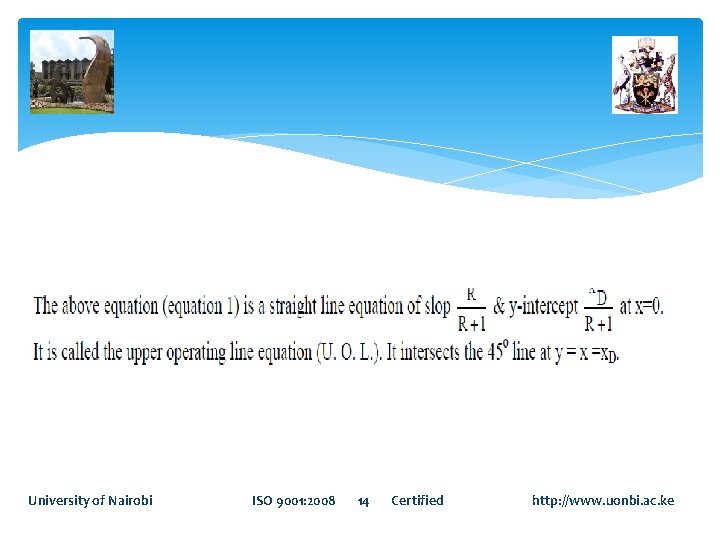
Equation of the upper operating line University of Nairobi ISO 9001: 2008 13 Certified http: //www. uonbi. ac. ke
University of Nairobi ISO 9001: 2008 14 Certified http: //www. uonbi. ac. ke
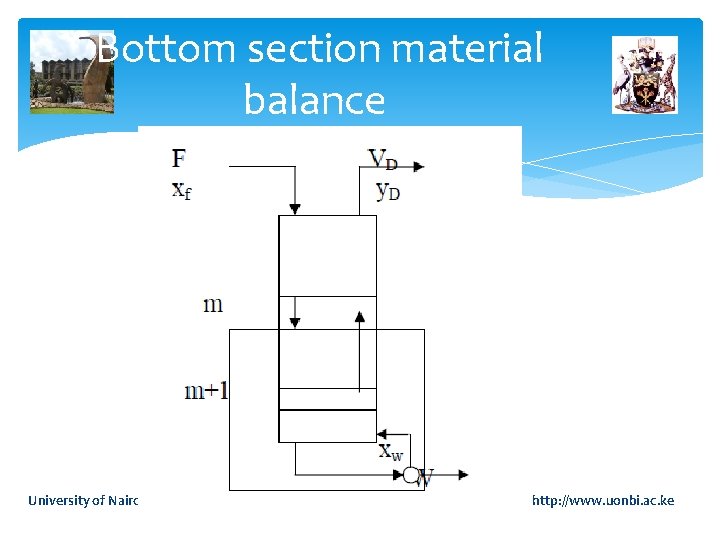
Bottom section material balance University of Nairobi ISO 9001: 2008 15 Certified http: //www. uonbi. ac. ke
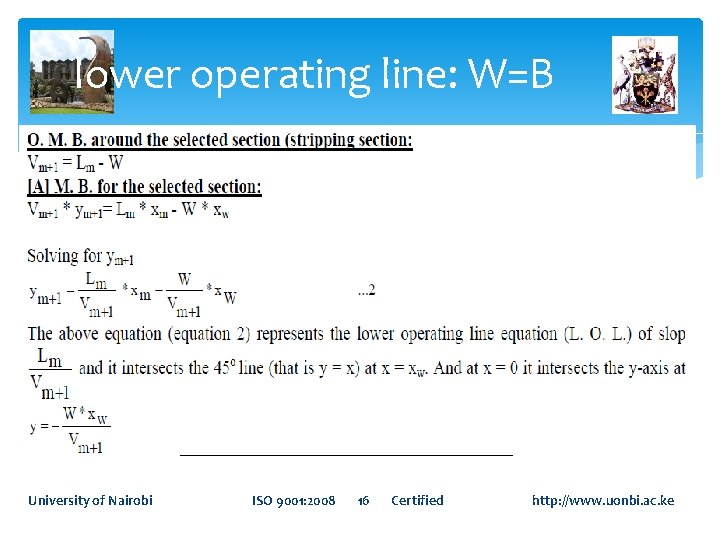
lower operating line: W=B University of Nairobi ISO 9001: 2008 16 Certified http: //www. uonbi. ac. ke
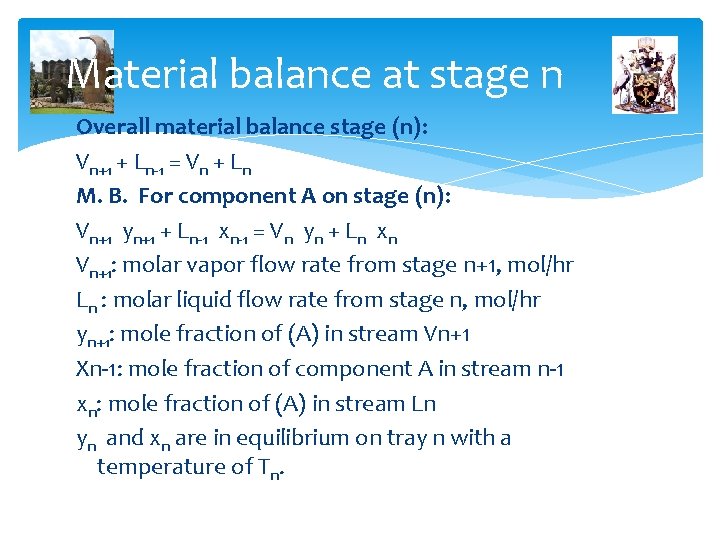
Material balance at stage n Overall material balance stage (n): Vn+1 + Ln-1 = Vn + Ln M. B. For component A on stage (n): Vn+1 yn+1 + Ln-1 xn-1 = Vn yn + Ln xn Vn+1: molar vapor flow rate from stage n+1, mol/hr Ln : molar liquid flow rate from stage n, mol/hr yn+1: mole fraction of (A) in stream Vn+1 Xn-1: mole fraction of component A in stream n-1 xn: mole fraction of (A) in stream Ln yn and xn are in equilibrium on tray n with a temperature of Tn.
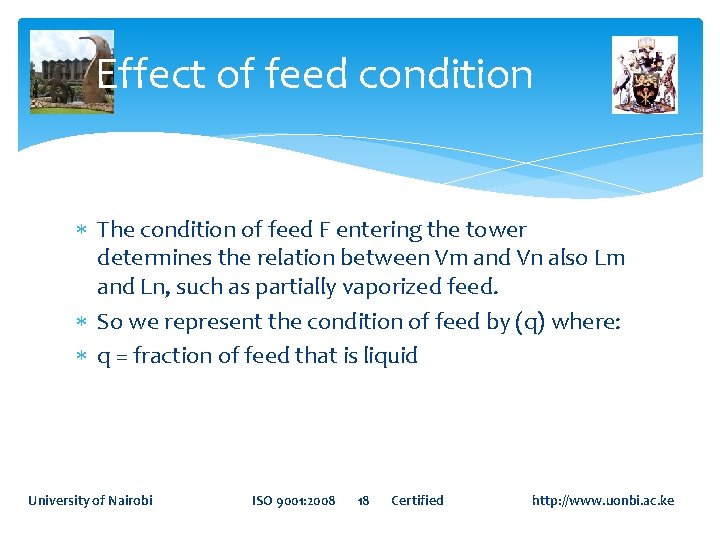
Effect of feed condition The condition of feed F entering the tower determines the relation between Vm and Vn also Lm and Ln, such as partially vaporized feed. So we represent the condition of feed by (q) where: q = fraction of feed that is liquid University of Nairobi ISO 9001: 2008 18 Certified http: //www. uonbi. ac. ke
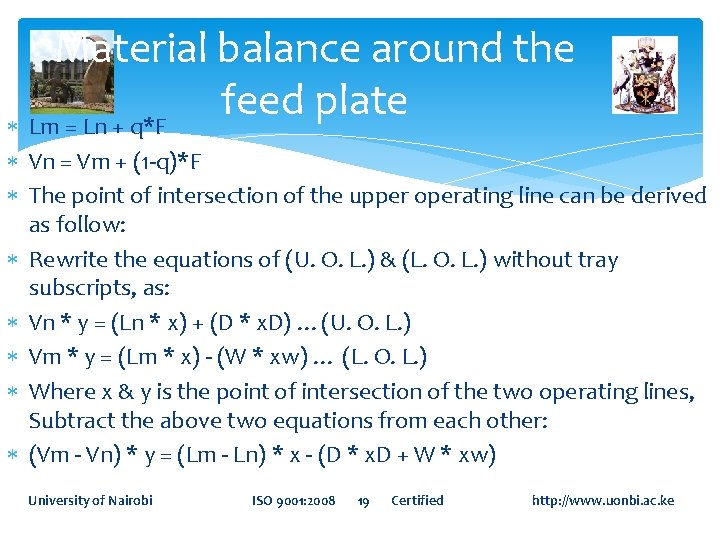
Material balance around the feed plate Lm = Ln + q*F Vn = Vm + (1 -q)*F The point of intersection of the upper operating line can be derived as follow: Rewrite the equations of (U. O. L. ) & (L. O. L. ) without tray subscripts, as: Vn * y = (Ln * x) + (D * x. D) …(U. O. L. ) Vm * y = (Lm * x) - (W * xw) … (L. O. L. ) Where x & y is the point of intersection of the two operating lines, Subtract the above two equations from each other: (Vm - Vn) * y = (Lm - Ln) * x - (D * x. D + W * xw) University of Nairobi ISO 9001: 2008 19 Certified http: //www. uonbi. ac. ke
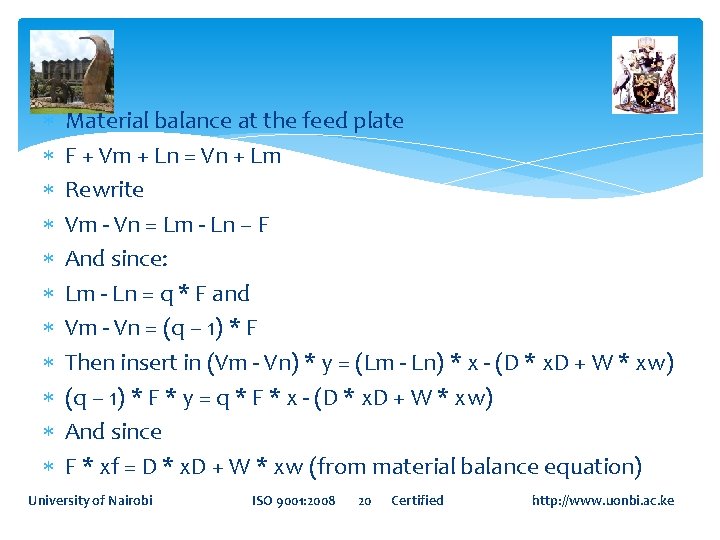
Material balance at the feed plate F + Vm + Ln = Vn + Lm Rewrite Vm - Vn = Lm - Ln – F And since: Lm - Ln = q * F and Vm - Vn = (q – 1) * F Then insert in (Vm - Vn) * y = (Lm - Ln) * x - (D * x. D + W * xw) (q – 1) * F * y = q * F * x - (D * x. D + W * xw) And since F * xf = D * x. D + W * xw (from material balance equation) University of Nairobi ISO 9001: 2008 20 Certified http: //www. uonbi. ac. ke
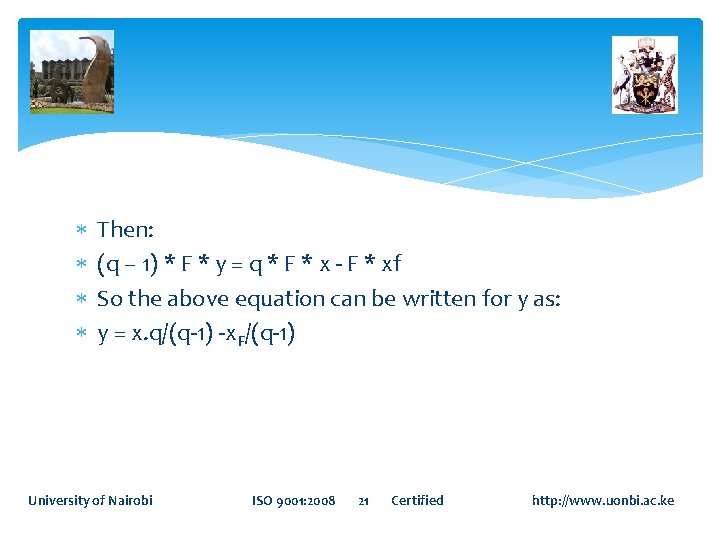
Then: (q – 1) * F * y = q * F * x - F * xf So the above equation can be written for y as: y = x. q/(q-1) -x. F/(q-1) University of Nairobi ISO 9001: 2008 21 Certified http: //www. uonbi. ac. ke
The above equation (equation 3) is the equation of the q-line of slope = q/(q-1) y-intercept =x. F/(q-1) At x = x. F y =x = x. F so this point is plotted on 45 o line. For different states of feed given above, that is if: If the feed enters as saturated vapor, then q = 0, the slope is 0, the q-line is plotted parallel to x-axis from point y = xf. If the feed enters as saturated liquid, then q = 1, the slop is ∞, the q-line is plotted parallel to y-axis from point y = xf. University of Nairobi ISO 9001: 2008 22 Certified http: //www. uonbi. ac. ke
If the feed enters as partially vaporized (mixture of vapor and liquid, then 0< q < 1, the slop is - the q-line is plotted in the second quarter of the axis. If the feed enters as supper heated vapor, then q < 0, the slop is + the q-line is plotted in the third quarter of the axis. If the feed enters as sub-cooled liquid, then q > 1, the slope is + the q-line is plotted in the first quarter of the axis. University of Nairobi ISO 9001: 2008 23 Certified http: //www. uonbi. ac. ke
Location of feed tray and the number of theoretical trays (or stages): Using the equilibrium data, and the equations (1, 2, and 3), the number of theoretical plates and the feed tray can be determined as follow: 1. Complete the material balance so the values of all streams and their composition are known. 2. Plot the equilibrium data. 3. Locate x. D, x. F, xw on the 45 o line. University of Nairobi ISO 9001: 2008 24 Certified http: //www. uonbi. ac. ke
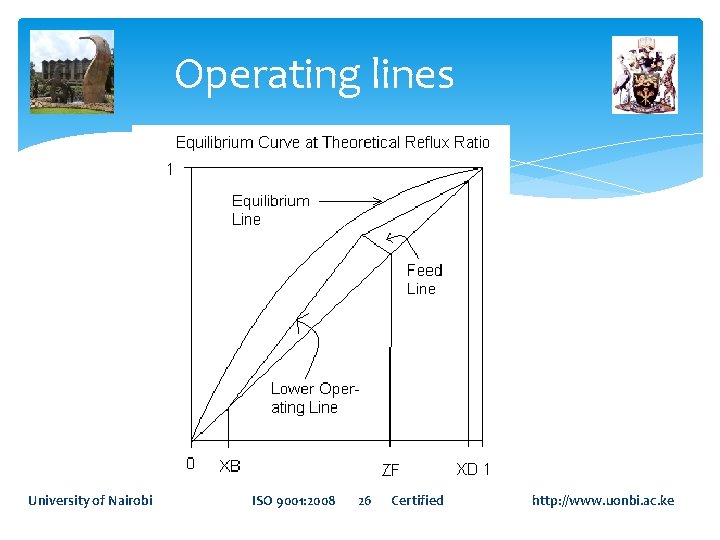
4. Plot the U. O. L. between x. D on the 45 o line & the point (y = x. D/(R+1), x = 0 5. Plot the q-line from the point of xf on the 45 o line with slop of q/(q-1) 6. From the point of intersection of q-line with the U. O. L. draw a line between this point and the point y=x=xw on the 45 o line (L. O. L. ). 7. Either from x. D, or from xw step off the number of theoretical stages. 8. Locate the feed plate from the figure. University of Nairobi ISO 9001: 2008 25 Certified http: //www. uonbi. ac. ke
Operating lines University of Nairobi ISO 9001: 2008 26 Certified http: //www. uonbi. ac. ke
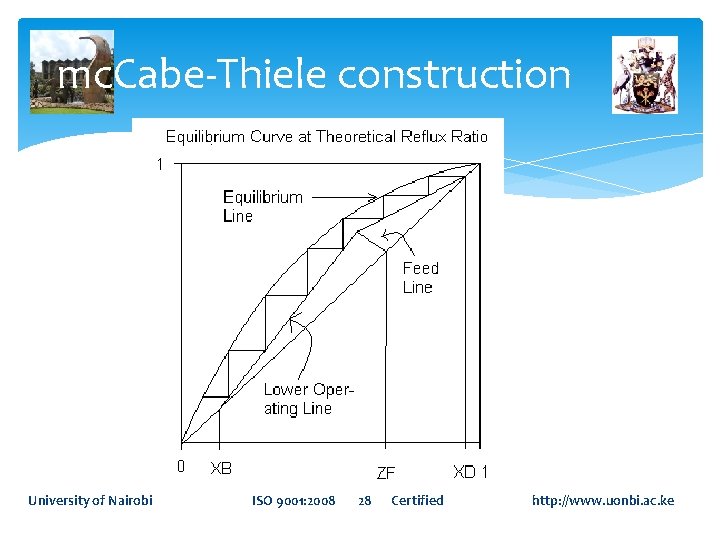
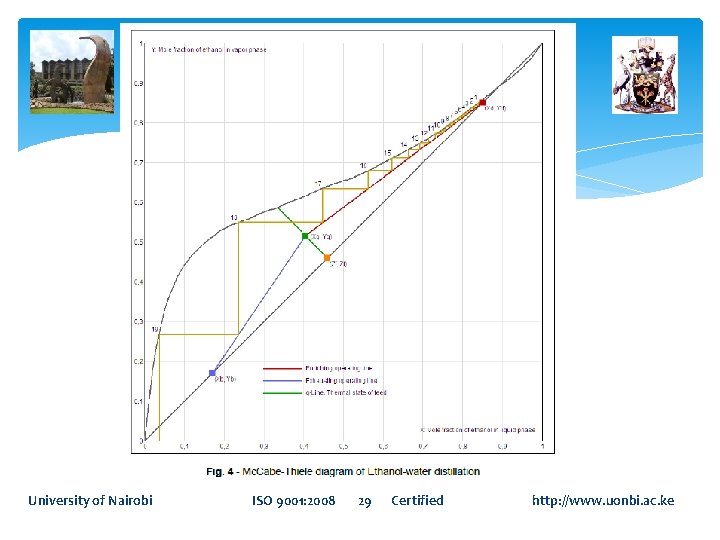
Determine Number of Trays Mc. Cabe-Thiele method 1. Starting from composition of the distillate, a horizontal line is drawn to the equilibrium curve. This line demonstrates the first tray. 2. From the previous intersection, drop vertically until the upper operating line is obtained. 3. Follow step two to determine next tray. 4. Continue stepping until the liquid composition ends equals the desired bottom composition. 5. The total number of steps is equal to theoretical number of trays. University of Nairobi ISO 9001: 2008 27 Certified http: //www. uonbi. ac. ke
mc. Cabe-Thiele construction University of Nairobi ISO 9001: 2008 28 Certified http: //www. uonbi. ac. ke
University of Nairobi ISO 9001: 2008 29 Certified http: //www. uonbi. ac. ke
Actual number of plates This is determined by taking the quotient of the number of theoretical trays to the tray efficiency. Typical values for tray efficiency ε range from 0. 5 to 0. 7 (Douglas, 1988). These values depend on the type of trays being used, as well as the internal liquid and vapor flow rates. Nactual = Ntheory /ε University of Nairobi ISO 9001: 2008 30 Certified http: //www. uonbi. ac. ke
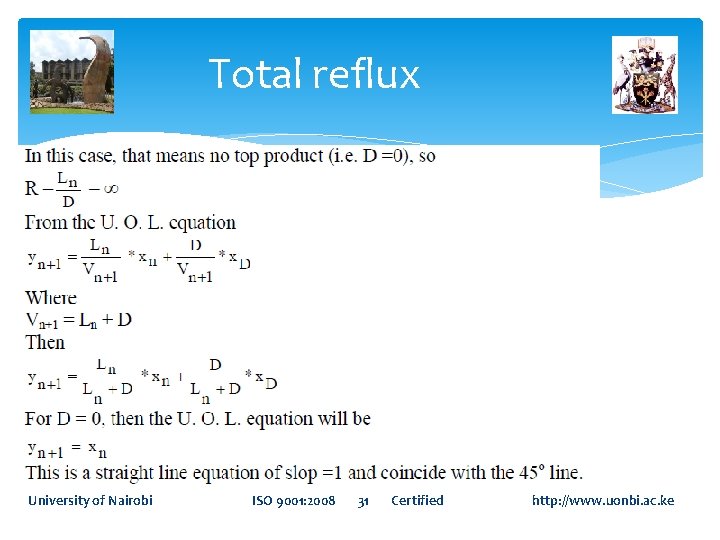
Total reflux University of Nairobi ISO 9001: 2008 31 Certified http: //www. uonbi. ac. ke
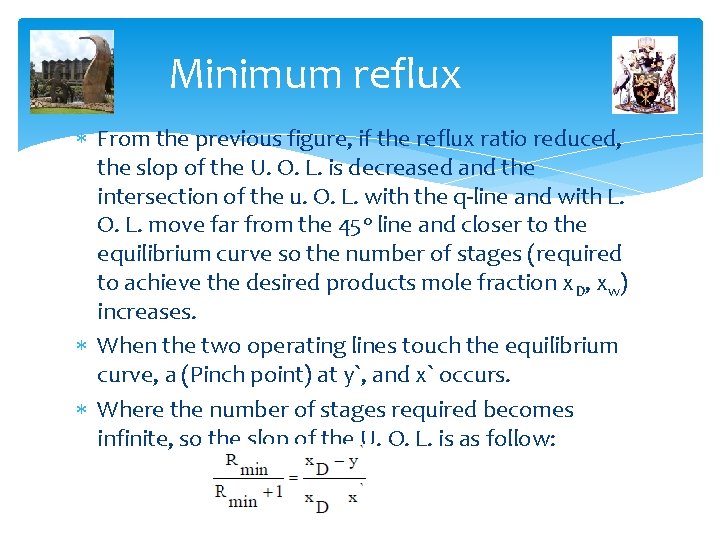
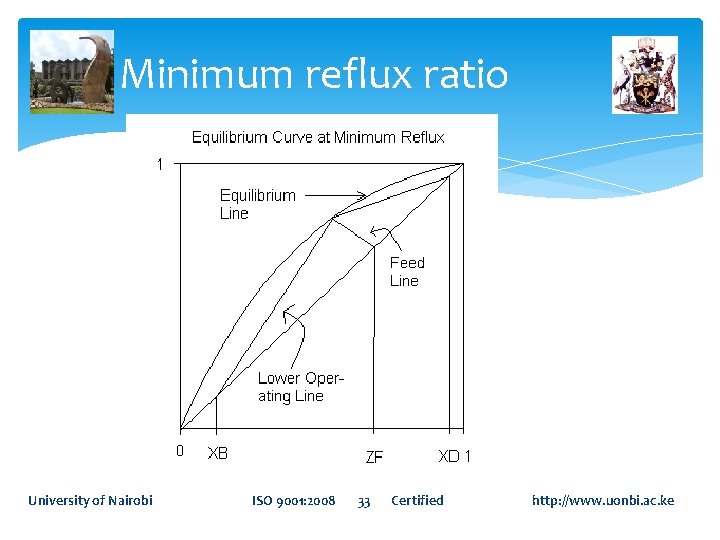
Minimum reflux From the previous figure, if the reflux ratio reduced, the slop of the U. O. L. is decreased and the intersection of the u. O. L. with the q-line and with L. O. L. move far from the 45 o line and closer to the equilibrium curve so the number of stages (required to achieve the desired products mole fraction x. D, xw) increases. When the two operating lines touch the equilibrium curve, a (Pinch point) at y`, and x` occurs. Where the number of stages required becomes infinite, so the slop of the U. O. L. is as follow:
Minimum reflux ratio University of Nairobi ISO 9001: 2008 33 Certified http: //www. uonbi. ac. ke
Optimum reflux As the reflux ratio increases, the number of trays and thus the capital cost of the column decreases. However, as a trade-off, an increase in reflux ratio will also increase the vapor rate within the tower, thus increasing expenses such as condensers and reboilers Most columns are designed to operate between 1. 2 and 1. 5 times the minimum reflux ratio because this is approximately the region of minimum operating cost. University of Nairobi ISO 9001: 2008 34 Certified http: //www. uonbi. ac. ke
Principal Dimensions of the Column (Diameter/Height) · A design guideline that should be used is that the height of the column should not be higher than 175 feet. Height-to-diameter ratio should be less than 20 to 30. · Packed towers are used when the column has a small diameter (1. 5 ft or less) or area (1. 77 ft 2 or less) rather than plate towers. · Either plate or packed towers may be used when the column diameter isbetween 1. 5 -4. 5 ft (or area, 1. 7715. 9 ft 2). · If the tower is higher than 190 ft, then a design with smaller tray spacing should be· University of Nairobi ISO 9001: 2008 35 Certified http: //www. uonbi. ac. ke