Russia and Eastern Europe Natalia S Gavrilova Leonid








- Slides: 74
Russia and Eastern Europe Natalia S. Gavrilova Leonid A. Gavrilov Center on Aging NORC and The University of Chicago, Illinois, USA
Russia now n n n The largest country in the world by the area (United States is the 3 rd) The 2 nd country by the number of immigrants (after the United States) The 10 th rank by population number 141, 377, 752 people on July 2007 (United States has the 5 th rank)
Russia now n n The 10 th economy by GDP (CIA World Factbook). But only 75 th by per capita GDP ($14, 600) The third largest reserves of foreign exchange and gold - $470 billion (after China and Japan) The largest reserves of natural gas The second in the world by oil production but the 9 th by oil reserves
GDP per capita at current prices (dollars) in Russia and other countries Country 1990 2000 2012 Russia 3840 1768 10618 14178 China 347 932 4375 6070 Kazakhstan 1849 1266 9380 12455 Ukraine 1746 637 2962 3872 Belarus 1835 1044 5818 6726 Finland 27852 23528 44098 45741 Bulgaria 2350 1613 6459 7004 Mexico 3815 6582 8916 9795 Source: http: //data. un. org
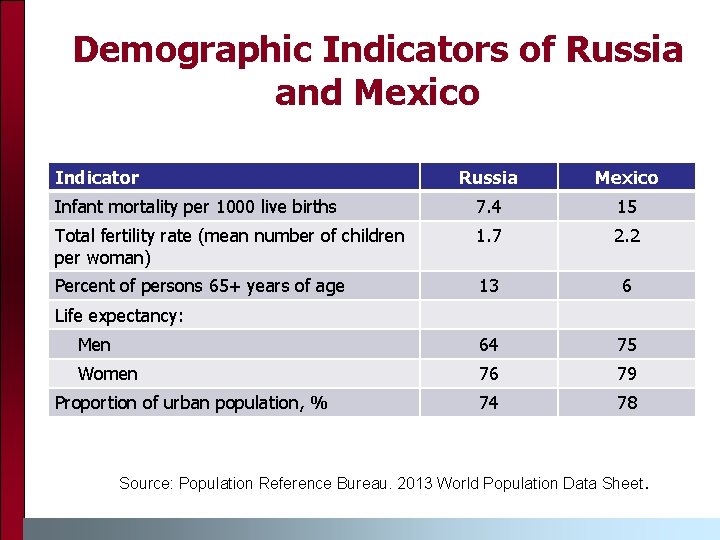
Demographic Indicators of Russia and Mexico Indicator Russia Mexico Infant mortality per 1000 live births 7. 4 15 Total fertility rate (mean number of children per woman) 1. 7 2. 2 Percent of persons 65+ years of age 13 6 Men 64 75 Women 76 79 74 78 Life expectancy: Proportion of urban population, % Source: Population Reference Bureau. 2013 World Population Data Sheet.
Background on Mortality in Russia
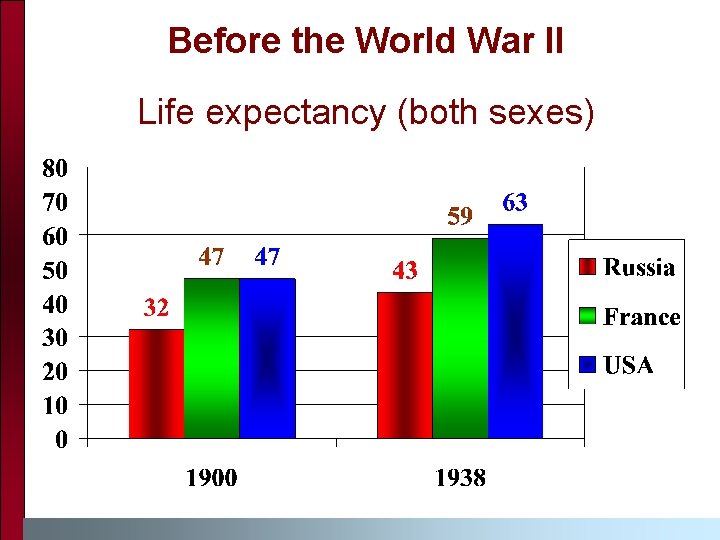
Before the World War II Life expectancy (both sexes)
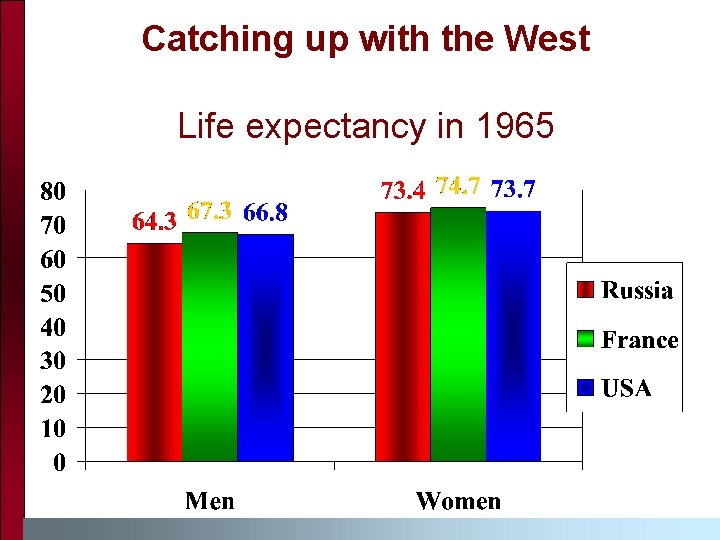
Catching up with the West Life expectancy in 1965
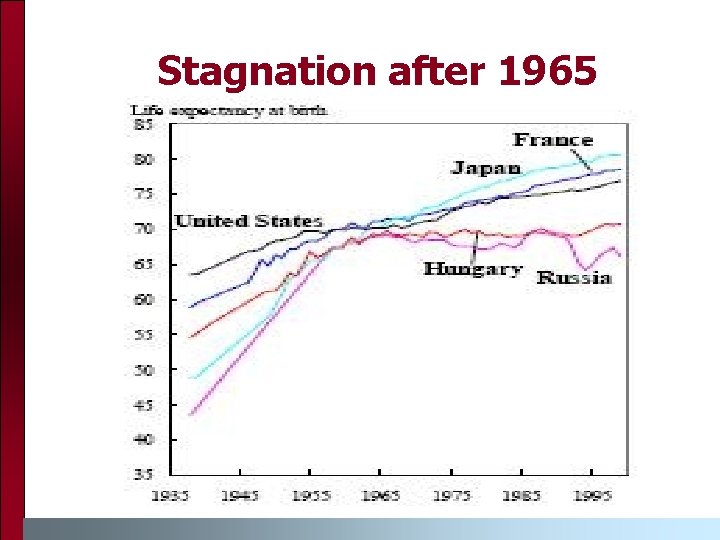
Stagnation after 1965
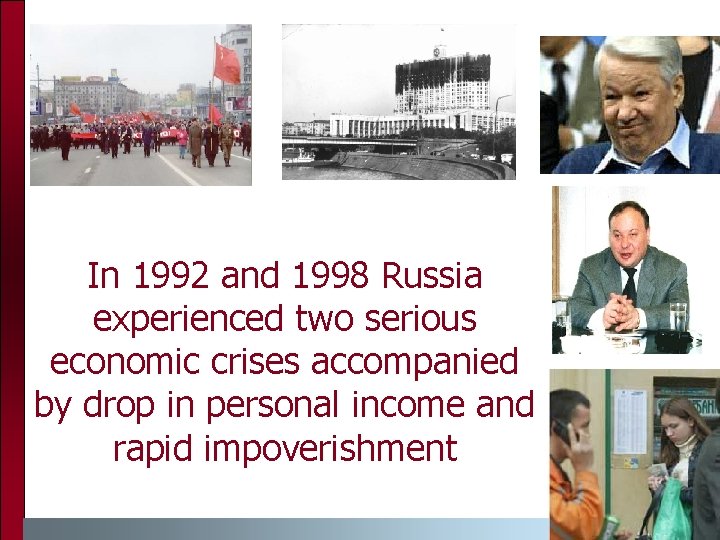
In 1992 and 1998 Russia experienced two serious economic crises accompanied by drop in personal income and rapid impoverishment
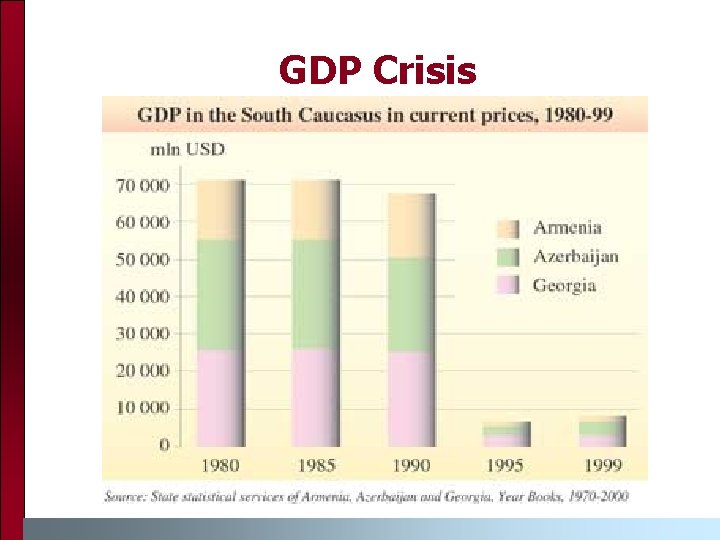
GDP Crisis
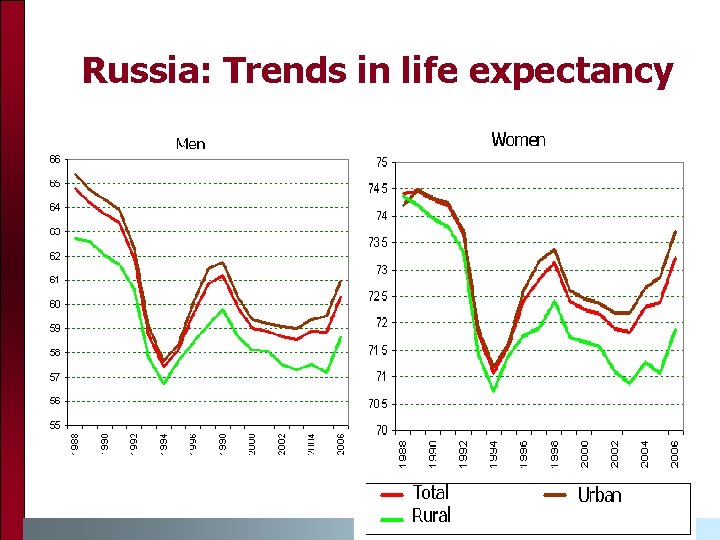
Russia: Trends in life expectancy
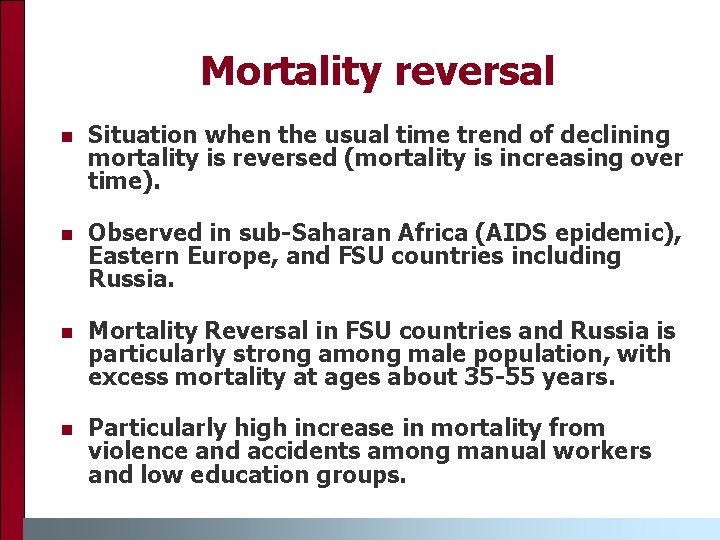
Mortality reversal n Situation when the usual time trend of declining mortality is reversed (mortality is increasing over time). n Observed in sub-Saharan Africa (AIDS epidemic), Eastern Europe, and FSU countries including Russia. n Mortality Reversal in FSU countries and Russia is particularly strong among male population, with excess mortality at ages about 35 -55 years. n Particularly high increase in mortality from violence and accidents among manual workers and low education groups.
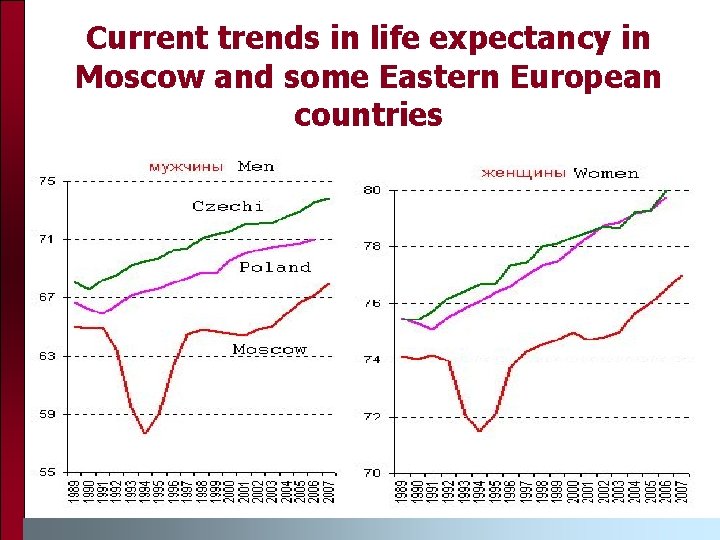
Current trends in life expectancy in Moscow and some Eastern European countries
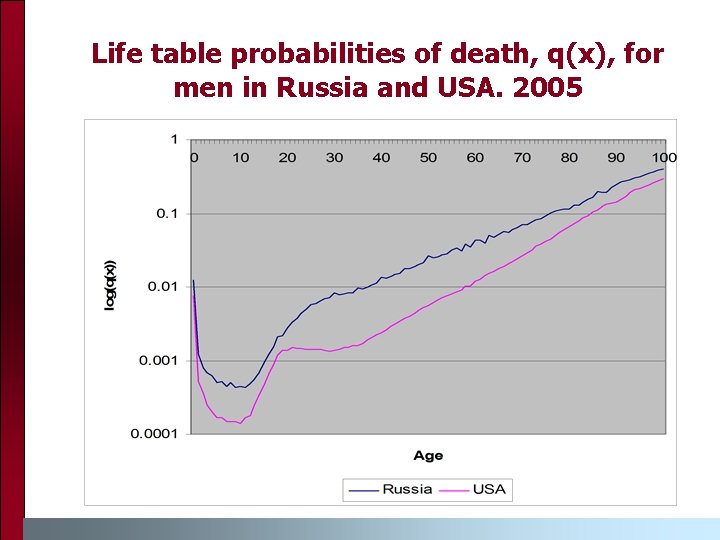
Life table probabilities of death, q(x), for men in Russia and USA. 2005
Ethnic Differentials in Mortality
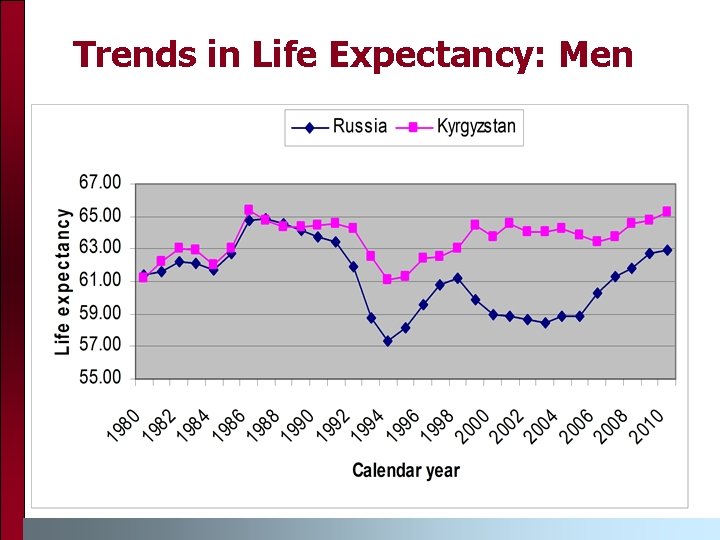
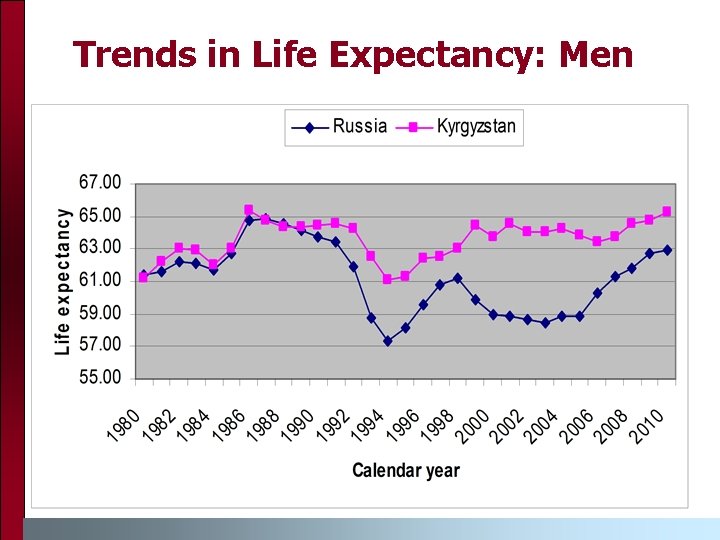
Trends in Life Expectancy: Men
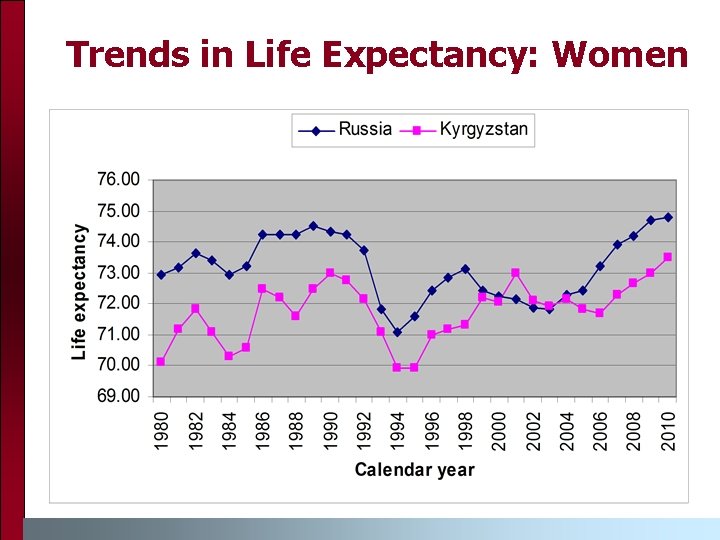
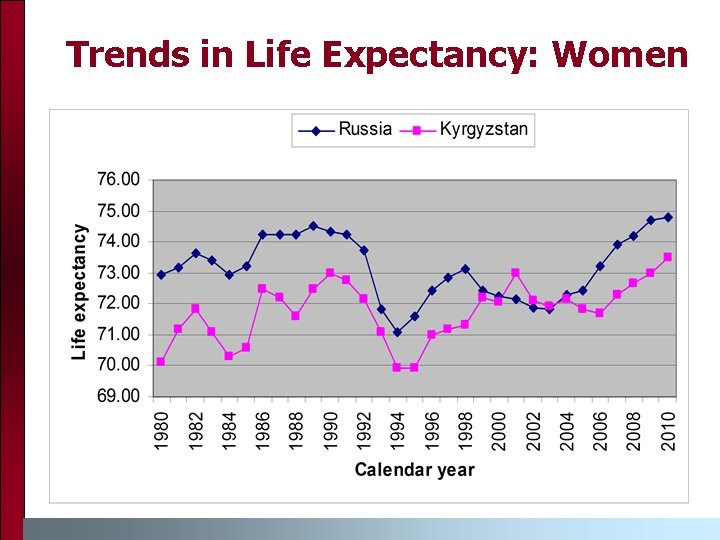
Trends in Life Expectancy: Women
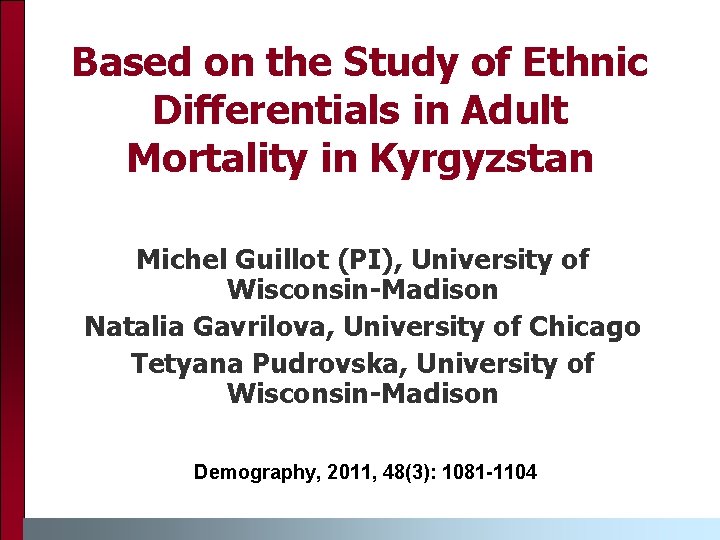
Based on the Study of Ethnic Differentials in Adult Mortality in Kyrgyzstan Michel Guillot (PI), University of Wisconsin-Madison Natalia Gavrilova, University of Chicago Tetyana Pudrovska, University of Wisconsin-Madison Demography, 2011, 48(3): 1081 -1104
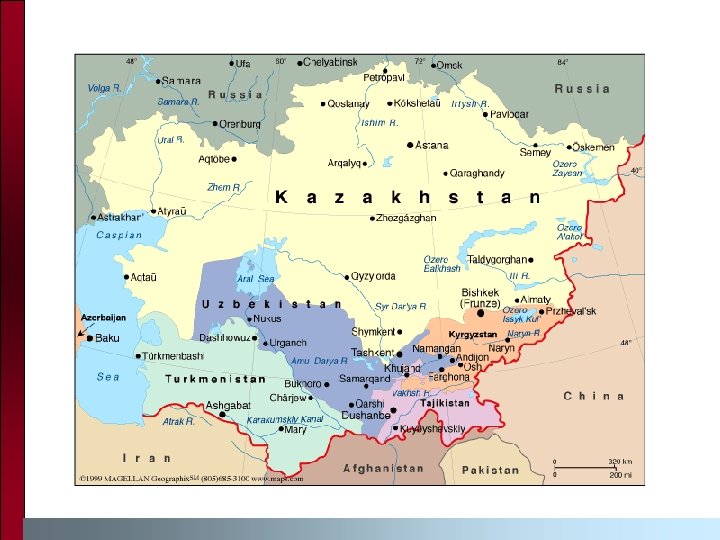
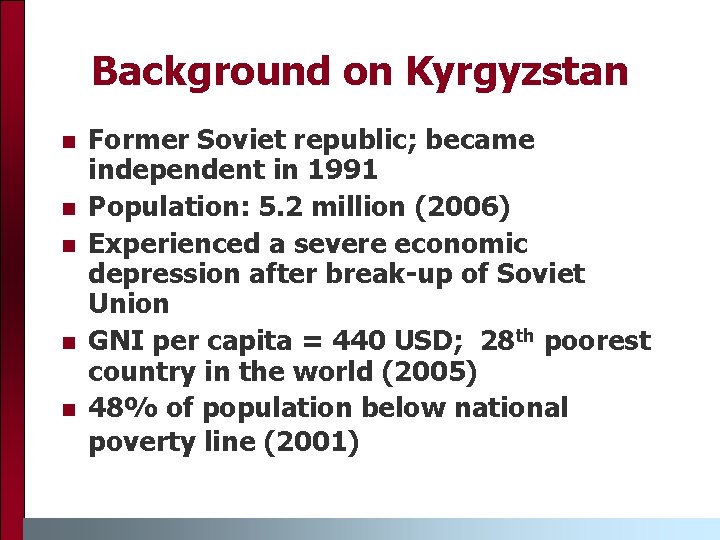
Background on Kyrgyzstan n n Former Soviet republic; became independent in 1991 Population: 5. 2 million (2006) Experienced a severe economic depression after break-up of Soviet Union GNI per capita = 440 USD; 28 th poorest country in the world (2005) 48% of population below national poverty line (2001)
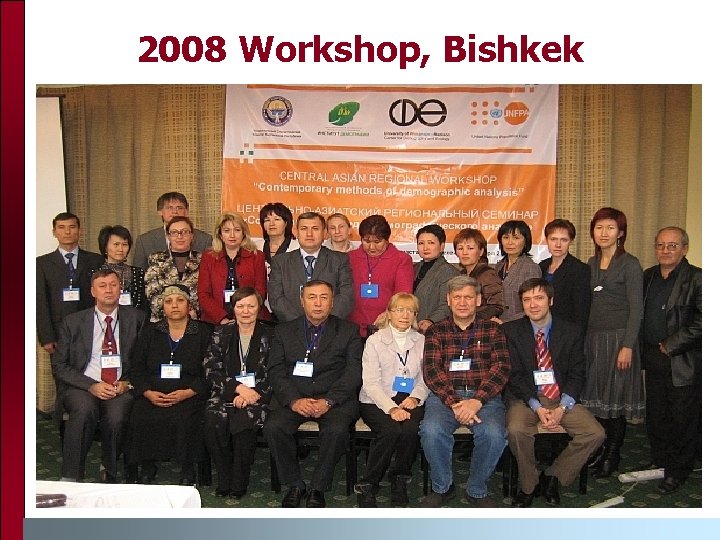
2008 Workshop, Bishkek
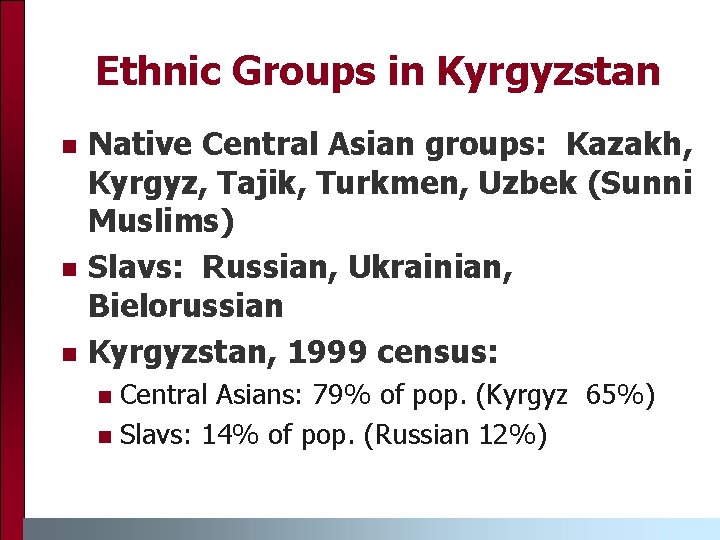
Ethnic Groups in Kyrgyzstan n Native Central Asian groups: Kazakh, Kyrgyz, Tajik, Turkmen, Uzbek (Sunni Muslims) Slavs: Russian, Ukrainian, Bielorussian Kyrgyzstan, 1999 census: Central Asians: 79% of pop. (Kyrgyz 65%) n Slavs: 14% of pop. (Russian 12%) n
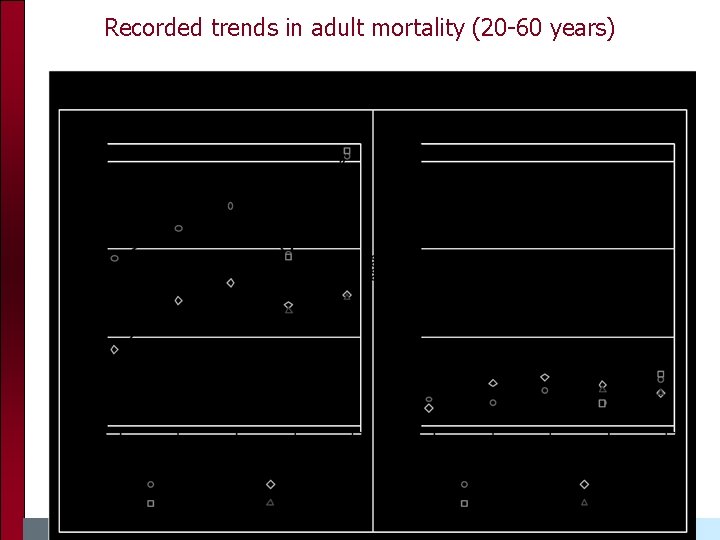
Recorded trends in adult mortality (20 -60 years)
Mortality paradox? n Soviet period: Russians/Slavs occupied dominant positions in the socio-economic structure of Central Asian societies (Kahn 1993)
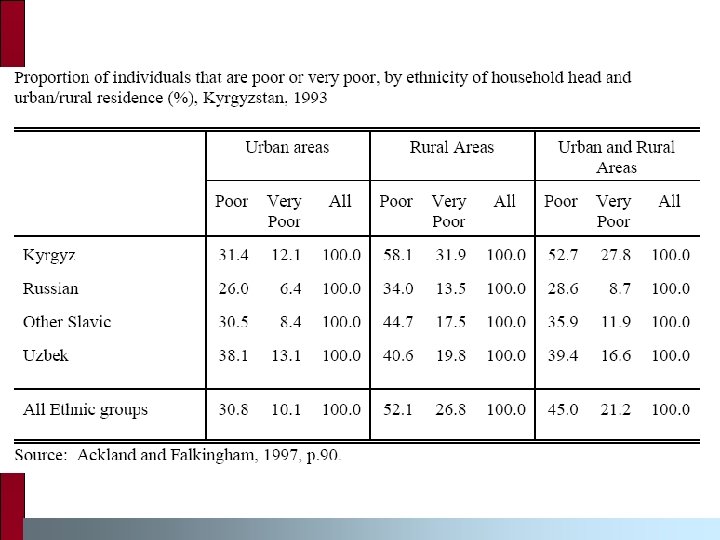
Mortality paradox? n n Slavic females more educated than Central Asian females (1989 and 1999 censuses) Slavic males: educational advantage not so clear – varies by age (1989 and 1999 censuses) Slavic households less poor than Central Asians (1993 World Bank poverty survey) Infant mortality lower among Slavs (Soviet and post-Soviet period)
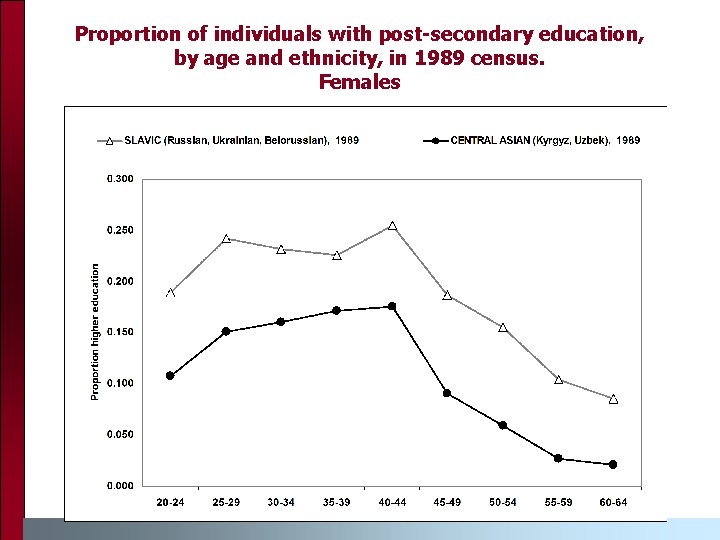
Proportion of individuals with post-secondary education, by age and ethnicity, in 1989 census. Females
Mortality paradox? n n Slavic females more educated than Central Asian females (1989 and 1999 censuses) Slavic males: educational advantage not so clear – varies by age (1989 and 1999 censuses) Slavic households less poor than Central Asians (1993 World Bank poverty survey) Infant mortality lower among Slavs (Soviet and post-Soviet period)
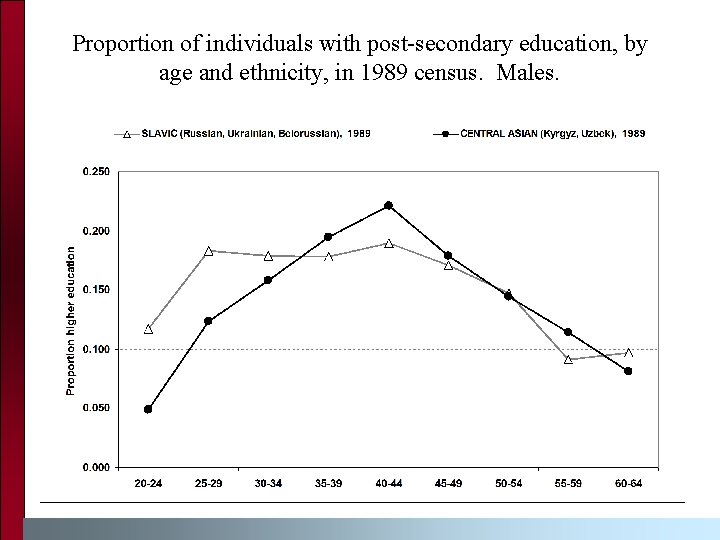
Proportion of individuals with post-secondary education, by age and ethnicity, in 1989 census. Males.
Mortality paradox? n n Slavic females more educated than Central Asian females (1989 and 1999 censuses) Slavic males: educational advantage not so clear – varies by age (1989 and 1999 censuses) Slavic households less poor than Central Asians (1993 World Bank poverty survey) Infant mortality lower among Slavs (Soviet and post-Soviet period)
Mortality paradox? n n Slavic females more educated than Central Asian females (1989 and 1999 censuses) Slavic males: educational advantage not so clear – varies by age (1989 and 1999 censuses) Slavic households less poor than Central Asians (1993 World Bank poverty survey) Infant mortality lower among Slavs (Soviet and post-Soviet period)
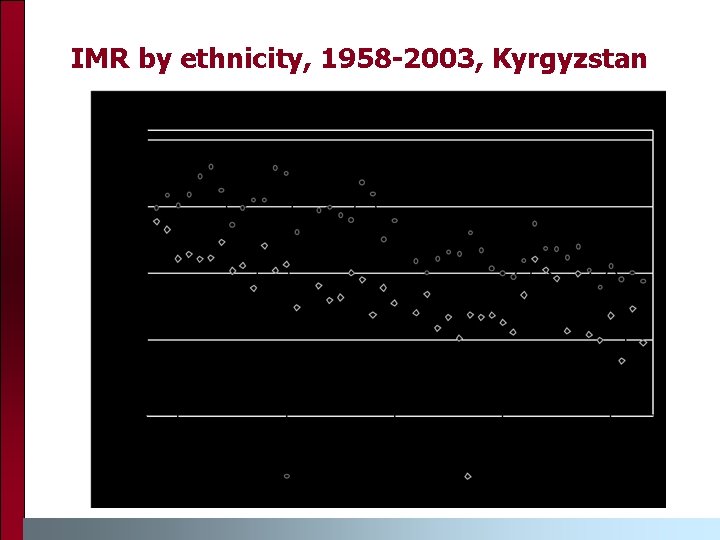
IMR by ethnicity, 1958 -2003, Kyrgyzstan
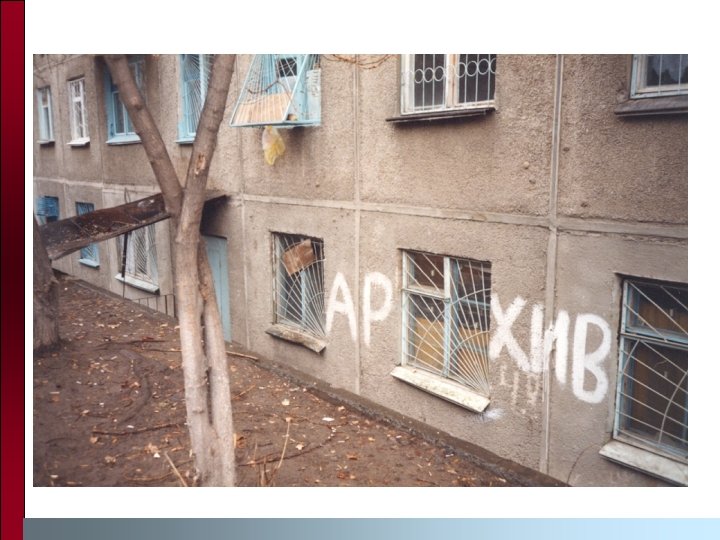
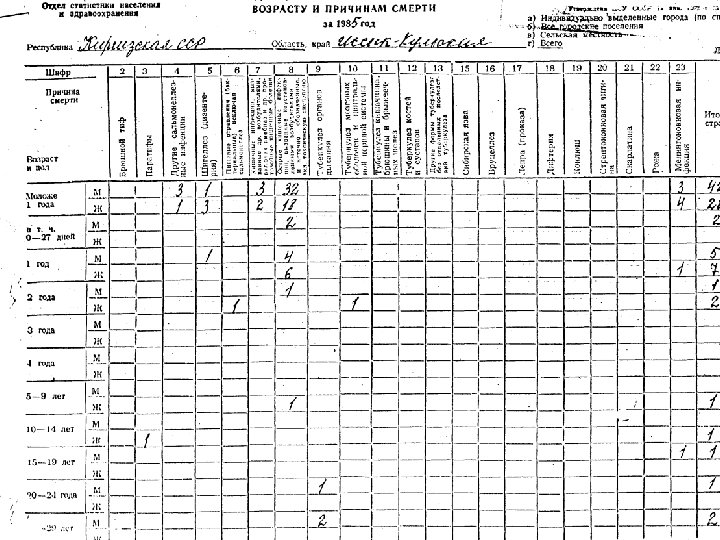
Data n Unpublished population and death tabulations since 1959 n n n collected from local archives Individual census records – 1999 Individual death records – 1998 -1999 n obtained from national statistical office
Possible explanations for mortality paradox n n n Data artifacts Migration effects (esp. 1989 -99) Cultural effects
Data artifacts? n Could the lower recorded mortality among Central Asian adults be due to lower data quality among them (coverage of deaths, age misreporting)?
Migration effects? n n 1/3 of Russian population has left Kyrgyzstan since 1991 Could the increased disparity between Russian and Kyrgyz adult mortality be due to selective migration (healthy migrant effect)?
Cultural effects? n Culture may affect mortality in various ways: individual health and lifestyle behaviors (e. g. , diet, smoking, alcohol, use of preventive care) à family structure and social networks (denser social networks may produce lower stress levels and better health) à n Could different cultural practices among Slavs and Central Asians explain the observed mortality differentials?
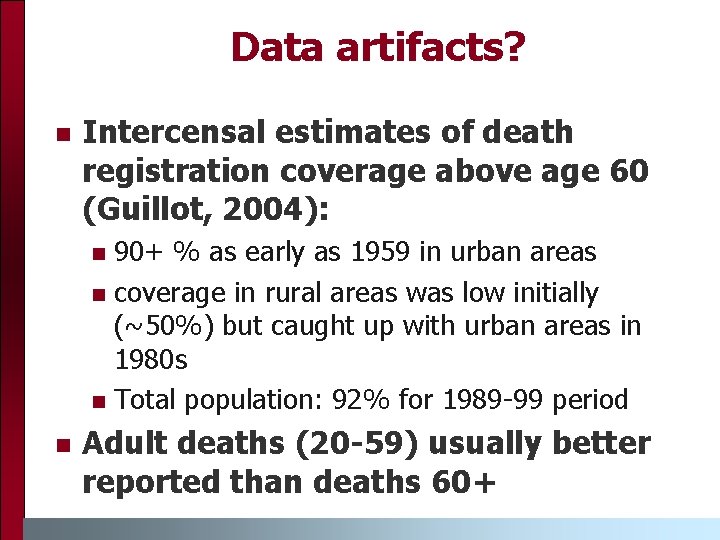
Data artifacts? n Intercensal estimates of death registration coverage above age 60 (Guillot, 2004): 90+ % as early as 1959 in urban areas n coverage in rural areas was low initially (~50%) but caught up with urban areas in 1980 s n Total population: 92% for 1989 -99 period n n Adult deaths (20 -59) usually better reported than deaths 60+
Health selection?
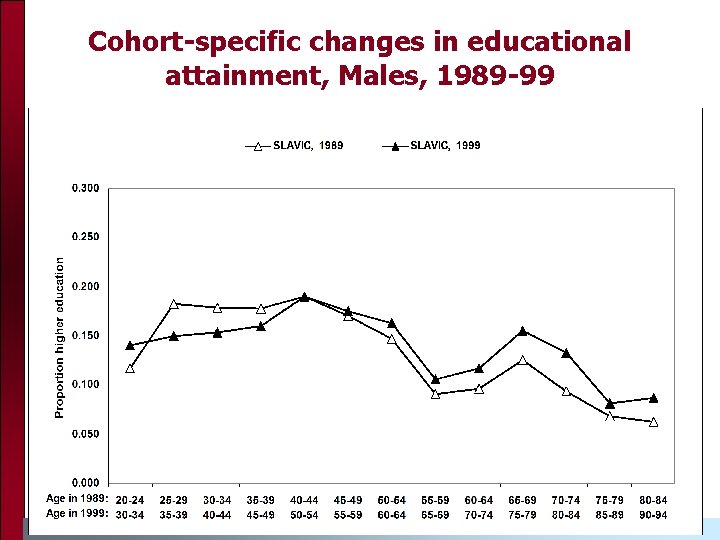
Cohort-specific changes in educational attainment, Males, 1989 -99
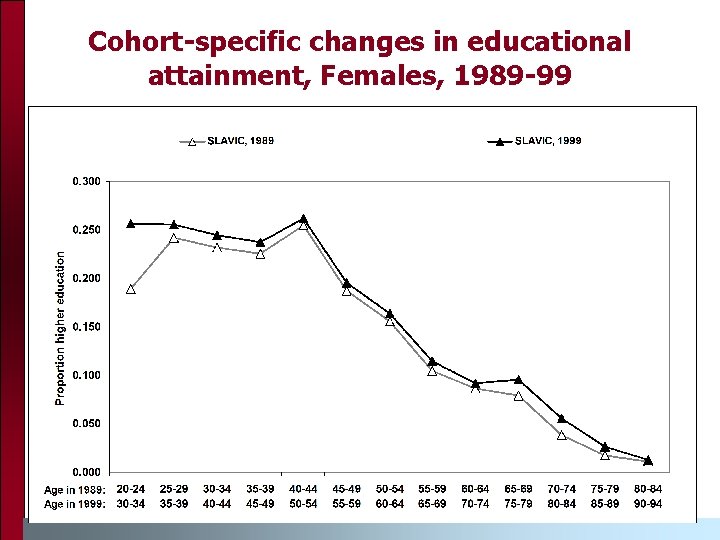
Cohort-specific changes in educational attainment, Females, 1989 -99
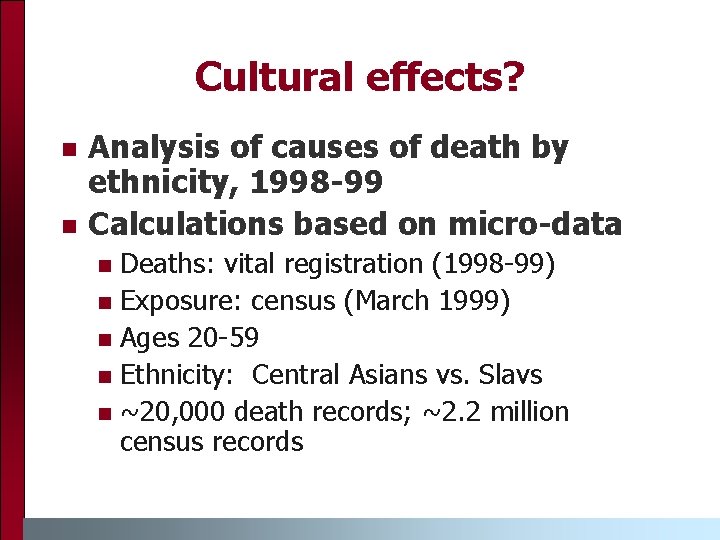
Cultural effects? n n Analysis of causes of death by ethnicity, 1998 -99 Calculations based on micro-data Deaths: vital registration (1998 -99) n Exposure: census (March 1999) n Ages 20 -59 n Ethnicity: Central Asians vs. Slavs n ~20, 000 death records; ~2. 2 million census records n
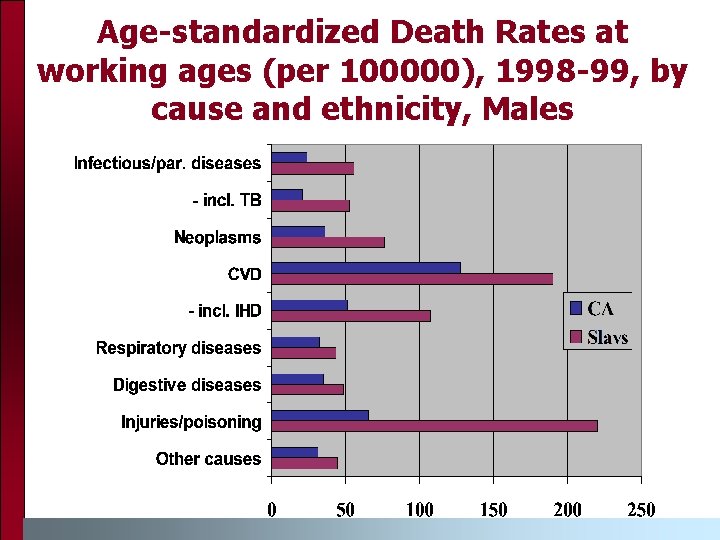
Age-standardized Death Rates at working ages (per 100000), 1998 -99, by cause and ethnicity, Males
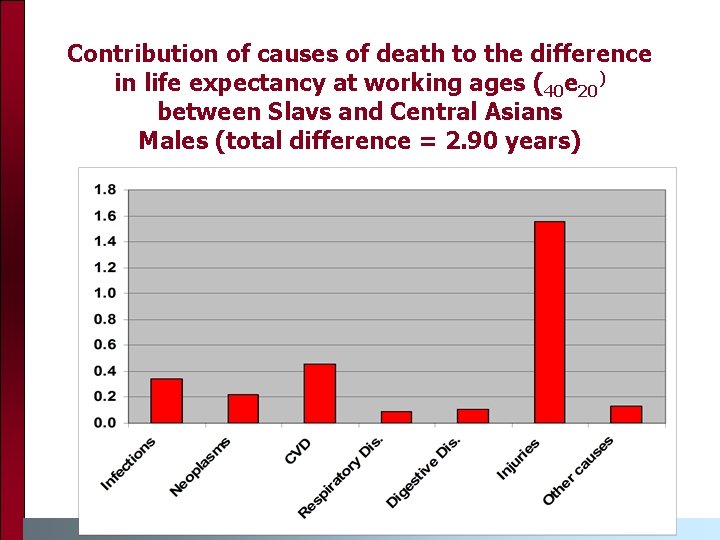
Contribution of causes of death to the difference in life expectancy at working ages (40 e 20) between Slavs and Central Asians Males (total difference = 2. 90 years)
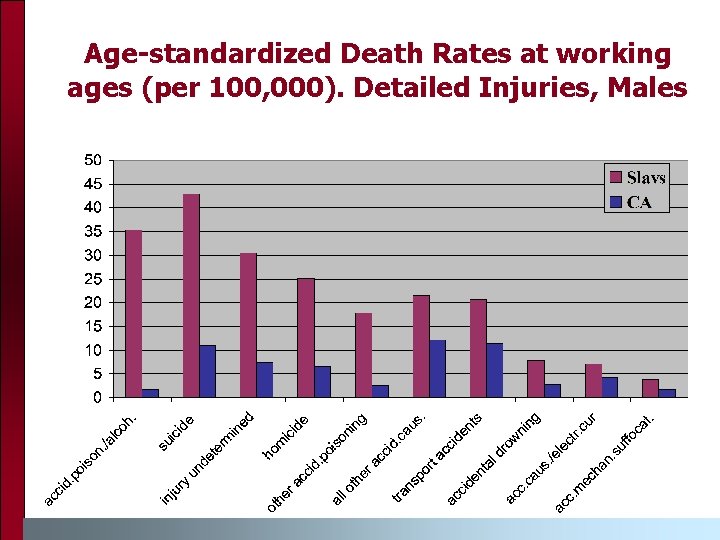
Age-standardized Death Rates at working ages (per 100, 000). Detailed Injuries, Males
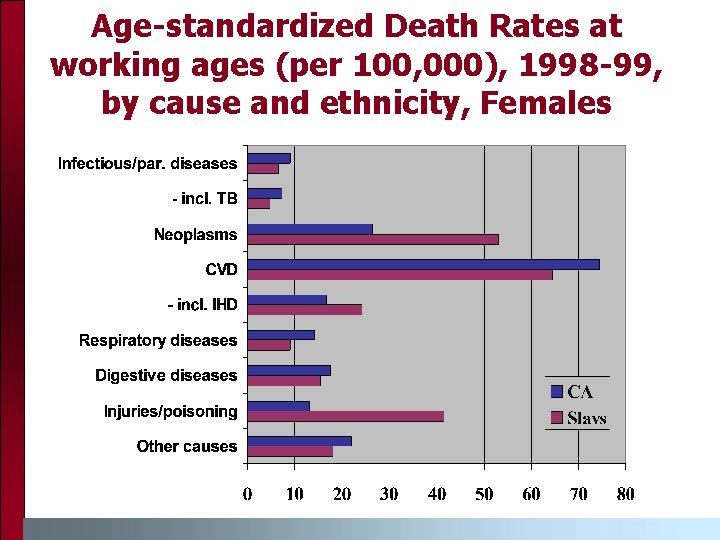
Age-standardized Death Rates at working ages (per 100, 000), 1998 -99, by cause and ethnicity, Females
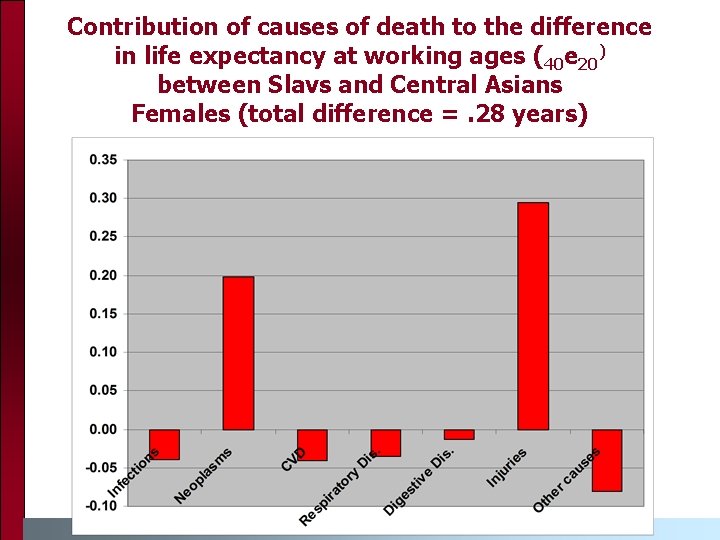
Contribution of causes of death to the difference in life expectancy at working ages (40 e 20) between Slavs and Central Asians Females (total difference =. 28 years)
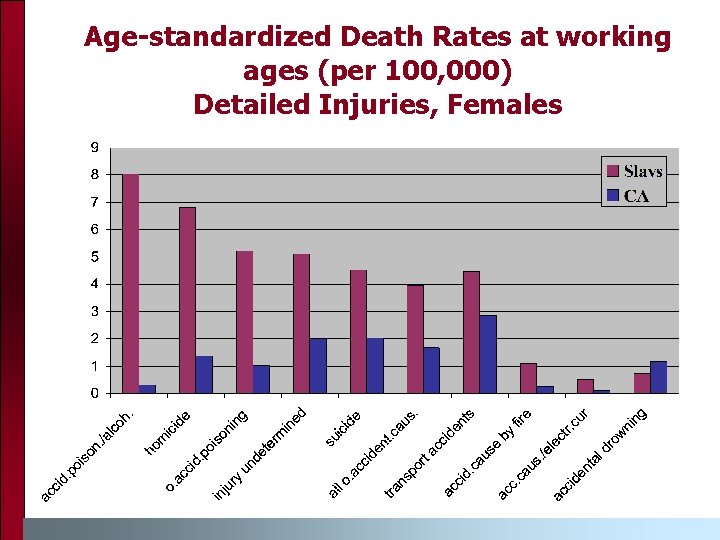
Age-standardized Death Rates at working ages (per 100, 000) Detailed Injuries, Females
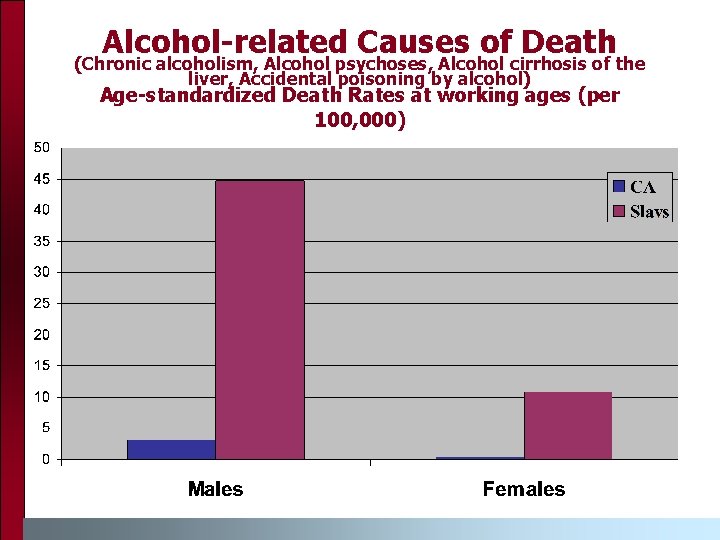
Alcohol-related Causes of Death (Chronic alcoholism, Alcohol psychoses, Alcohol cirrhosis of the liver, Accidental poisoning by alcohol) Age-standardized Death Rates at working ages (per 100, 000)
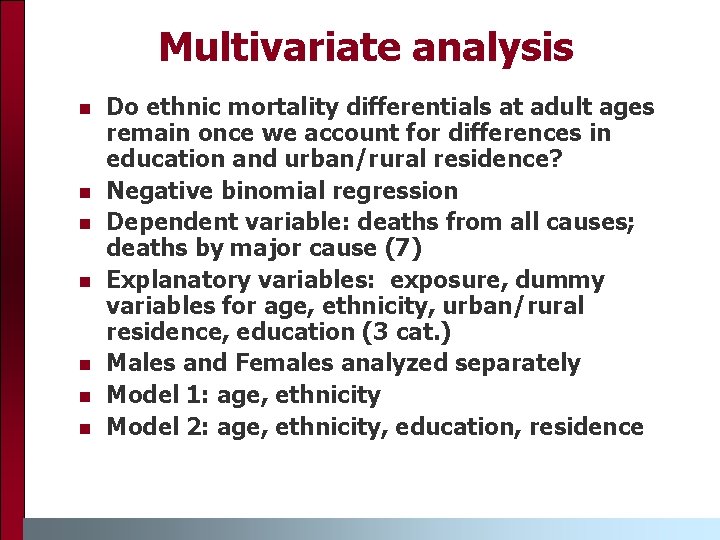
Multivariate analysis n n n n Do ethnic mortality differentials at adult ages remain once we account for differences in education and urban/rural residence? Negative binomial regression Dependent variable: deaths from all causes; deaths by major cause (7) Explanatory variables: exposure, dummy variables for age, ethnicity, urban/rural residence, education (3 cat. ) Males and Females analyzed separately Model 1: age, ethnicity Model 2: age, ethnicity, education, residence
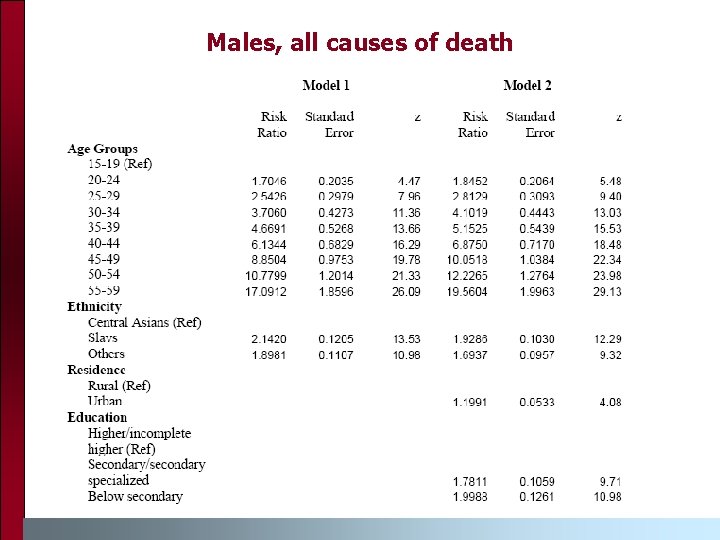
Males, all causes of death
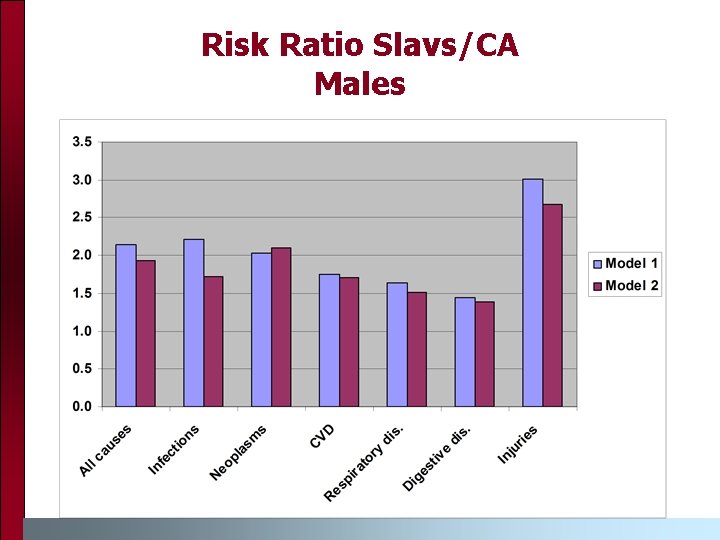
Risk Ratio Slavs/CA Males
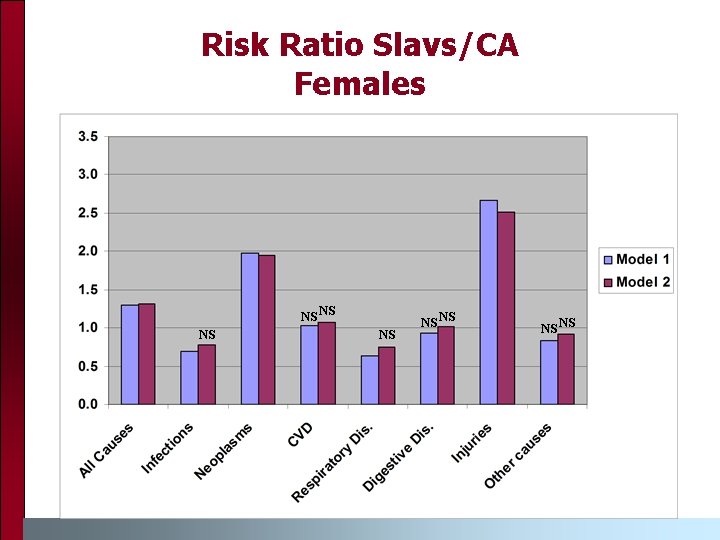
Risk Ratio Slavs/CA Females NS NS
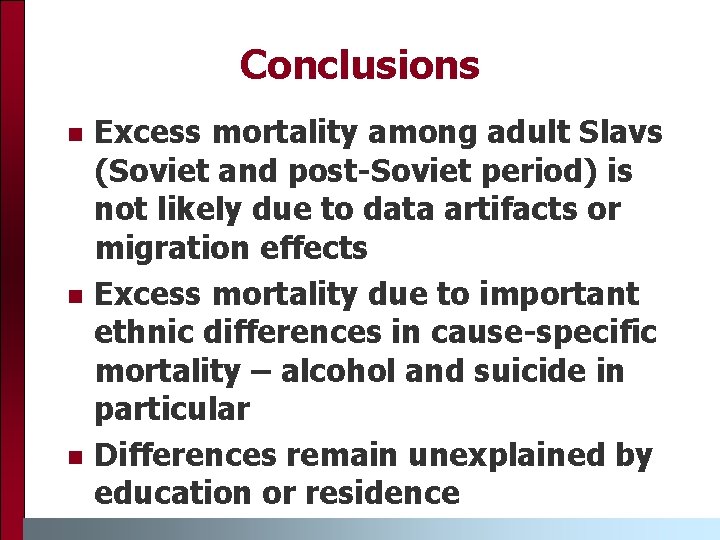
Conclusions n n n Excess mortality among adult Slavs (Soviet and post-Soviet period) is not likely due to data artifacts or migration effects Excess mortality due to important ethnic differences in cause-specific mortality – alcohol and suicide in particular Differences remain unexplained by education or residence
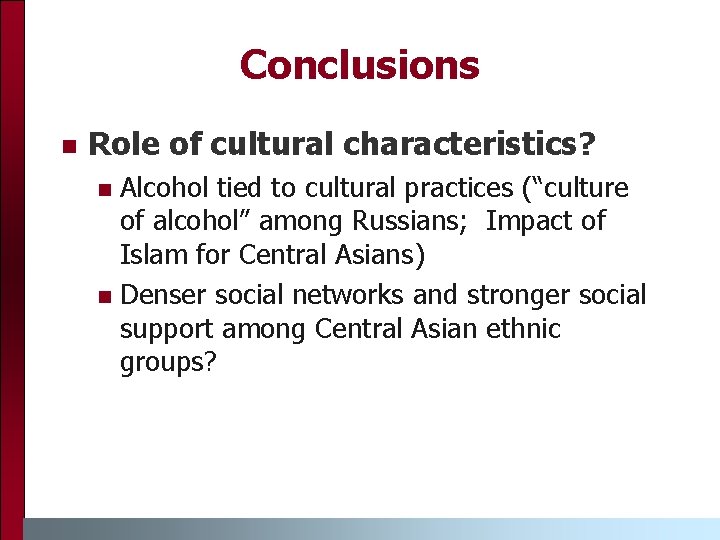
Conclusions n Role of cultural characteristics? Alcohol tied to cultural practices (“culture of alcohol” among Russians; Impact of Islam for Central Asians) n Denser social networks and stronger social support among Central Asian ethnic groups? n
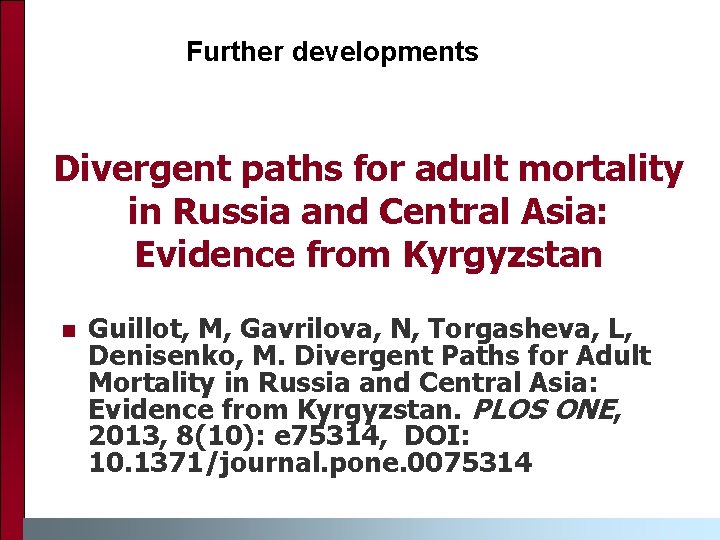
Further developments Divergent paths for adult mortality in Russia and Central Asia: Evidence from Kyrgyzstan n Guillot, M, Gavrilova, N, Torgasheva, L, Denisenko, M. Divergent Paths for Adult Mortality in Russia and Central Asia: Evidence from Kyrgyzstan. PLOS ONE, 2013, 8(10): e 75314, DOI: 10. 1371/journal. pone. 0075314
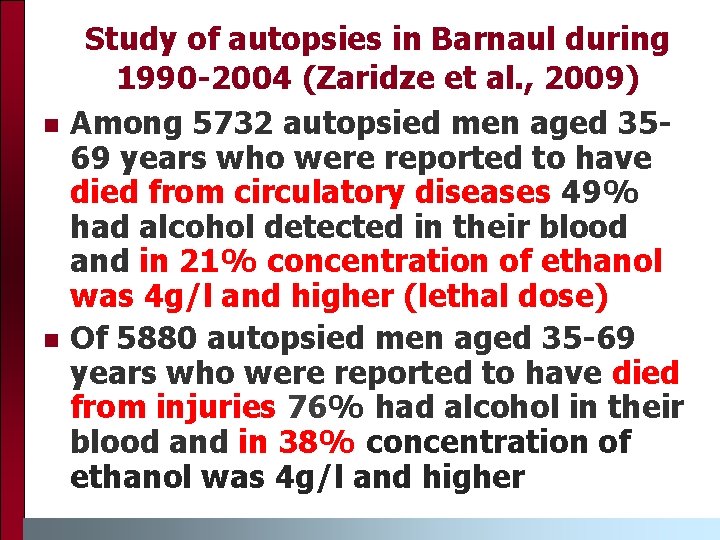
n n Study of autopsies in Barnaul during 1990 -2004 (Zaridze et al. , 2009) Among 5732 autopsied men aged 3569 years who were reported to have died from circulatory diseases 49% had alcohol detected in their blood and in 21% concentration of ethanol was 4 g/l and higher (lethal dose) Of 5880 autopsied men aged 35 -69 years who were reported to have died from injuries 76% had alcohol in their blood and in 38% concentration of ethanol was 4 g/l and higher
Trends in Life Expectancy: Men
Trends in Life Expectancy: Women
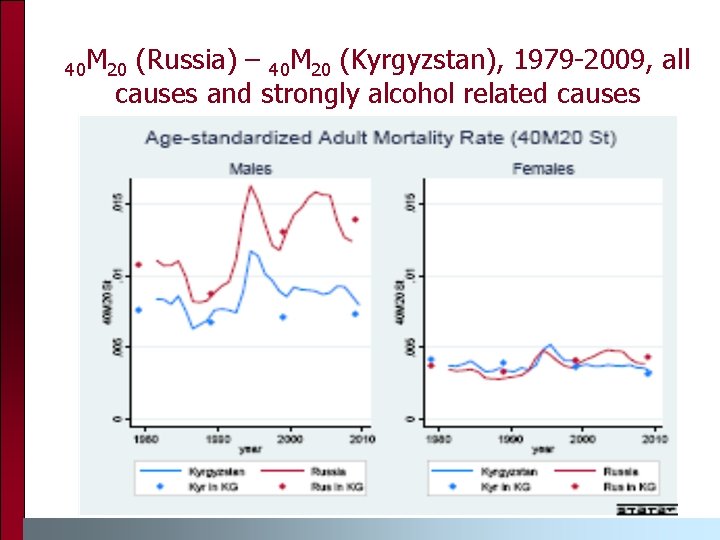
40 M 20 (Russia) – 40 M 20 (Kyrgyzstan), 1979 -2009, all causes and strongly alcohol related causes
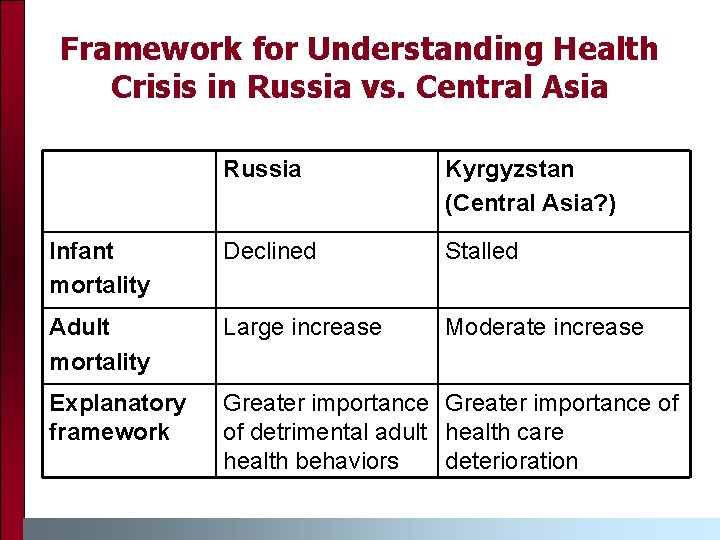
Framework for Understanding Health Crisis in Russia vs. Central Asia Russia Kyrgyzstan (Central Asia? ) Infant mortality Declined Stalled Adult mortality Large increase Moderate increase Explanatory framework Greater importance of of detrimental adult health care health behaviors deterioration
Acknowledgements n n n National Statistical Committee of the Kyrgyz Republic Zarylbek Kudabaev, Orozmat Abdykalykov, Liudmila Torgashova, Larissa Mimbaeva, Elena Komandirova and Mikhail Denisenko NICHD: R 03 HD 38752, R 01 HD 045531
Biomarkers in Population-Based Aging and Longevity Research Natalia Gavrilova, Ph. D. Stacy Tessler Lindau, MD, MAPP CCBAR Supported by the National Institutes of Health (P 30 AG 012857) NSHAP Supported by the National Institutes of Health (5 R 01 AG 021487) including: National Institute on Aging Office of Research on Women's Health Office of AIDS Research Office of Behavioral and Social Sciences Research
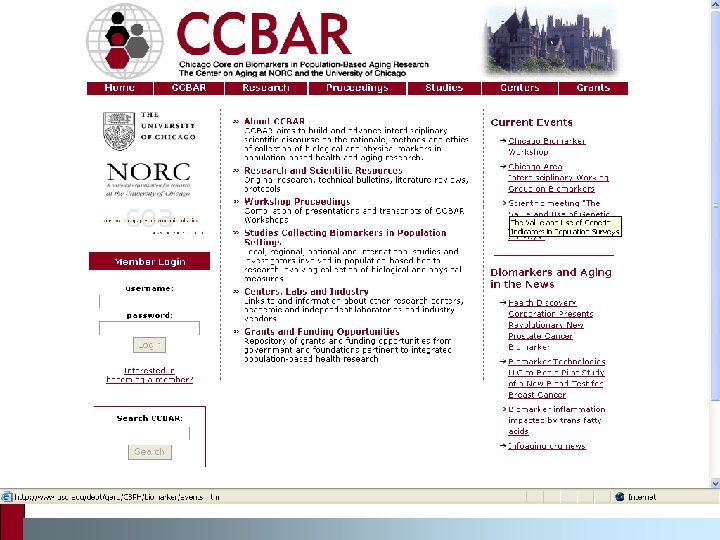
Chicago Core on Biomarkers in Population-Based Aging Research CCBAR website http: //biomarkers. uchicago. edu/
CCBAR Website Objectives n n n Central resource for collecting, monitoring, and disseminating the most recent developments Virtual research collaborative, establishing a means of exchanging rapidly evolving ideas related to all aspects of biomarker collection in population-based research Educate public about integrated population -based health research
Website Components n CCBAR n Research and Scientific Resources n Workshop Proceedings n Studies Collecting Biomarkers in Population Settings n Centers, Labs and Industry n Grants and Funding Opportunities
CCBAR Newsletter n Monthly electronic newsletter proving new information on biomarker and aging studies published in high profile scientific journals and mass media outlets n If you would like to receive monthly CCBAR newsletter please leave your email address to be included in the list of recipients
Questions?