Regulation Regarding Pesticide Applications near Schoolsites Potential Economic


- Slides: 27
Regulation Regarding Pesticide Applications near Schoolsites: Potential Economic Effects for Agriculture Prepared for California Dept. of Food and Agriculture Office of Pesticide Consultation and Analysis Rachael Goodhue 1 Karen Klonsky 2 Christopher De. Mars 3 Robert Van Steenwyk 4 1 Professor, 2 UCCE Dept. of Agricultural & Resource Economics Specialist Emerita, Dept. of Agricultural & Resource Economics 3 Ph. D Student, Hydrological Science, LAWR University of CA, Davis 4 UCCE Specialist Emeritus & Research Entomologist Dept. Environmental Science, Policy, and Management University of CA, Berkeley
Draft Regulation 1. Regulation applies to applications within 0. 25 mile of a schoolsite from 6: 00 am to 6: 00 pm, Monday through Friday. 2. Growers must prepare an annual notification to schools & daycares of all pesticides to be used within 0. 25 mile of school 3. The following are prohibited: applications with a high tendency to drift (airblast, aerial) and fumigations (6 am – 6 pm, weekdays) 4. This part was dropped in the final version: for all other ground-based applications, the grower must provide written notices to schools and the CAC 48 hours in advance.
County Data • 13 of the top 15 ag counties had sufficient GIS data • Fresno, Imperial, Kern, Kings, Madera, Merced, Sacramento, San Joaquin, Santa Barbara, San Luis Obispo, Stanislaus, Ventura, and Yolo • Accounts for 57% of the total value of production in CA • 65% of fruit and nut, 62% of field and seed crops, 60% of vines, 56% of berries, 48% of vegetables, and 28% of nursery products, flowers, and foliage.
Basic GIS Data • Parcel maps of ag fields • Schoolsite lists • Schoolsite street and address for geocoding • Pesticide applications by date, time, and location
2014 PUR data for 13 counties • 2, 853 public K-12 schools -- 795 (28%) are within ¼ mile • 2, 972 licensed child daycares -- 896 (30%) are within ¼ mile • 25, 836 unique grower IDs 1, 439 (5. 6 percent) with one or more affected fields • 139, 861 total fields 2, 571 (1. 8 percent) fields with acreage within ¼ mile of a schoolsite • 478, 773 total acres 36, 471 (7. 6 percent) acres are within a ¼ mile of a schoolsite)
Notification costs 1, 212 affected growers with an average of 1. 7 fields per grower Costs include time take to: • Understand requirements • Preparation of annual notifications • Delivery of notifications Total average cost/grower = $1, 146
Effects of regulation on pest management? UCCE & USDA determined: • Weed and insect control have timing flexibility • Winter and springtime fungicide applications are most sensitive • PUR data confirm nighttime and weekend applications are already common
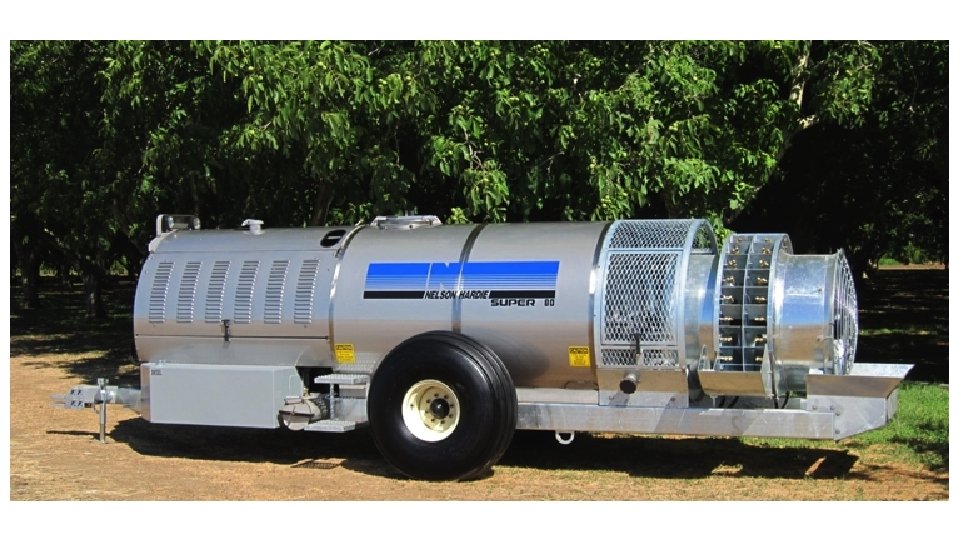
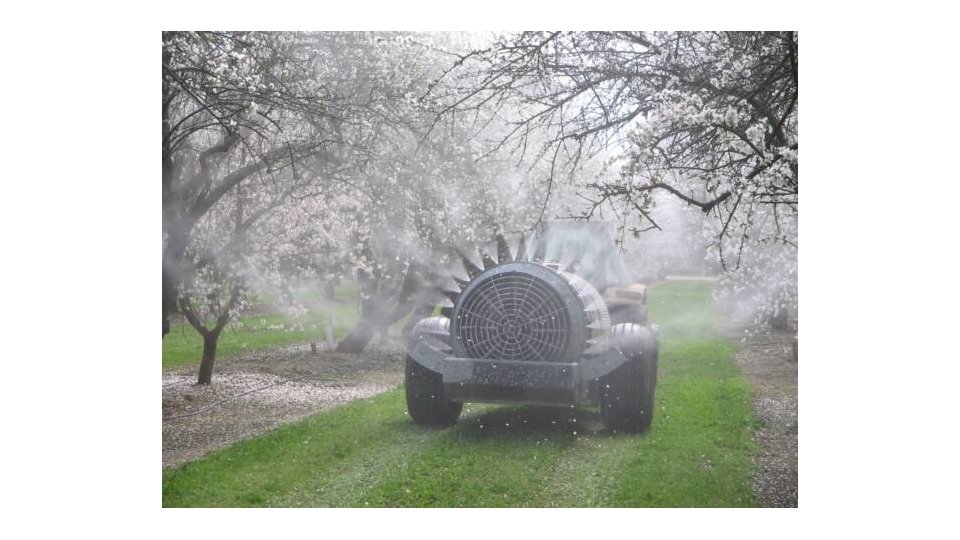
Plant disease is the critical problem • Regulation has no effect on ground applications of fungicides Thus, primary effect on pest management is the restriction of drift-prone application techniques (airblast & aerial) to between 6: 00 pm & 6: 00 am or weekends. • Tree crops require airblast or aerial applications
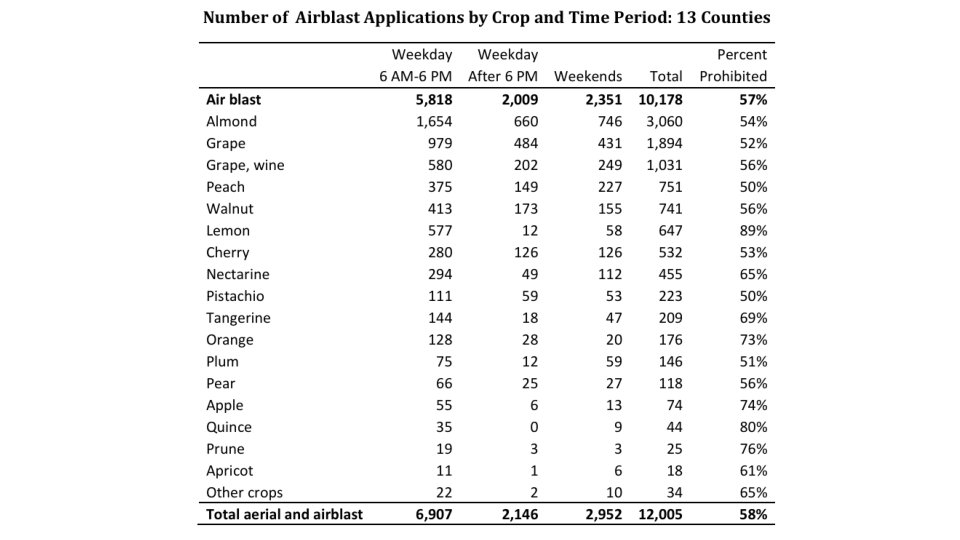
Parsing PUR data • PUR has two options for application type: aerial and ground • Cannot distinguish airblast from other ground based application types • UCCE: safe to assume airblast for tree & grape crops (insecticide & fungicides). • Under the regulation, growers must apply fungicides at night or weekends
Almond and grape analysis • Grapes represent 25. 4% of potentially prohibited applications • Almonds represent 22. 6% of potentially prohibited applications • Largest acreages near schoolsites • Grapes and almonds in top 10 California commodities by revenue
Regulation impact on almond and grape • Weather data 6 Weather stations Date and time Hourly temperature Number of hours of wind speed >10 mph Hourly precipitation • Soil hydrologic group locations for ag fields • Re-entry rules by soil group and precipitation • Fungicide use for almonds and grapes • Almond bloom data • IPM decision rules for fungicides
Possible spray periods for orchards and vineyards • If a spray can be made 3 days before or after its optimal time, then it is efficacious and there is no yield loss • Nighttime ground applications are possible if the rain history and soil type permit. • Successful spray requires no rain events during a 12 -hour block or in the 12 -hour blocks proceeding and following that block. • Weekend (ground or aerial) sprays are allowable during the day. • Aerial/ground applications can occur if wind speed <10 mph for at least 6 hours in a block of 12 hours
Re-entry rules for orchards and vineyards • Ground applications are possible if the soil is not too wet from precipitation, which is a function of the amount and duration of precipitation and hydrologic soil type. • Four hydrologic soil groups with different re-entry rules: • • Group A: sand, loamy sand, sandy loam Group B: silt loam, loam Group C: sandy clay loam Group D: clay loam, silty clay loam, sandy clay, and clay
Almond Yield Loss Estimates When Only One Spring/Bloom Fungicide Spray Completed by Region Southern San Joaquin Valleya Northern San Joaquin Valley and Southern Sacramento Valleyb Northern Sacramento Valleyc 0%-15% 25% Southern San Joaquin Valley: Fresno, Kern, Kings, Madera and Tulare counties b Northern San Joaquin Valley and Southern Sacramento Valley: Merced, Sacramento, San Joaquin, Solano and Yolo counties c Northern Sacramento Valley: Butte, Colusa, Glenn, Sutter, Tehama, and Yuba counties Source: Growers, PCAs, UC and USDA personnel a Assumes that most programs include 2 -3 sprays, depending on the timing and length of bloom
Mean First Bloom and 100% Petal Fall Dates for Nonpareil Cultivar Meana Years 1996 – 2006 – 2014 a. From Location/County First bloom 100% petal fall CSU-Chico (Butte) 15 Feb 3 Mar Delta College- Stockton (San Joaquin) 16 Feb 23 Feb Paramount Farm (Kern) 14 Feb 1 Mar Mc. Farland (Kern) 17 Feb 5 Mar Lampinen et al. “Field Evaluation of almond varieties. ” Almond Board Report 08 -HORT 2 Lampinen and Lampinen et al. “Field Evaluation of almond varieties. ” Almond Board Report 14 – HORT 2 – Lampinen.
Percentage of Years When Only Possible to Complete One Spray by Soil Hydrologic Group and Regulation Status: Almond, 1996 -2005 Soil Hydrologic Group With Regulation A B C Without Regulation D A B C D Increase with Regulation A B C D Southern San Joaquin Valley Fresno 0% 10% 30% 0% 10% 10% 0% 0% 20% Kern 0% 10% 10% 10% 0% 0% Kings 0% 0% 10% 10% 0% 0% Madera 0% 10% 30% 0% 10% 10% 0% 0% 20% Northern San Joaquin/Southern Sacramento Valleys Merced 0% 10% 20% 0% 0% 10% Sacramento 0% 0% 10% 20% 0% 0% San Joaquin 0% 0% 10% 20% 0% 0% Stanislaus 0% 10% 20% 0% 0% 10% Yolo 10% 30% 40% 0% 20% 30% 10% 10%
Estimated Almond Net Revenue Losses Averaged across 10 Years by County and Soil Hydrologic Group: Almond, 1996 -2005 A Soil Hydrologic Group B C D Total $0 $0 Southern San Joaquin Valley $0 $44, 882 $0 $0 $0 $45, 986 $11, 541 $0 $0 $31, 528 $56, 423 $0 $0 $77, 514 Northern San Joaquin/southern Sacramento Valleys $0 $0 $0 $13, 997 $0 $0 $0 $7, 167 $0 $1, 265 $0 $378 $11, 139 $5, 664 $13, 997 $0 $0 $8, 432 $17, 181 County Fresno Kern Kings Madera Merced Sacramento San Joaquin Stanislaus Yolo Total net revenue losses averaged across 10 years $0 $7, 545 $102, 007 $63, 995 $173, 547
Grape spray program • The time period was defined based on wettable sulfur use and weather for two regions: Sacramento and northern San Joaquin Valleys and the southern San Joaquin Valley. Each calendar year, the starting week was identified using the following rule: • The starting week is the first week in which wettable sulfur applications exceeded 5% of the cumulative total wettable sulfur applications based on acres treated (PUR data). • The program included weekly sprays until the end of May.
Predicted Grape Yield Losses When One or More Weekly Sprays Missed by Risk Index Assuming an Effective Spray at the Beginning of the Period: San Joaquin Valley and Southern Sacramento Valley Weeks Missed Disease Pressure (Risk Index*) Low (0 -30) Intermediate (40 -50) High (60 -100) Pathogen Status 1 2 3 4 0% 0% 5% 10% Reproduction cycle = 15 days 0% 2% 10% 30% Reproduction cycle = 5 days 0% 20% 40% 60% Present * The powdery mildew risk index is based on accumulated hourly temperature ranges.
From 1996 -2005, there were only four cases where the regulation would have made a difference: 1996 • Soil group B in Yolo County • Soil group C in San Joaquin and Sacramento Counties • Soil group A in Stanislaus and Merced Counties 2005 • Soil group D in Fresno and Madera
Components of Estimated Grape Total Net Revenue Losses: High Disease Pressure Fresno Madera Total $4, 432 $4, 472 N/A 20% gross revenue loss per acre $886 $894 N/A Net revenue loss per acre $625 $633 N/A 77 269 346 $48, 125 $170, 277 $218, 402 Gross revenue per acre Buffer acres Total net revenue losses in a year when two consecutive sprays cannot be completed Total net revenue losses averaged over 10 years $4, 813 $17, 028 $21, 840
Closing Thoughts • Pest management analysis -- growers have enough flexibility to work around restrictions most years. • Growers and applicators interviewed indicated that they already avoid applications when children are present. • Educators interviewed indicated that they are already communicating with growers.
Thank you