QUANTITATIVE TESTS FOR PROTEINS Introduction Colorimetric assays allow


 ions which form the chelate complex.")


")


 Protein standard (ml) Unknown (ml) Conc. mg/ml 1 0.")

- Slides: 18
QUANTITATIVE TESTS FOR PROTEINS
Introduction • Colorimetric assays allow for indirect determination of specific concentration such as: proteins, carbohydrates, enzyme activity, etc… via color change. • These reactions can be performed directly inside the spectrophotometer.
spectrophotometer • A spectrophotometer: is employed to measure the amount of light that a sample absorbs(absorption) depend on beer lambert law (the intensity of the color and hence the absorption, is directly proportional to the concentration).
Methods for protein determination 1. Spectrophotometry based on UV absorption: – Classical method. – Proteins absorb UV light at 280 nm. 2. Dye binding assay (barford assay): – Depend on dye which bind to protein and give color. 3. Copper based assays: – Lowery (Folin) method. – Bicin-choninic acid assay (BCA). – Biuret method: for routine use, the biuret procedure is simple to perform, producing a stable color that obeys Beer's Law. Ø All these methods depend on the presence of cupric ions (chelating agent) which bind to peptide bond and give color. Cupric ions (Cu+2) reduction Cuprous ions (Cu+)
– To perform biuret test for proteins. – To estimate the amount of total proteins in a sample. – To make standard curve. – The quantization of protein content is important and has many applications in clinical laboratory practices and in research especially in the field of biochemistry. The accurate quantization of protein content is a critical step in protein analysis.
1. Copper sulfate: this provides the cu (II) ions which form the chelate complex. ØCu (II) ions: give the reagent its characteristic blue color. 2. Potassium hydroxide (KOH) or sodium hydroxide (Na. OH): doesn’t participate in the reaction but provides the alkaline medium. 3. Potassium sodium tartarate (KNAC 4 H 4 O 6. 4 H 2 O): – Stabilizes the chelate complex. – Prevent precipitation of copper hydroxide. – Potassium prevent auto reduction of copper.
Principle • One commonly used method for determining the total protein in a sample is the Biuret method. • The Biuret method is based on the complexation of (Cu+2) to peptide bonds in the protein’s. • The formation of a (Cu+2) protein complex requires two peptide bonds and produces a violet-colored chelate product which is measured by absorption spectroscopy at 540 nm. • Molecules containing 2 or more peptide bonds associate with the cupric ions to form a coordination complex that imparts a purple color to the solution with A(max) = 540 nm. • Under alkaline conditions cupric ions chelate with the peptide bonds resulting in reduction of cupric ions to cuprous ions.
Lowery method • The cuprous ions can also be detected with folin ciocalteu reagent (phosphomolybdic/ phosphotungstic acid), this method is commonly referred to as the lowery method. • Cuprous ions reduction of folin ciocalteu reagent produces a blue color that can be read at 650 -750 nm. • The amount of color produced is proportional to the amount of peptide bonds such as size, amount of protein/peptide.
Disadvantages of Biuret test 1. This method requires relatively large quantities of protein for detection (1 - 20 mg/m. L). 2. It’s sensitive to a variety of nitrogen-containing substances as: bi-urea, that could be in the protein solution, thereby increasing the likelihood of erroneous results.
• A standard curve is a type of graph used as a quantitative research technique. • Standard curve for protein concentration is often created using known concentrations of bovine serum. • The protein we will analyze is bovine serum albumin (BSA). • Albumin: is a serum protein that transports fatty acids and is important in maintaining plasma p. H. • In protein quantization assays, BSA serves as a reference protein that is used to construct protein standard curves. Ø Standard solutions: known concentrations of samples.
• The preparation of a standard curve is necessary to check whether the method of assaying a particular substances increases in a linear way with its concentration. • The general formula for obtaining different concentrations of a solution by dilution with diluent is: C 1 V 1 = C 2 V 2
How to calculate the concentration • According to beers_law The Beer-Lambert law (Beer’s law) mathematically establishes the relationship between concentration and absorbance in many photometric determinations. Beer’s law is expressed as A = abc • The concentration of substance is directly proportional to the amount of light absorbed or inversely proportional to logarithm of the transmitted light. • A: absorptivity constant for the substance • B: length of the light path through the substance. Ø Reference range for total proteins is : 66. 6 to 81. 4 g/l or 6. 6 to 8. 1 g/dl.
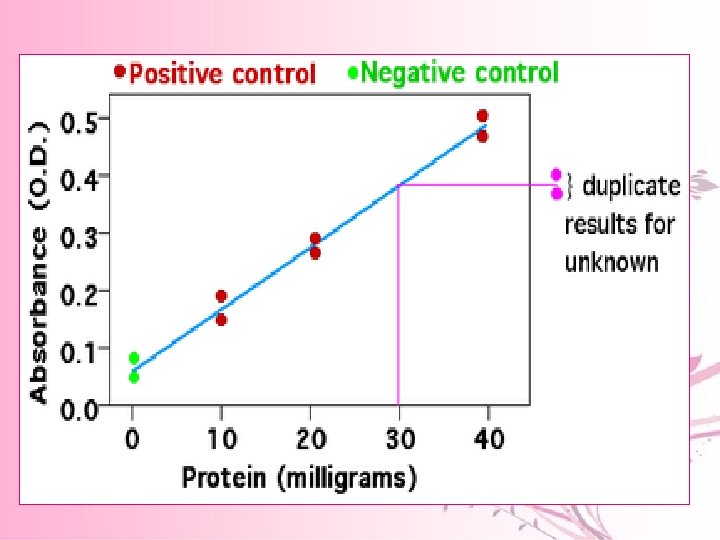
• Multiple samples with known properties are measured and graphed, which then allows the same properties to be determined for unknown samples by interpolation on the graph. • The samples with known properties are the standards, and the graph is the standard curve.
• Draw the points with protein concentrations as x values and the average absorbance as y values on a grid or graph paper • Draw a straight line through the points • Lookup the unknown protein concentration from the plot using the absorbance value of the unknown protein. signal concentration
ü Sensitivity: lowest amount of analyte in a sample which can be detected. ü Specificity: is the ability to assess unequivocally the analyte in the presence of components, which may be expected to be present. ü Linearity of an analytical procedure: is its ability (within a given range) to obtain test results, which are directly proportional to the concentration (amount) of analyte in the sample.
Procedure Tubes D. W (ml) Protein standard (ml) Unknown (ml) Conc. mg/ml 1 0. 5 0 0 2 0. 4 0. 1 0. 4 3 0. 2 0. 8 4 0. 2 0. 3 1. 2 5 0. 1 0. 4 1. 6 6 0 0. 5 2 unknown 0 0 0. 5 After this, add 1 ml of biuret reagent to each tube and mix. Incubate the tubes for 20 minutes at room temperature. Read at 540 nm on spectrophotometer. Make the standard curve and measure the concentration of unknown. Blank solution: is a solution containing little to no analyte of interest, usually used to calibrate instruments such as a colorimeter.