Quantitative Analysis 3 Zvi Wiener 02 588 3049




- Slides: 47
Quantitative Analysis 3 Zvi Wiener 02 -588 -3049 http: //pluto. mscc. huji. ac. il/~mswiener/zvi. html QA-3 FRM-GARP Sep-2001
Fundamentals of Statistics Following Jorion 2001 Financial Risk Manager Handbook QA-3 FRM-GARP Sep-2001
Statistics and Probability Estimation Tests of hypotheses http: //www. tfii. org Zvi Wiener - QA 3 3
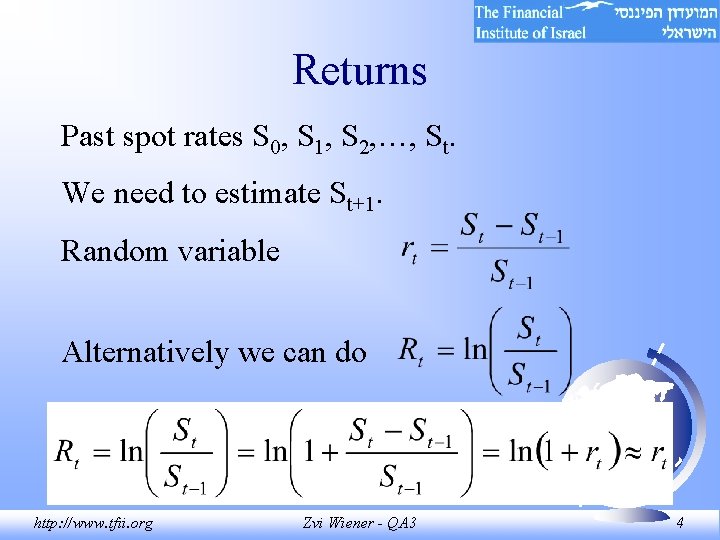
Returns Past spot rates S 0, S 1, S 2, …, St. We need to estimate St+1. Random variable Alternatively we can do http: //www. tfii. org Zvi Wiener - QA 3 4
Independent returns A very important question is whether a sequence of observations can be viewed as independent. If so, one could assume that it is drawn from a known distribution and then one can estimate parameters. In an efficient market returns on traded assets are independent. http: //www. tfii. org Zvi Wiener - QA 3 5
Random Walk We could consider that the observations rt are independent draws from the same distribution N( , 2). They are called i. i. d. = independently and identically distributed. An extension of this model is a non-stationary environment. Often fat tails are observed. http: //www. tfii. org Zvi Wiener - QA 3 6
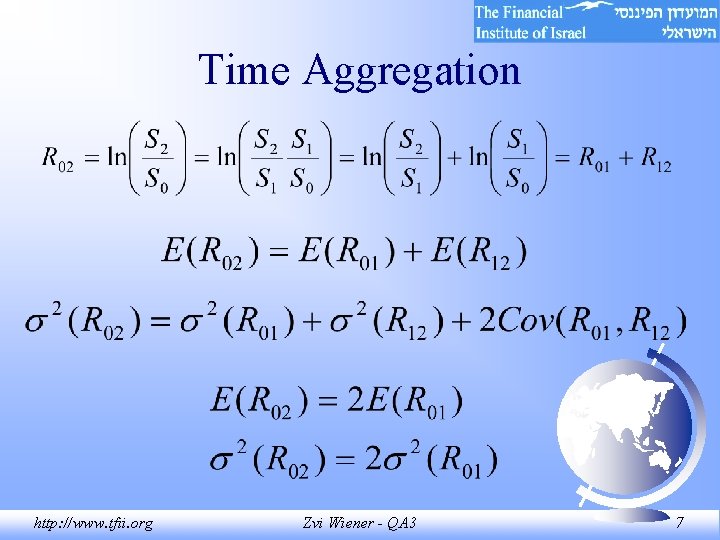
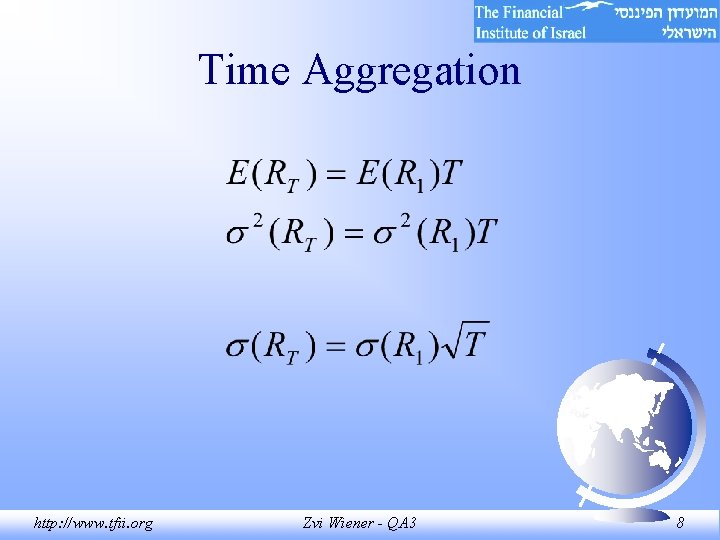
Time Aggregation http: //www. tfii. org Zvi Wiener - QA 3 7
Time Aggregation http: //www. tfii. org Zvi Wiener - QA 3 8
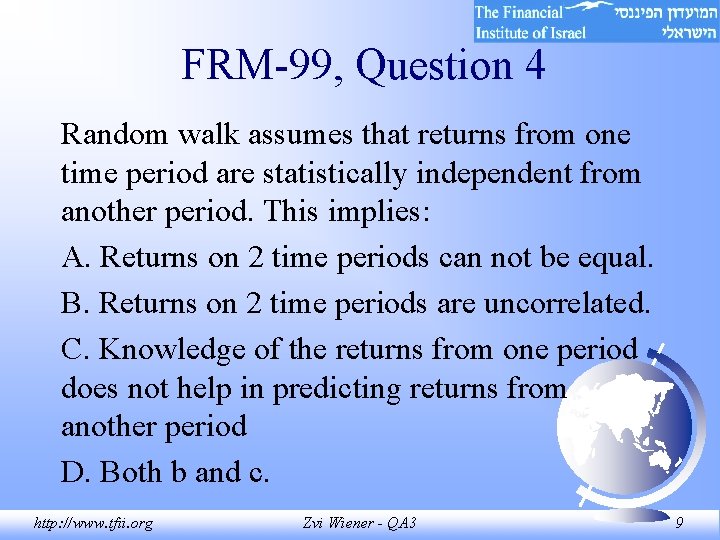
FRM-99, Question 4 Random walk assumes that returns from one time period are statistically independent from another period. This implies: A. Returns on 2 time periods can not be equal. B. Returns on 2 time periods are uncorrelated. C. Knowledge of the returns from one period does not help in predicting returns from another period D. Both b and c. http: //www. tfii. org Zvi Wiener - QA 3 9
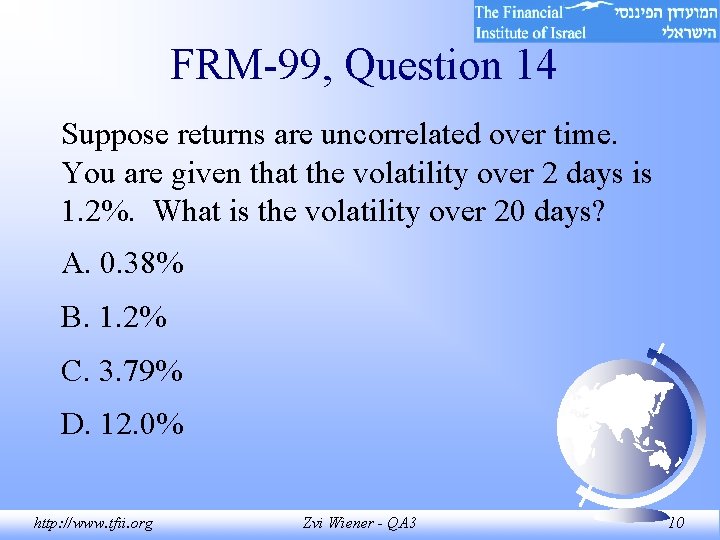
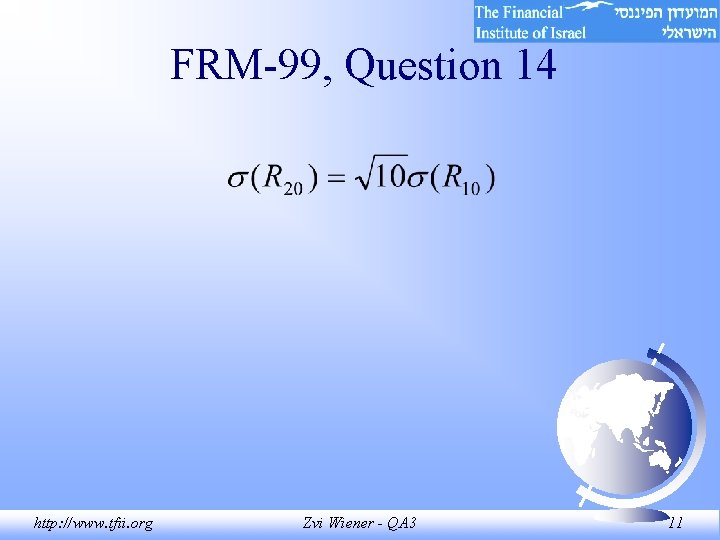
FRM-99, Question 14 Suppose returns are uncorrelated over time. You are given that the volatility over 2 days is 1. 2%. What is the volatility over 20 days? A. 0. 38% B. 1. 2% C. 3. 79% D. 12. 0% http: //www. tfii. org Zvi Wiener - QA 3 10
FRM-99, Question 14 http: //www. tfii. org Zvi Wiener - QA 3 11
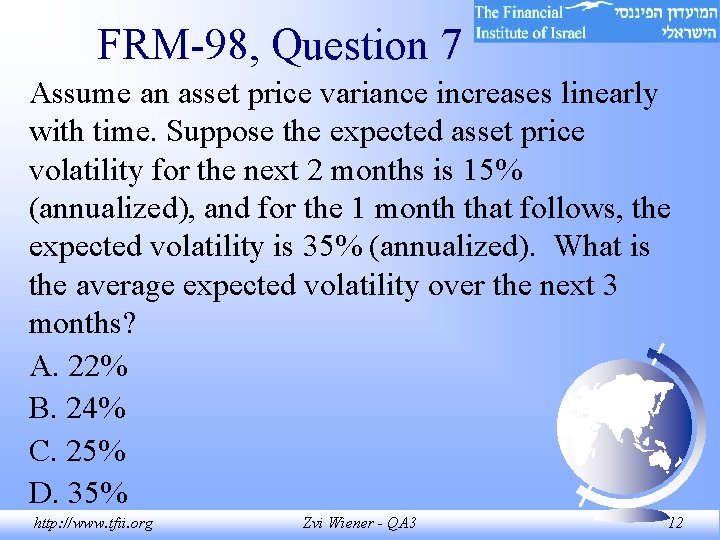
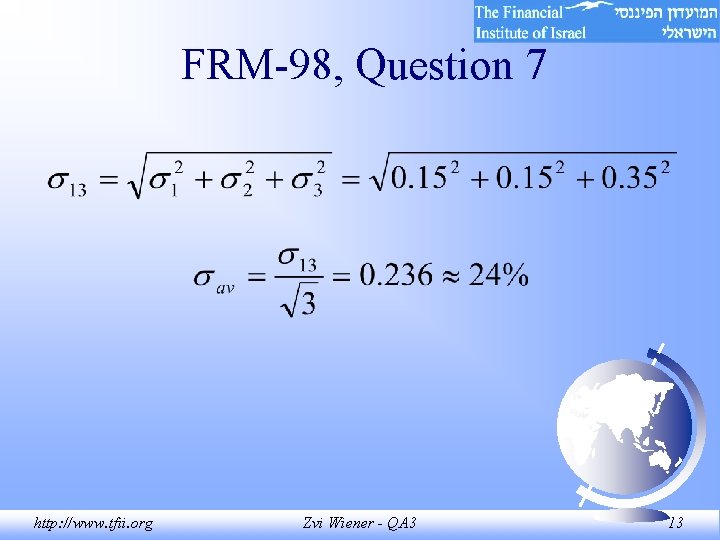
FRM-98, Question 7 Assume an asset price variance increases linearly with time. Suppose the expected asset price volatility for the next 2 months is 15% (annualized), and for the 1 month that follows, the expected volatility is 35% (annualized). What is the average expected volatility over the next 3 months? A. 22% B. 24% C. 25% D. 35% http: //www. tfii. org Zvi Wiener - QA 3 12
FRM-98, Question 7 http: //www. tfii. org Zvi Wiener - QA 3 13
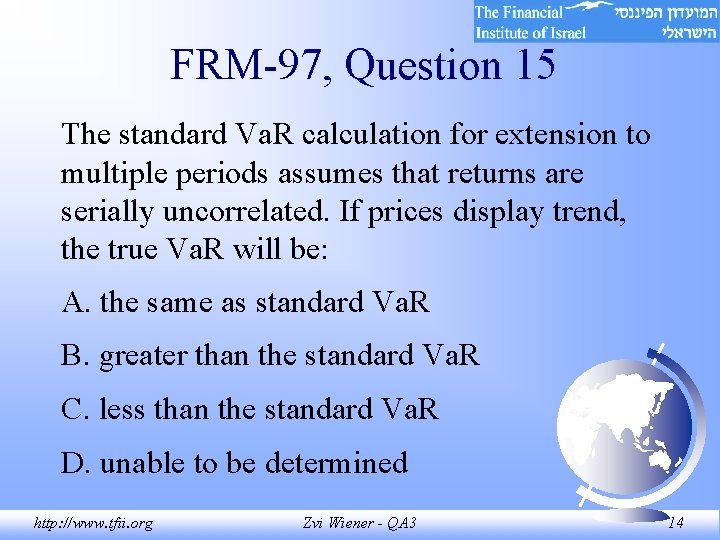
FRM-97, Question 15 The standard Va. R calculation for extension to multiple periods assumes that returns are serially uncorrelated. If prices display trend, the true Va. R will be: A. the same as standard Va. R B. greater than the standard Va. R C. less than the standard Va. R D. unable to be determined http: //www. tfii. org Zvi Wiener - QA 3 14
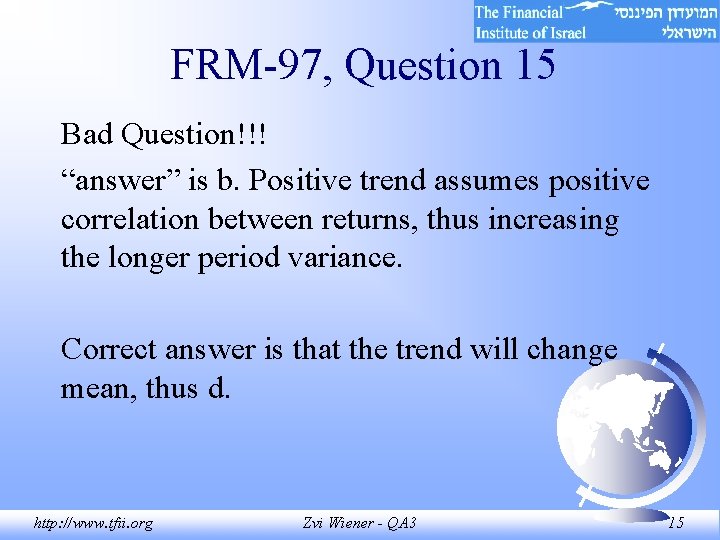
FRM-97, Question 15 Bad Question!!! “answer” is b. Positive trend assumes positive correlation between returns, thus increasing the longer period variance. Correct answer is that the trend will change mean, thus d. http: //www. tfii. org Zvi Wiener - QA 3 15
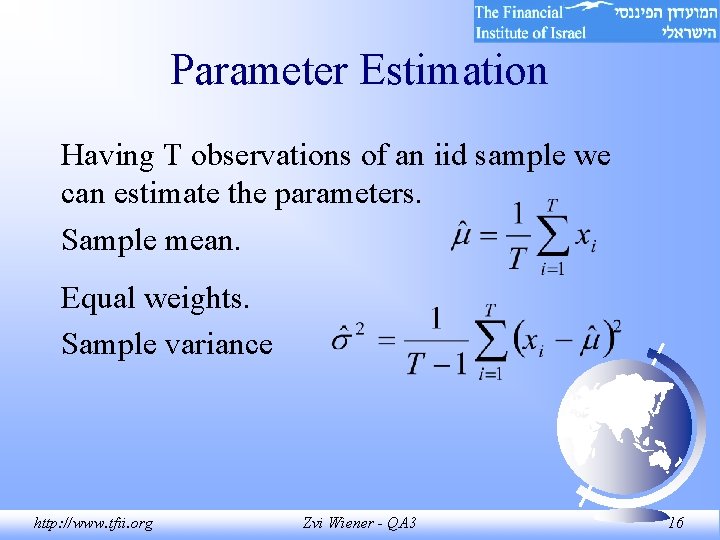
Parameter Estimation Having T observations of an iid sample we can estimate the parameters. Sample mean. Equal weights. Sample variance http: //www. tfii. org Zvi Wiener - QA 3 16
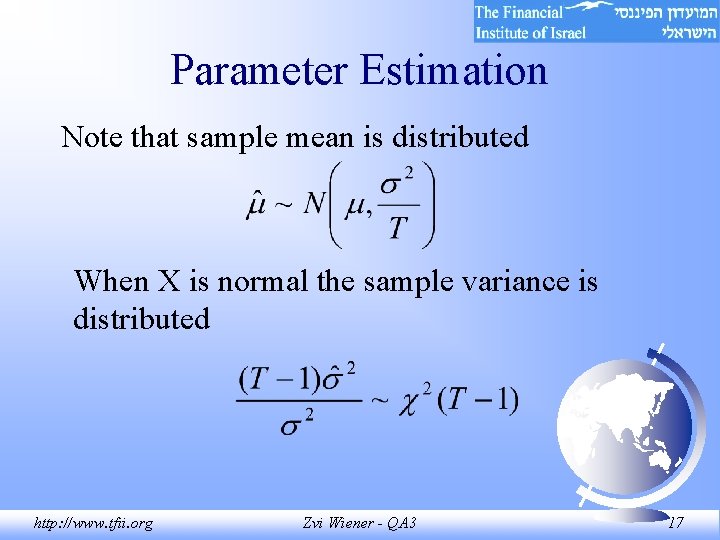
Parameter Estimation Note that sample mean is distributed When X is normal the sample variance is distributed http: //www. tfii. org Zvi Wiener - QA 3 17
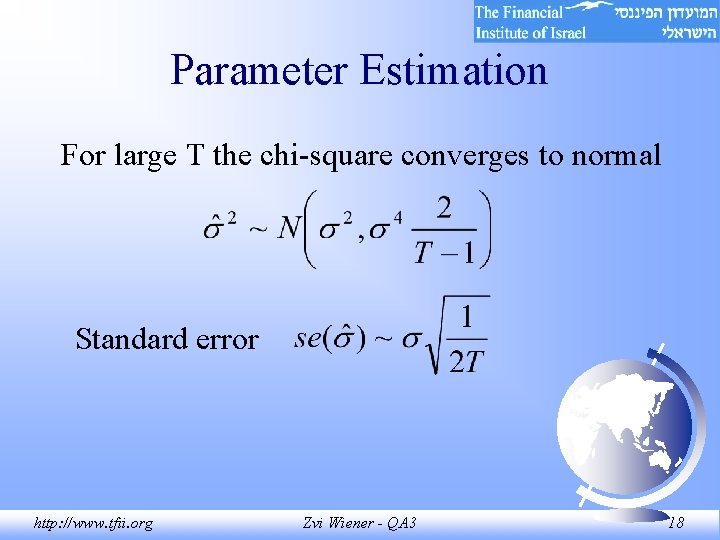
Parameter Estimation For large T the chi-square converges to normal Standard error http: //www. tfii. org Zvi Wiener - QA 3 18
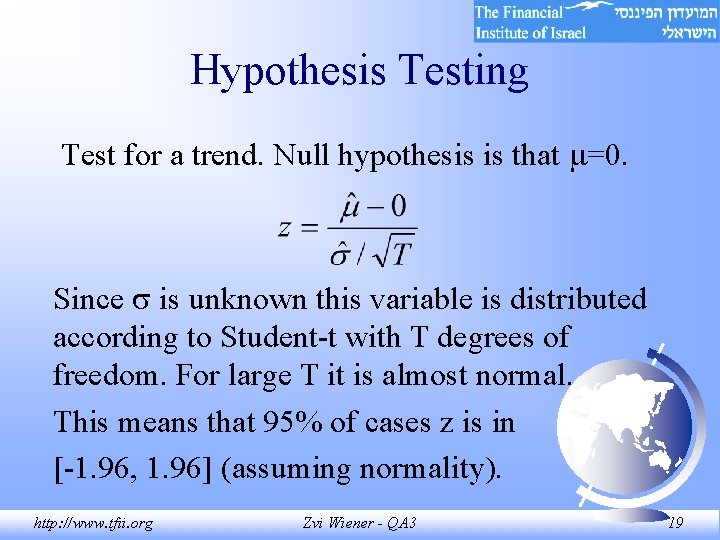
Hypothesis Testing Test for a trend. Null hypothesis is that =0. Since is unknown this variable is distributed according to Student-t with T degrees of freedom. For large T it is almost normal. This means that 95% of cases z is in [-1. 96, 1. 96] (assuming normality). http: //www. tfii. org Zvi Wiener - QA 3 19
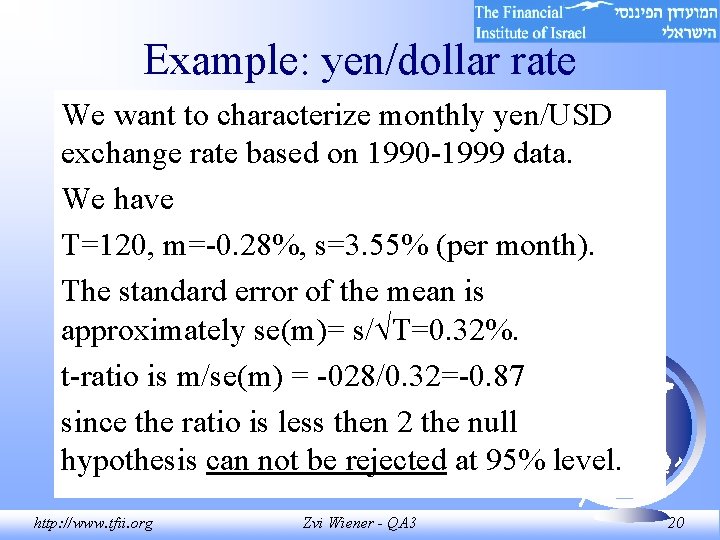
Example: yen/dollar rate We want to characterize monthly yen/USD exchange rate based on 1990 -1999 data. We have T=120, m=-0. 28%, s=3. 55% (per month). The standard error of the mean is approximately se(m)= s/ T=0. 32%. t-ratio is m/se(m) = -028/0. 32=-0. 87 since the ratio is less then 2 the null hypothesis can not be rejected at 95% level. http: //www. tfii. org Zvi Wiener - QA 3 20
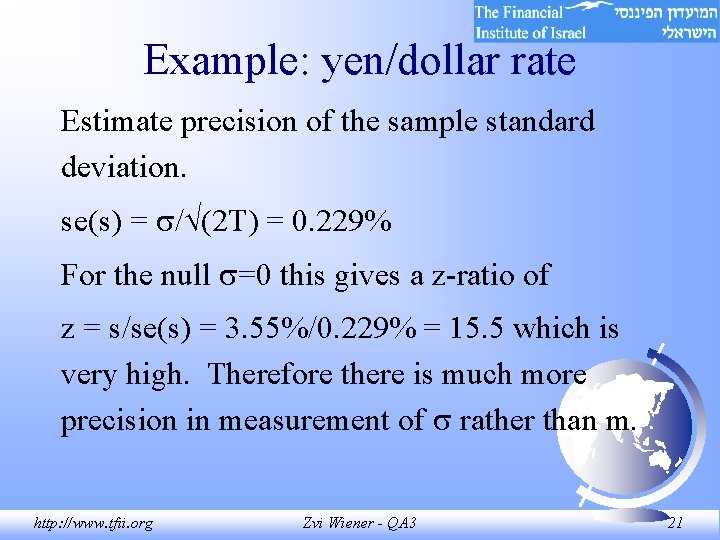
Example: yen/dollar rate Estimate precision of the sample standard deviation. se(s) = / (2 T) = 0. 229% For the null =0 this gives a z-ratio of z = s/se(s) = 3. 55%/0. 229% = 15. 5 which is very high. Therefore there is much more precision in measurement of rather than m. http: //www. tfii. org Zvi Wiener - QA 3 21
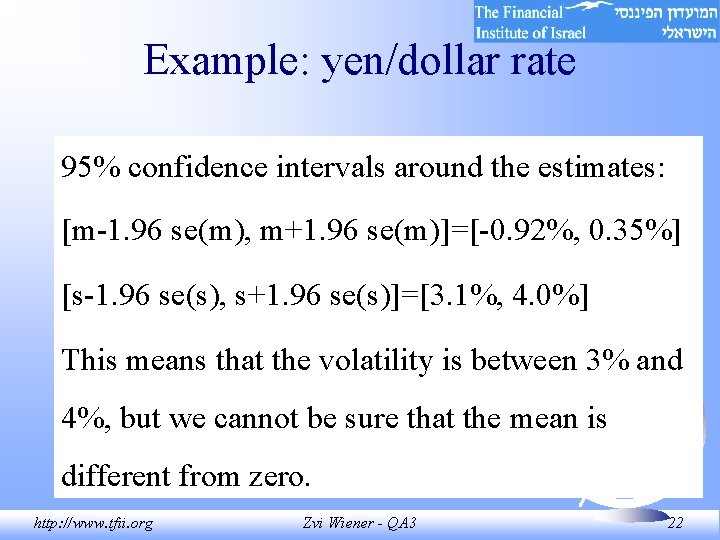
Example: yen/dollar rate 95% confidence intervals around the estimates: [m-1. 96 se(m), m+1. 96 se(m)]=[-0. 92%, 0. 35%] [s-1. 96 se(s), s+1. 96 se(s)]=[3. 1%, 4. 0%] This means that the volatility is between 3% and 4%, but we cannot be sure that the mean is different from zero. http: //www. tfii. org Zvi Wiener - QA 3 22
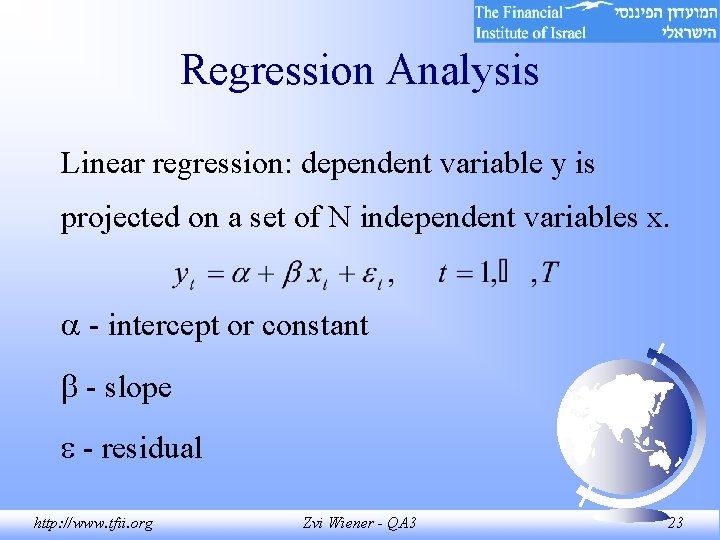
Regression Analysis Linear regression: dependent variable y is projected on a set of N independent variables x. - intercept or constant - slope - residual http: //www. tfii. org Zvi Wiener - QA 3 23
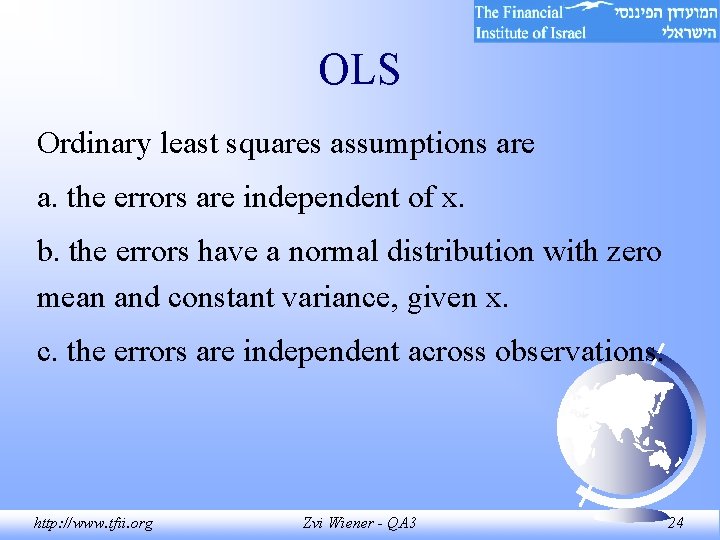
OLS Ordinary least squares assumptions are a. the errors are independent of x. b. the errors have a normal distribution with zero mean and constant variance, given x. c. the errors are independent across observations. http: //www. tfii. org Zvi Wiener - QA 3 24
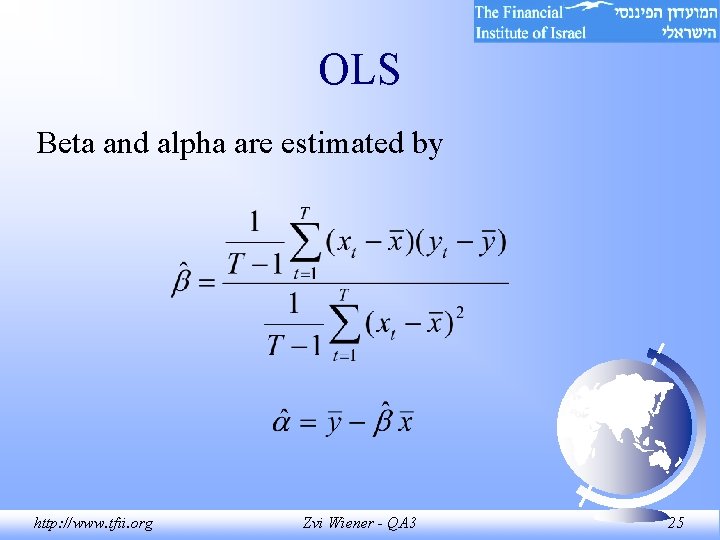
OLS Beta and alpha are estimated by http: //www. tfii. org Zvi Wiener - QA 3 25
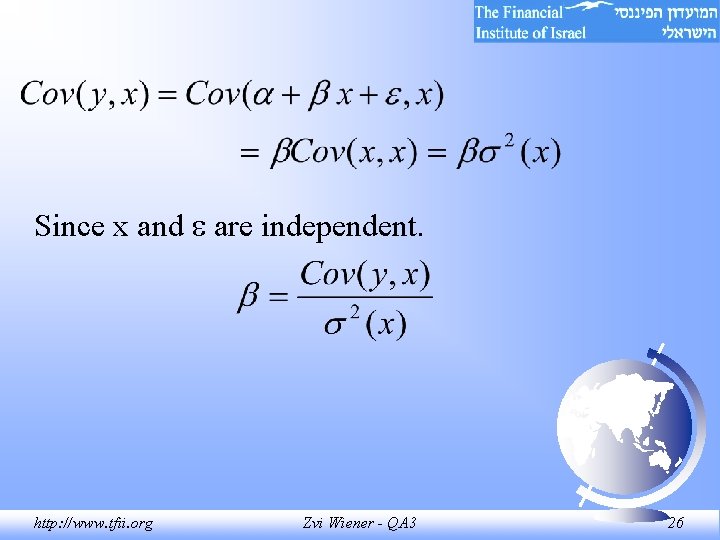
Since x and are independent. http: //www. tfii. org Zvi Wiener - QA 3 26
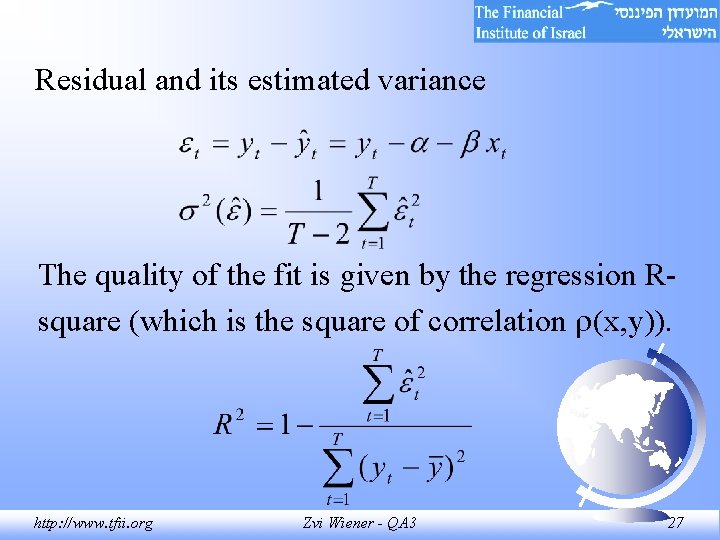
Residual and its estimated variance The quality of the fit is given by the regression Rsquare (which is the square of correlation (x, y)). http: //www. tfii. org Zvi Wiener - QA 3 27
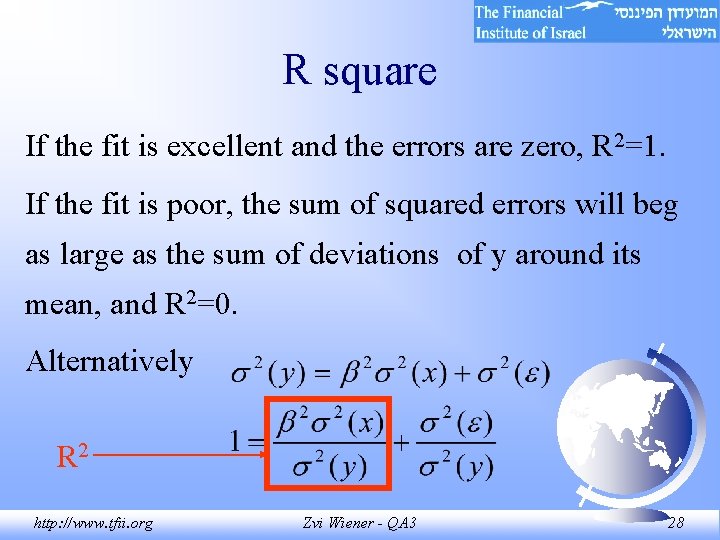
R square If the fit is excellent and the errors are zero, R 2=1. If the fit is poor, the sum of squared errors will beg as large as the sum of deviations of y around its mean, and R 2=0. Alternatively R 2 http: //www. tfii. org Zvi Wiener - QA 3 28
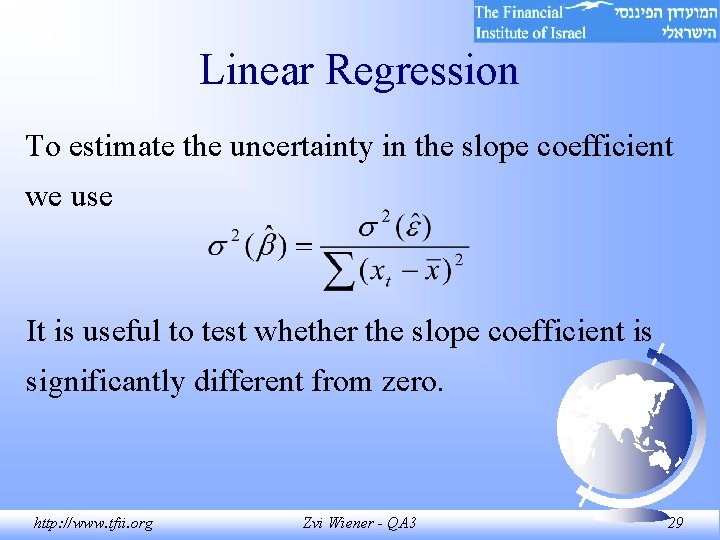
Linear Regression To estimate the uncertainty in the slope coefficient we use It is useful to test whether the slope coefficient is significantly different from zero. http: //www. tfii. org Zvi Wiener - QA 3 29
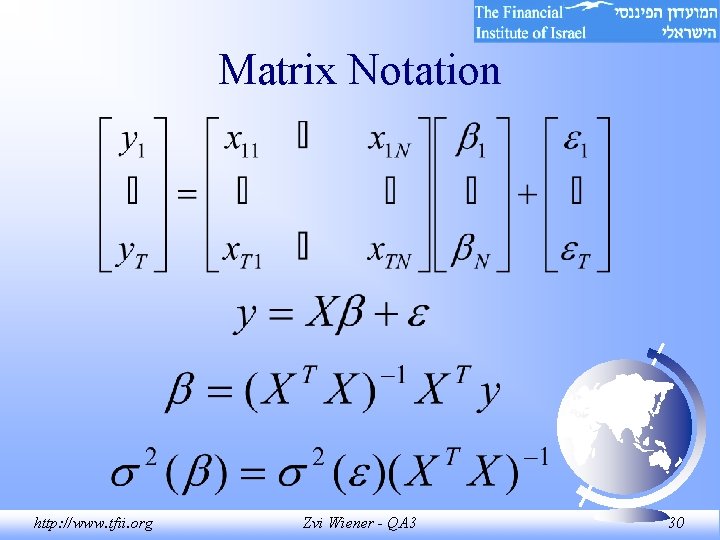
Matrix Notation http: //www. tfii. org Zvi Wiener - QA 3 30
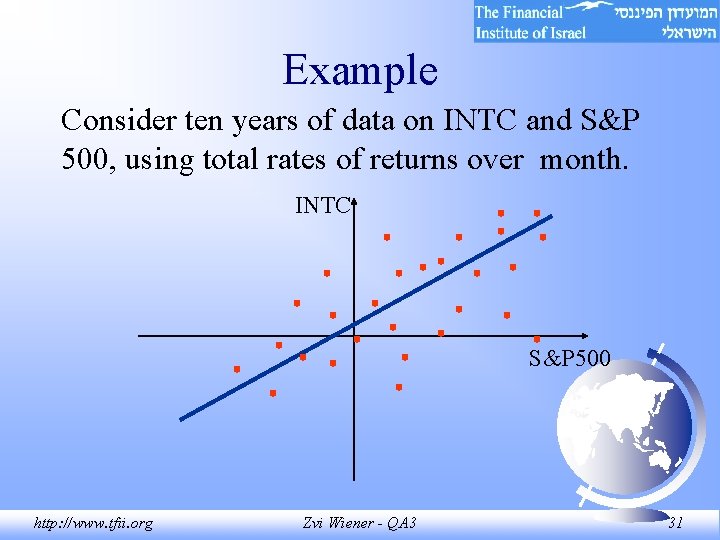
Example Consider ten years of data on INTC and S&P 500, using total rates of returns over month. INTC S&P 500 http: //www. tfii. org Zvi Wiener - QA 3 31
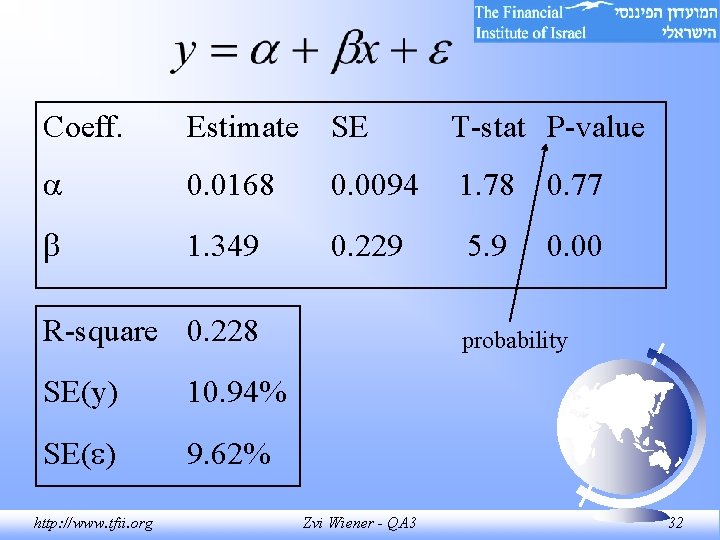
Coeff. Estimate SE T-stat P-value 0. 0168 0. 0094 1. 78 0. 77 1. 349 0. 229 5. 9 0. 00 R-square 0. 228 SE(y) 10. 94% SE( ) 9. 62% http: //www. tfii. org probability Zvi Wiener - QA 3 32
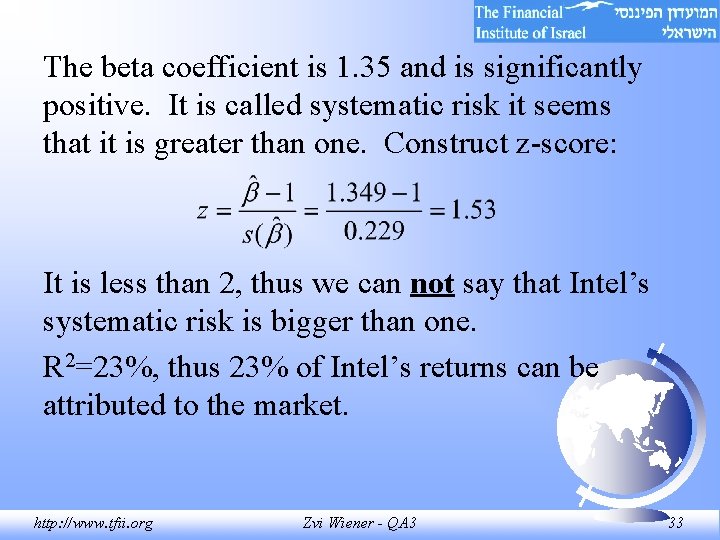
The beta coefficient is 1. 35 and is significantly positive. It is called systematic risk it seems that it is greater than one. Construct z-score: It is less than 2, thus we can not say that Intel’s systematic risk is bigger than one. R 2=23%, thus 23% of Intel’s returns can be attributed to the market. http: //www. tfii. org Zvi Wiener - QA 3 33
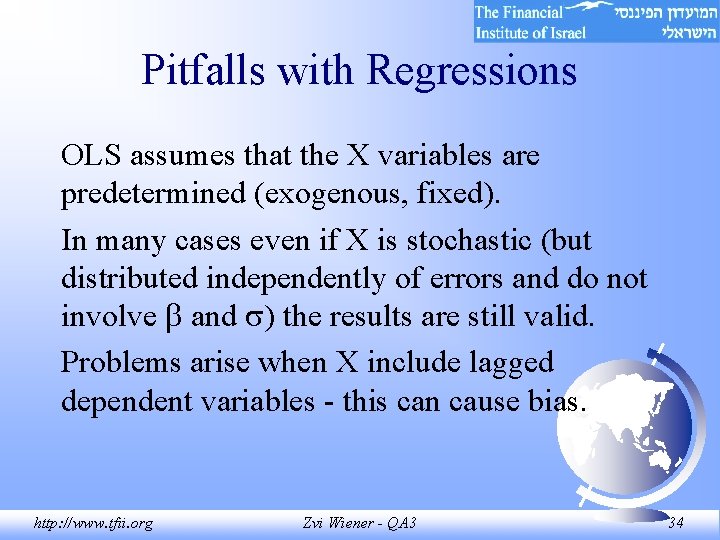
Pitfalls with Regressions OLS assumes that the X variables are predetermined (exogenous, fixed). In many cases even if X is stochastic (but distributed independently of errors and do not involve and ) the results are still valid. Problems arise when X include lagged dependent variables - this can cause bias. http: //www. tfii. org Zvi Wiener - QA 3 34
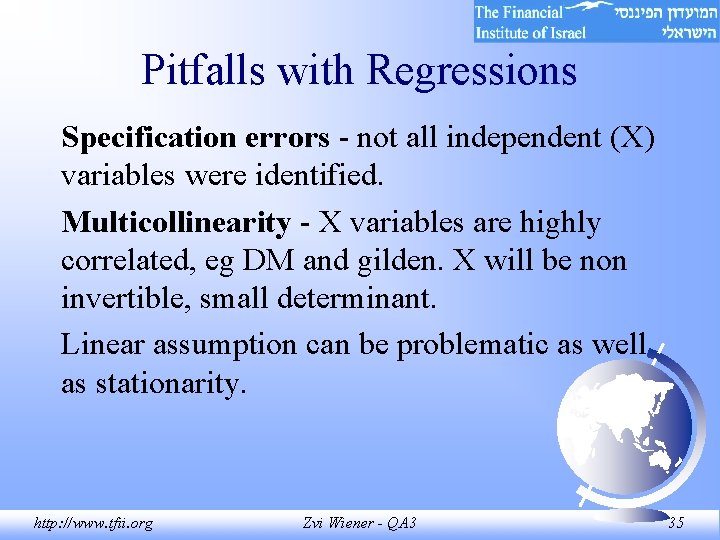
Pitfalls with Regressions Specification errors - not all independent (X) variables were identified. Multicollinearity - X variables are highly correlated, eg DM and gilden. X will be non invertible, small determinant. Linear assumption can be problematic as well as stationarity. http: //www. tfii. org Zvi Wiener - QA 3 35
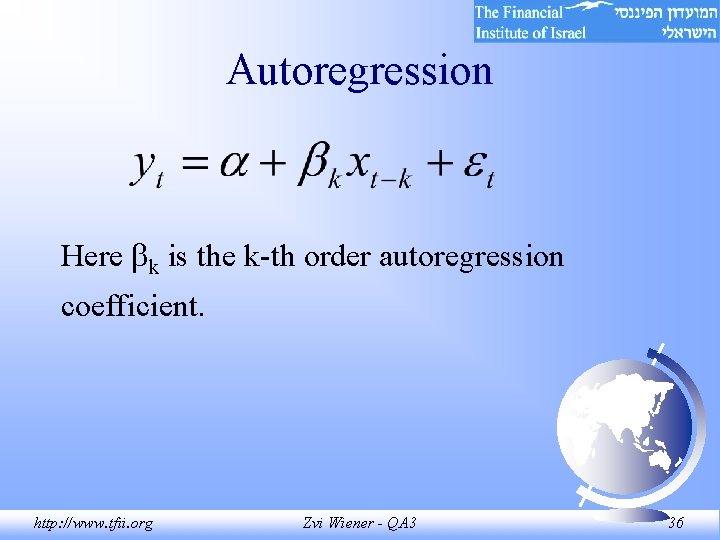
Autoregression Here k is the k-th order autoregression coefficient. http: //www. tfii. org Zvi Wiener - QA 3 36
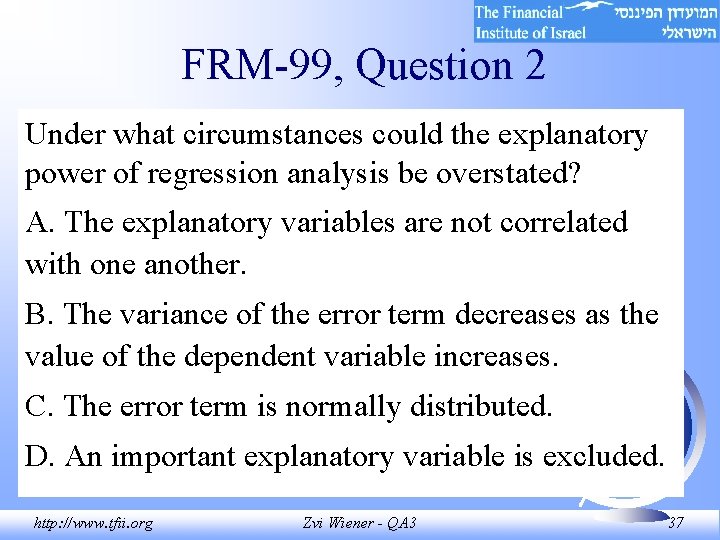
FRM-99, Question 2 Under what circumstances could the explanatory power of regression analysis be overstated? A. The explanatory variables are not correlated with one another. B. The variance of the error term decreases as the value of the dependent variable increases. C. The error term is normally distributed. D. An important explanatory variable is excluded. http: //www. tfii. org Zvi Wiener - QA 3 37
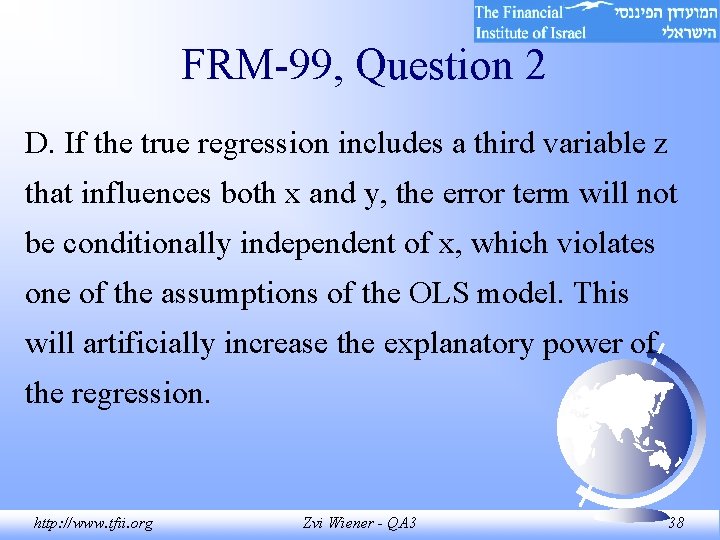
FRM-99, Question 2 D. If the true regression includes a third variable z that influences both x and y, the error term will not be conditionally independent of x, which violates one of the assumptions of the OLS model. This will artificially increase the explanatory power of the regression. http: //www. tfii. org Zvi Wiener - QA 3 38
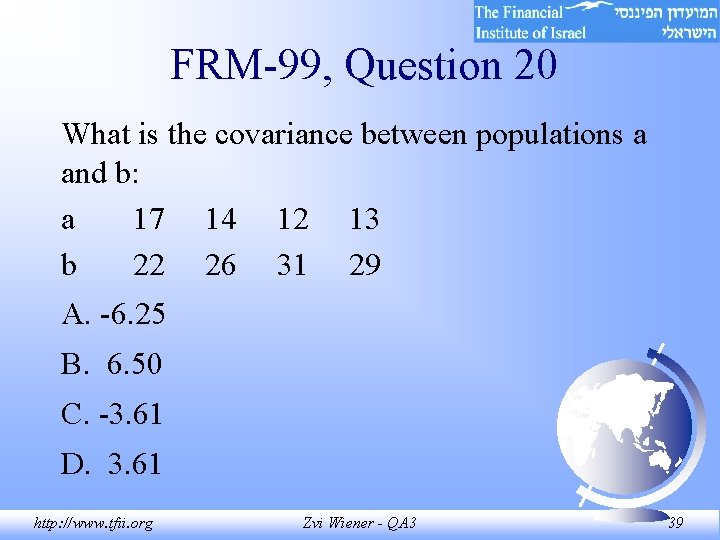
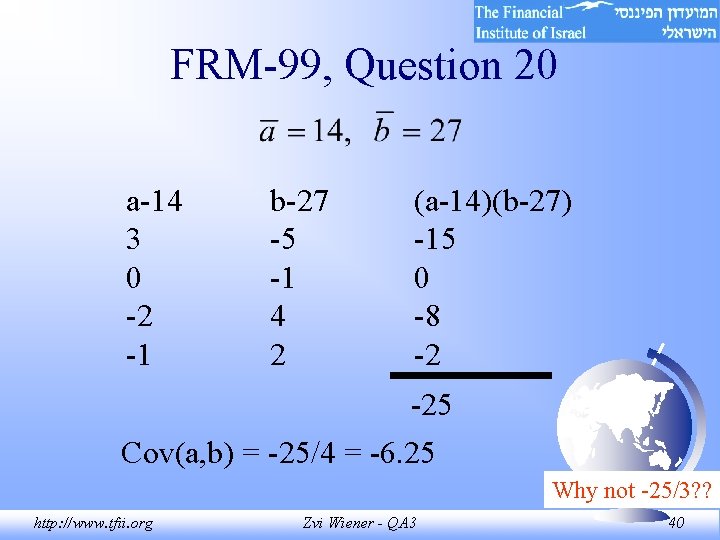
FRM-99, Question 20 What is the covariance between populations a and b: a 17 14 12 13 b 22 26 31 29 A. -6. 25 B. 6. 50 C. -3. 61 D. 3. 61 http: //www. tfii. org Zvi Wiener - QA 3 39
FRM-99, Question 20 a-14 3 0 -2 -1 b-27 -5 -1 4 2 (a-14)(b-27) -15 0 -8 -2 -25 Cov(a, b) = -25/4 = -6. 25 Why not -25/3? ? http: //www. tfii. org Zvi Wiener - QA 3 40
FRM-99, Question 6 Daily returns on spot positions of the Euro against USD are highly correlated with returns on spot holdings of Yen against USD. This implies that: A. When Euro strengthens against USD, the yen also tends to strengthens, but returns are not necessarily equal. B. The two sets of returns tend to be almost equal C. The two sets of returns tend to be almost equal in magnitude but opposite in sign. D. None of the above. http: //www. tfii. org Zvi Wiener - QA 3 41
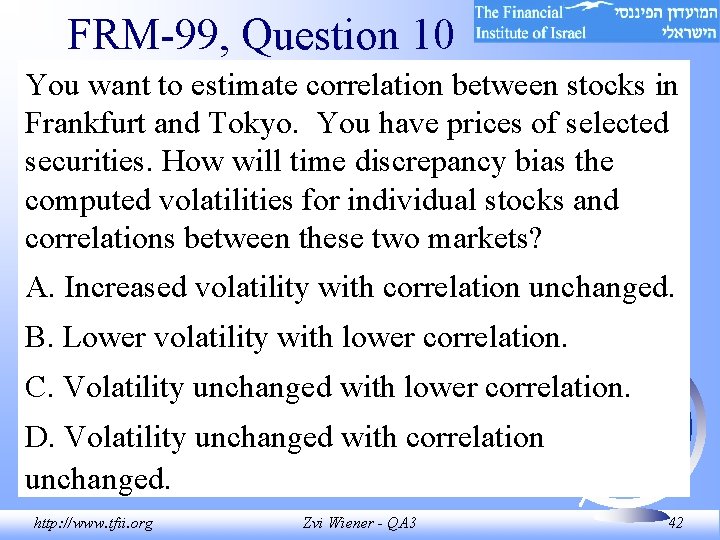
FRM-99, Question 10 You want to estimate correlation between stocks in Frankfurt and Tokyo. You have prices of selected securities. How will time discrepancy bias the computed volatilities for individual stocks and correlations between these two markets? A. Increased volatility with correlation unchanged. B. Lower volatility with lower correlation. C. Volatility unchanged with lower correlation. D. Volatility unchanged with correlation unchanged. http: //www. tfii. org Zvi Wiener - QA 3 42
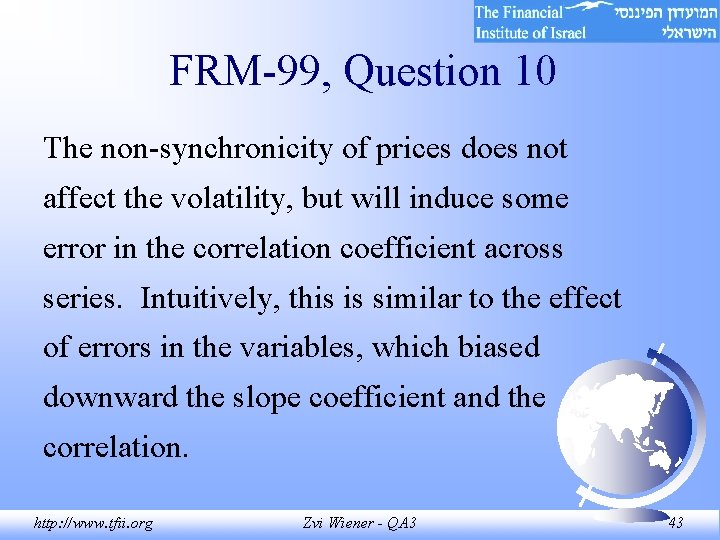
FRM-99, Question 10 The non-synchronicity of prices does not affect the volatility, but will induce some error in the correlation coefficient across series. Intuitively, this is similar to the effect of errors in the variables, which biased downward the slope coefficient and the correlation. http: //www. tfii. org Zvi Wiener - QA 3 43
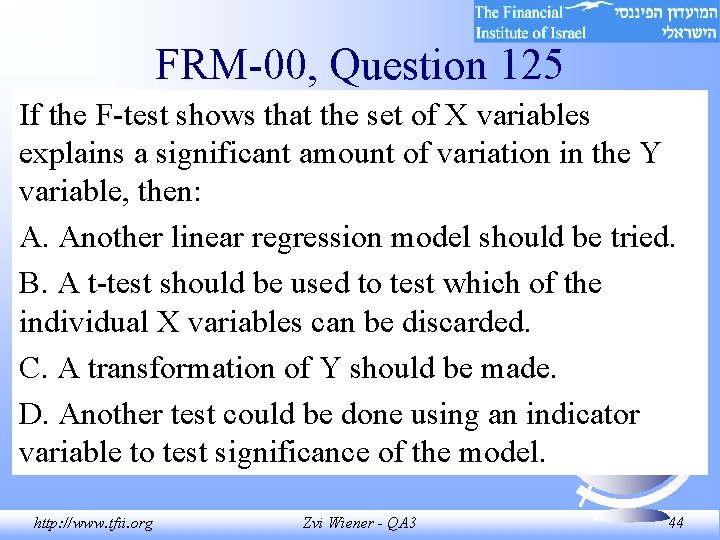
FRM-00, Question 125 If the F-test shows that the set of X variables explains a significant amount of variation in the Y variable, then: A. Another linear regression model should be tried. B. A t-test should be used to test which of the individual X variables can be discarded. C. A transformation of Y should be made. D. Another test could be done using an indicator variable to test significance of the model. http: //www. tfii. org Zvi Wiener - QA 3 44
FRM-00, Question 125 The F-test applies to the group of variables but does not say which one is most significant. To identify which particular variable is significant or not, we use a t-test and discard the variables that do not display individual significance. http: //www. tfii. org Zvi Wiener - QA 3 45
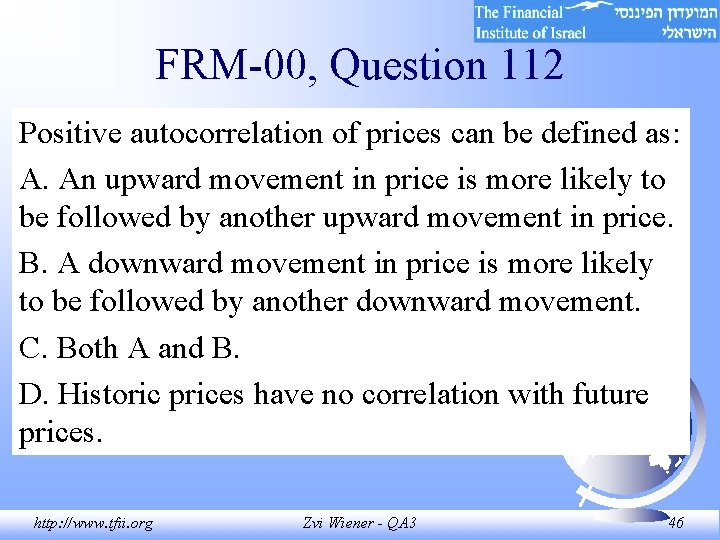
FRM-00, Question 112 Positive autocorrelation of prices can be defined as: A. An upward movement in price is more likely to be followed by another upward movement in price. B. A downward movement in price is more likely to be followed by another downward movement. C. Both A and B. D. Historic prices have no correlation with future prices. http: //www. tfii. org Zvi Wiener - QA 3 46
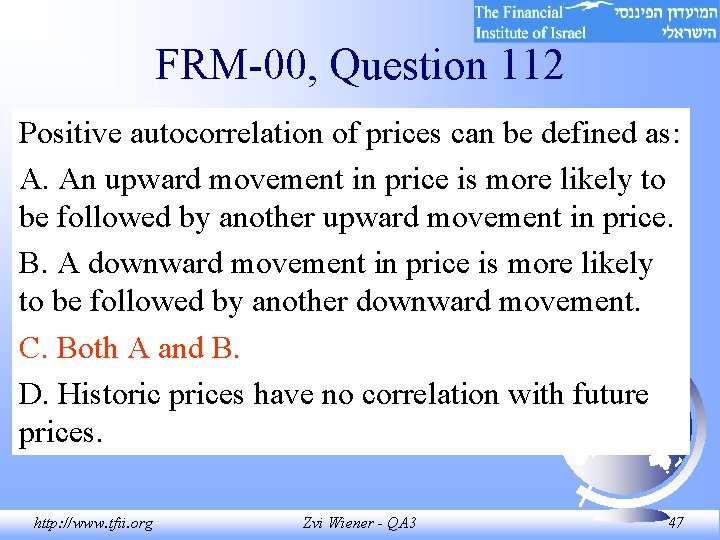
FRM-00, Question 112 Positive autocorrelation of prices can be defined as: A. An upward movement in price is more likely to be followed by another upward movement in price. B. A downward movement in price is more likely to be followed by another downward movement. C. Both A and B. D. Historic prices have no correlation with future prices. http: //www. tfii. org Zvi Wiener - QA 3 47