Quality assurance for TPC Quality assurance Process Detect


 ● TPC in lucky situation - TPC test in 2006")
 1) Quality assurance based on the statistical properties of the data")


 ● Data quality monitoring based on statistical properties of data - Extracting")


- Slides: 24
Quality assurance for TPC
Quality assurance ● Process: ● Detect the problems ● ● What do we expect? ● ● Define, what is the problem Defined in the TDR and in the PPR on the basis of simulation Until which point the detector the information form the detector is reasonable? ● How far we are from the expectation? – Define the limits of working conditions ● Modify expectation
TPC Quality assurance (-1) ● TPC in lucky situation - TPC test in 2006 – ● The base things – according expectation – ● ● Answer to the part of the questions Space point resolution, cluster shape, d. Edx resolution Some not – The noise edge effect – Floating wires with higher gain Current “feeling” - from reconstruction point of view such effect should not affect the performance of the TPC
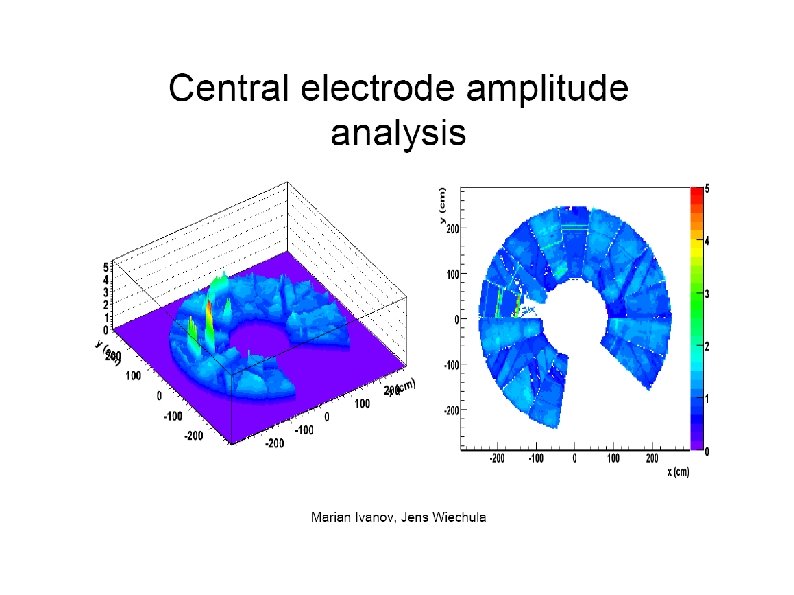
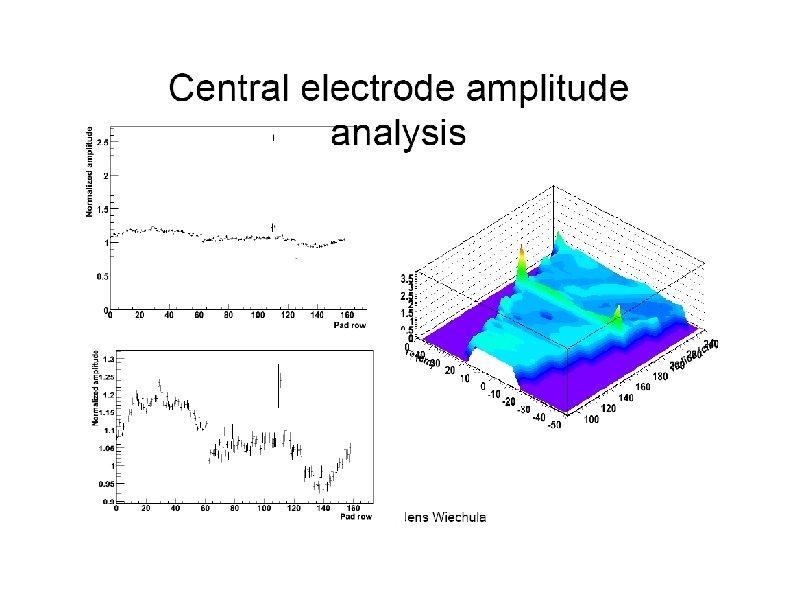
Quality assurance (0) 1) Quality assurance based on the statistical properties of the data 1) Using data from calibration algorithm (Calibration viewer adopted to the Ali. Eve) 2) Comparison of the MC data with the reconstructed data 1) Code in PWG 1 2) Implemented as components 3) Usage in the Ali. Analysis not yet tested-implemented (Work in progress) 3) Low level monitoring – e. g counters to be implemented 4) Some low level histograms – e. g. mean amplitude vs z, vs x only qualitative information 5) More details summarized in the amore. document (H. Helstrup)
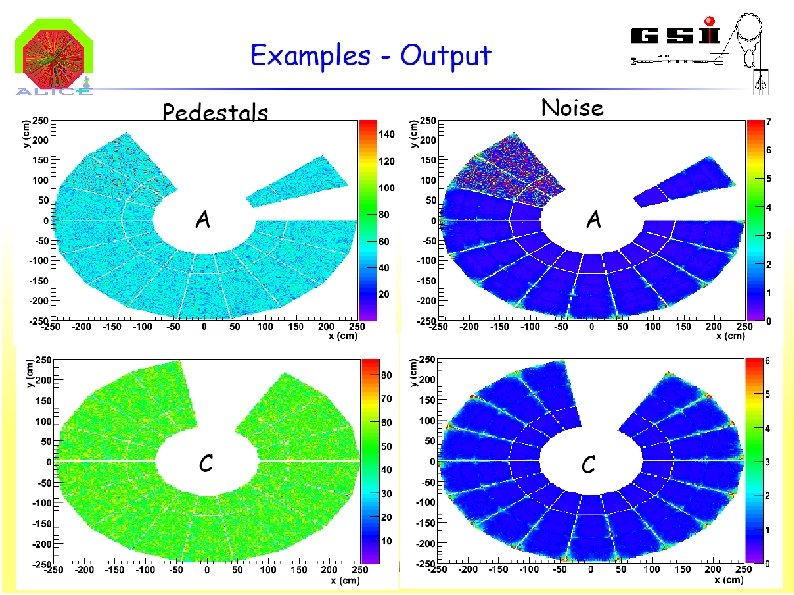
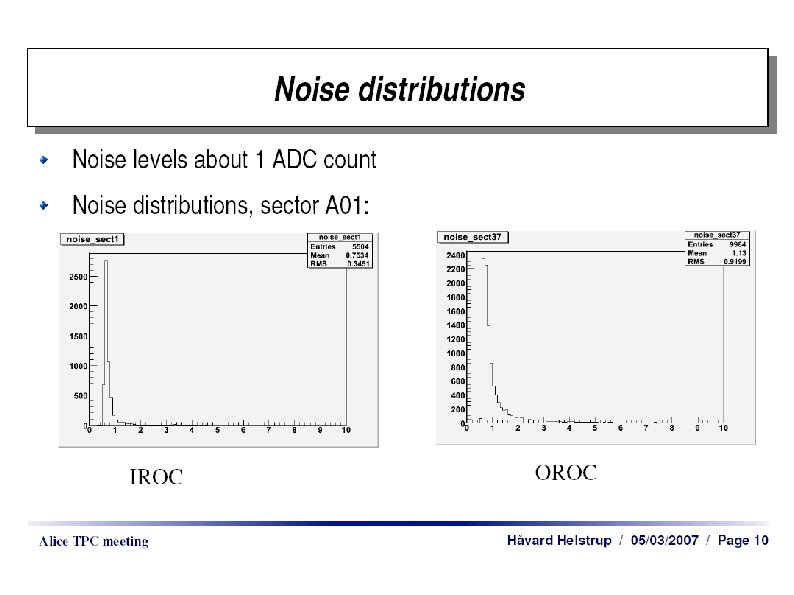
Quality assurance ● Data quality monitoring based on statistical properties of data - Extracting in calibration procedure ● ● ● Low level – digit level: – Noise and pedestal calibration – Electronic gain calibration – Time 0 calibration Direct answer – Number of dead channels – Percentage of suspicious channels Alarms: – ? To be defined ? - Consult with Hardware people
Calib. Viewer Functionality: Draw. Histo 1 D: Draws histogram for given sector with mean and different σ intervals – Draw. Histo 1 D(char* type, Int_t sector, TVector. F& nsigma) – Tvector. F vec(3); vec[0]=1; . . . – Draw. Histo 1 D("CEQmean", 34, vec)
Calib. Viewer Functionality: Sigma. Cut: Shows fraction of rejected pads for different σ cuts – Sigma. Cut(char* type, Int_t sector, Float_t sigma. Max, Float_t sigma. Step) – Sigma. Cut("CEQmean", 34, 5, 0. 05)
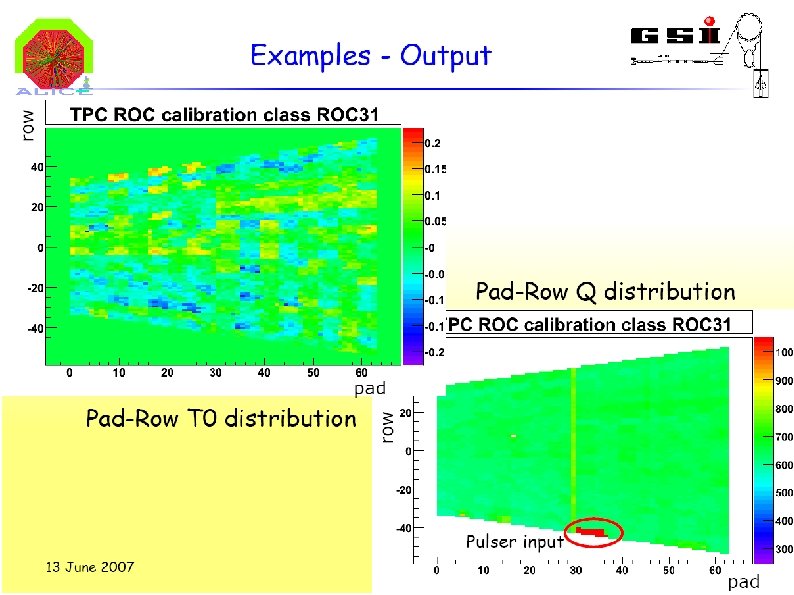
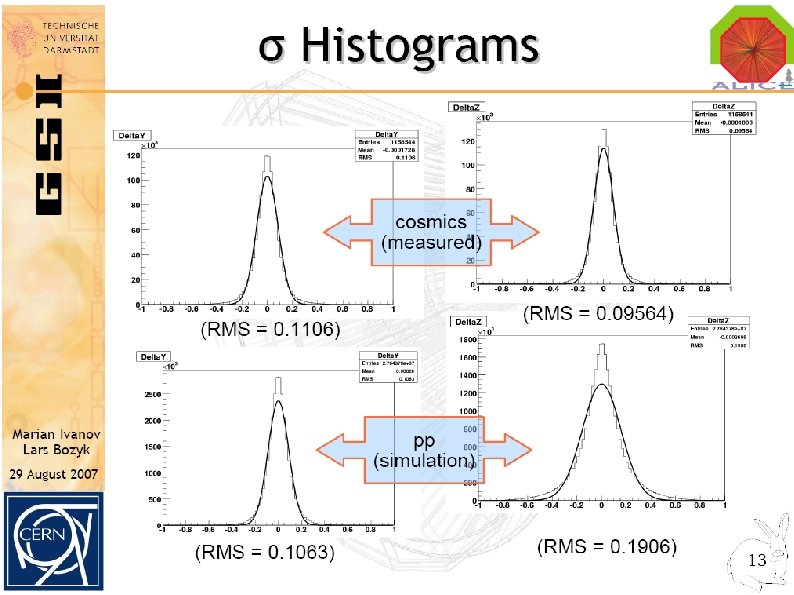
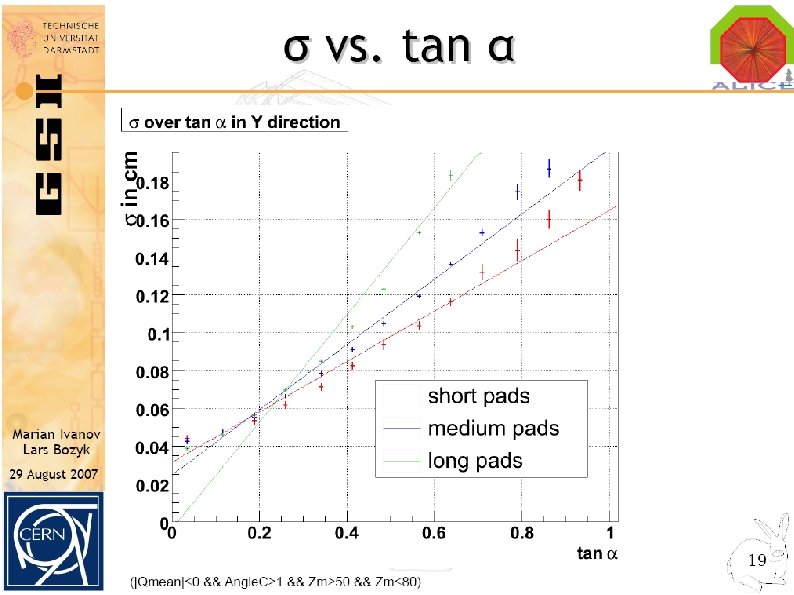
Quality assurance(2) ● Data quality monitoring based on statistical properties of data - Extracting in calibration procedure ● High level (track- cluster level): – Time 0 calibration - Detection of outliers (alarms) ● Gain calibration using cosmic – Detection of outliers (alarms) ● Space point resolution parametrization and cluster shape parametrization – Pulls for sectors, pad-rows, detection of outliers (alarms) ● DCA resolution, theta – fi dependence
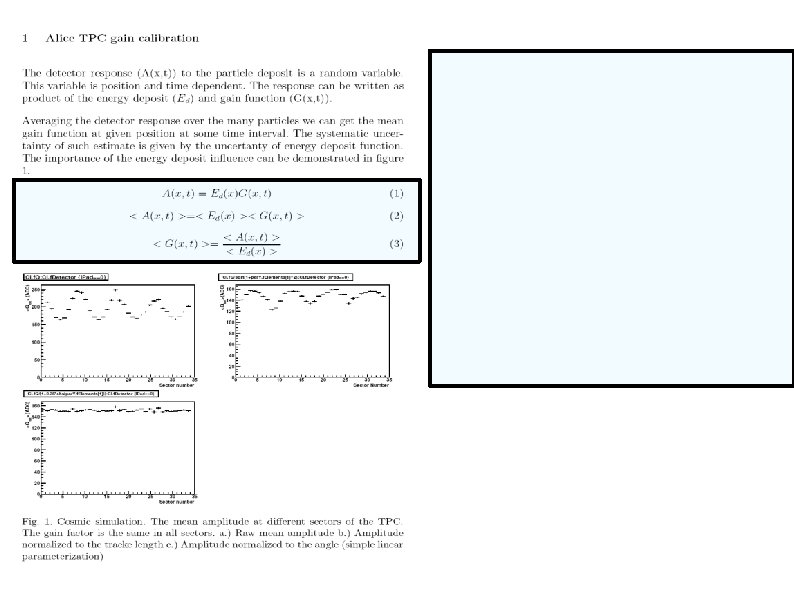
The energy deposit is particle and angular dependent Example, mean aplitude as function of z - comparison of the pp event and cosmic (MC) data
● ● Calibration algorithm Component model – The input and output clearly defined – External event loop (Possibility to plugin component to the DAQ DA, HLT DA, OFFLINE code, selectors, Ali. Analisys*) The data source - Input – Raw data – Set of clusters belonging to the track Output – Calibration components provides the functionality to generate different histograms, views, graphs The calibration constants can be grouped to the database (Ttree) with simple Query mechanism ● BASE feature to make simple and powerful data visualization
Usage of the Calibration algorithm in QA ● 2 Options: – Use the CA component to generate predefined views, histograms ● – Access the calibration data during the data taking ● ● Problem: Duplication of the CPU requirements Problem: Not possible in all of the cases (Restricted access) More details summarized in the amore. document (H. Helstrup)
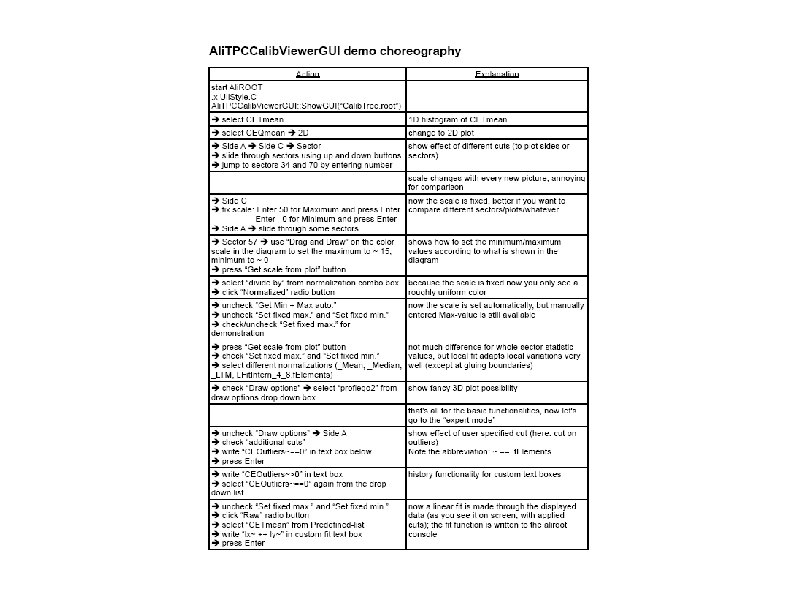
TPC Calibration Viewer GUI This demo can easily be opened with the following command at the aliroot prompt: ( http: //indico. cern. ch/conference. Display. py? conf. Id=17348) Ali. TPCCalib. Viewer. GUI: : Show. GUI("Calib. Tree. root") (Calib. Tree. root is a file containing calibration data generated with Make. Tree) GUI realized as a TGComposite. Frame • possibility to open different views in several tabs • allows integration into existing frameworks (Ali. Eve, AMORE, MOOD, HLT)
TPC Calibration Viewer GUI Ali. TPCCalib. Viewer. GUI provides a graphical interface for visualization of calibration information. It utilises the Ali. TPCCalib. Viewer class for generating the diagrams.