Proteomics Informatics Data Analysis and Visualization Week 13


- Slides: 41
Proteomics Informatics – Data Analysis and Visualization (Week 13)
Statistics http: //blogs. nature. com/methagora/2013/08/giving_statistics_the_attention_it_deserves. html
Data Visualization http: //blogs. nature. com/methagora/2013/07/data -visualization-points-of-view. html
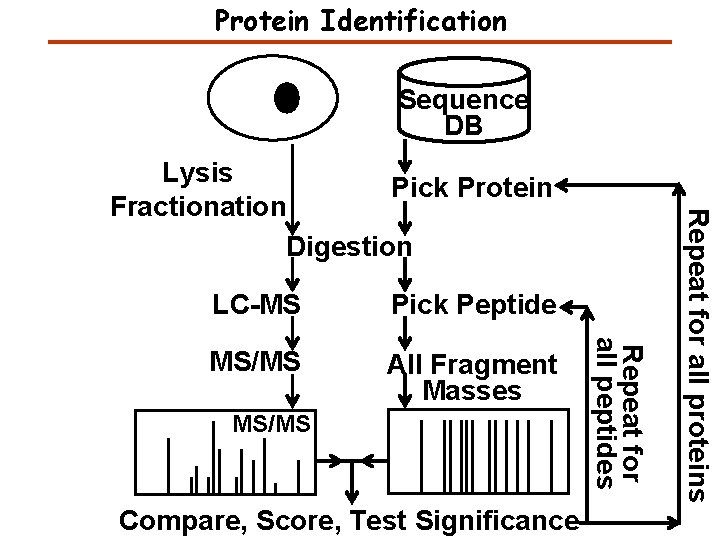
Protein Identification Sequence DB Pick Peptide MS/MS All Fragment Masses MS/MS Compare, Score, Test Significance Repeat for all peptides LC-MS Repeat for all proteins Lysis Pick Protein Fractionation Digestion
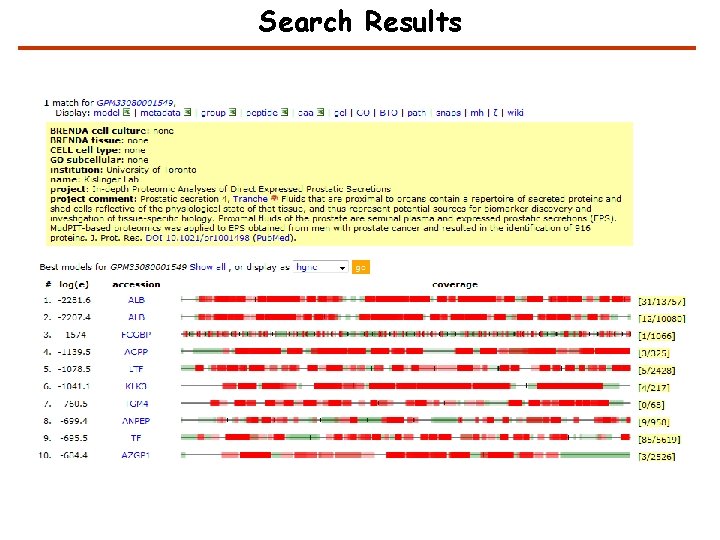
Search Results
Significance Testing False protein identification is caused by random matching An objective criterion for testing the significance of protein identification results is necessary. The significance of protein identifications can be tested once the distribution of scores for false results is known.
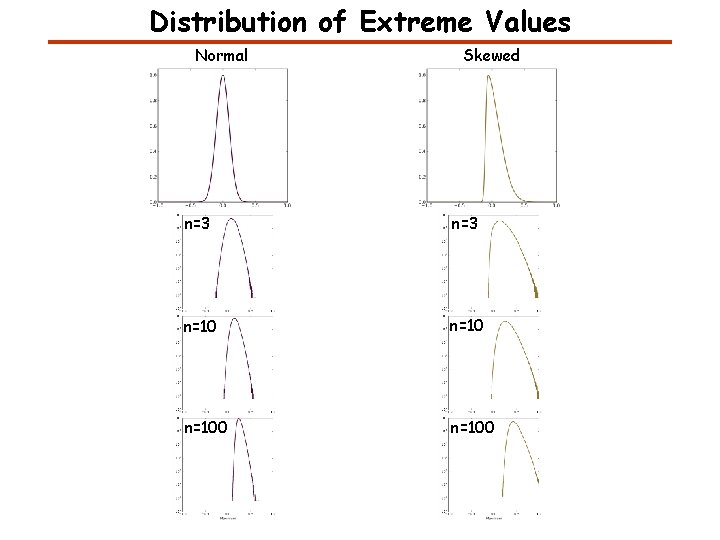
Distribution of Extreme Values Normal Skewed n=3 n=100
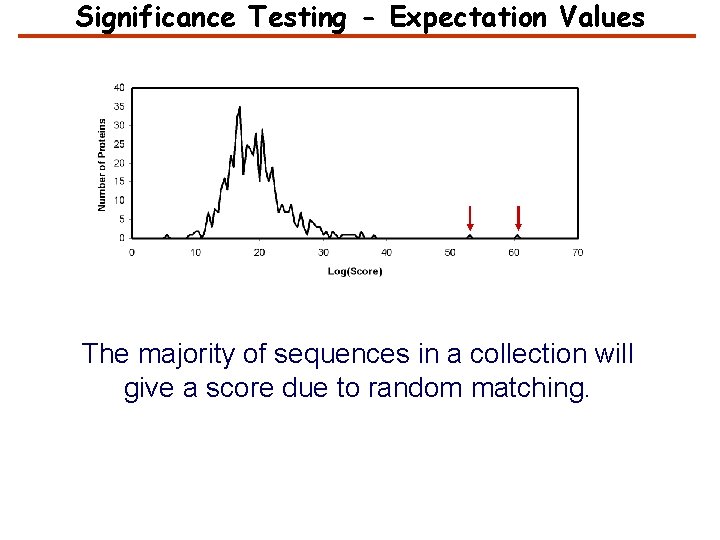
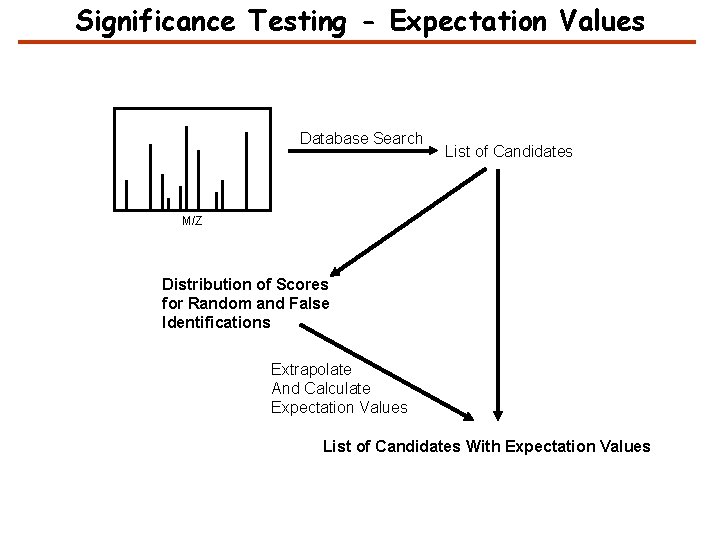
Significance Testing - Expectation Values The majority of sequences in a collection will give a score due to random matching.
Significance Testing - Expectation Values Database Search List of Candidates M/Z Distribution of Scores for Random and False Identifications Extrapolate And Calculate Expectation Values List of Candidates With Expectation Values
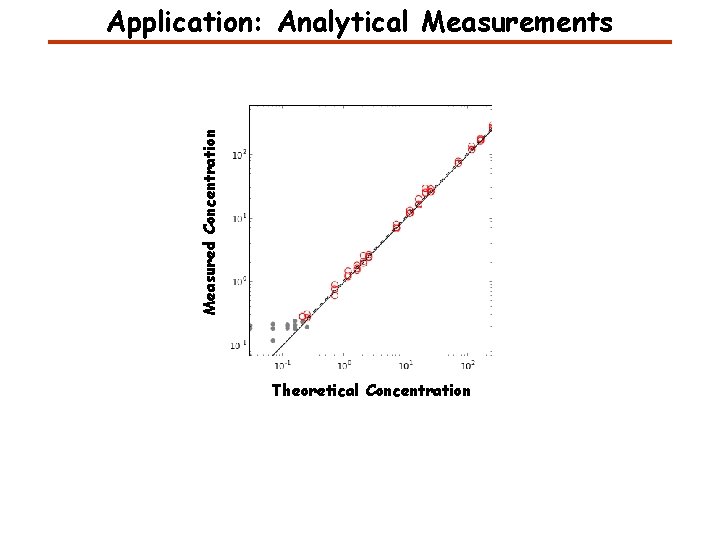
Measured Concentration Application: Analytical Measurements Theoretical Concentration
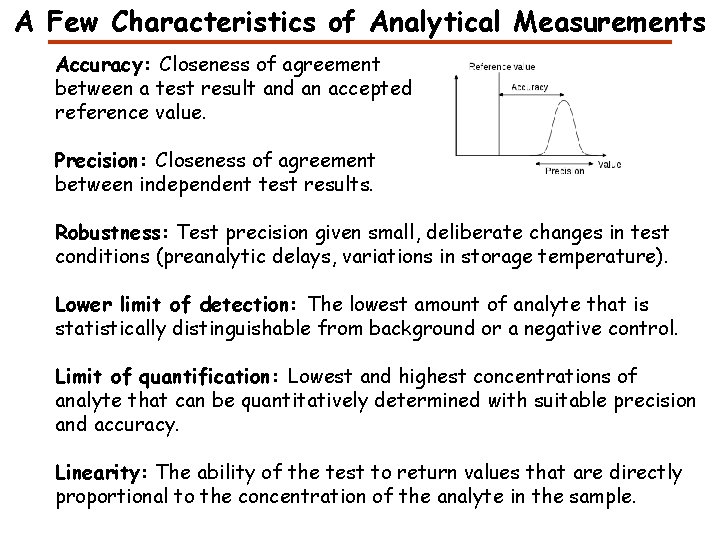
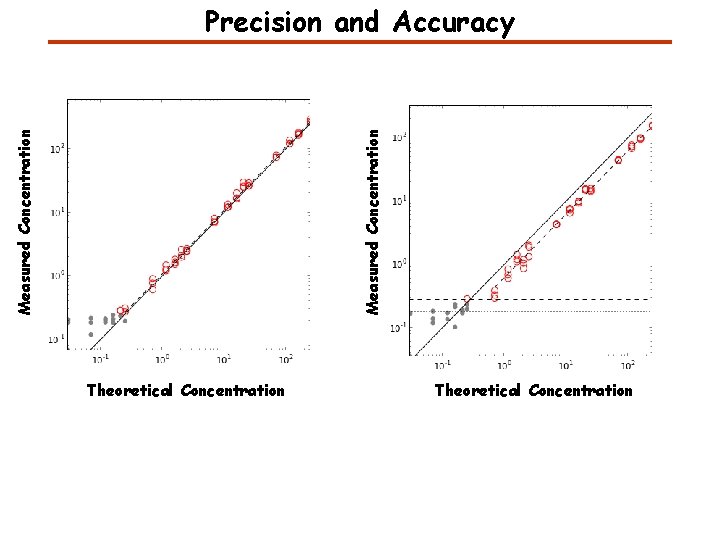
A Few Characteristics of Analytical Measurements Accuracy: Closeness of agreement between a test result and an accepted reference value. Precision: Closeness of agreement between independent test results. Robustness: Test precision given small, deliberate changes in test conditions (preanalytic delays, variations in storage temperature). Lower limit of detection: The lowest amount of analyte that is statistically distinguishable from background or a negative control. Limit of quantification: Lowest and highest concentrations of analyte that can be quantitatively determined with suitable precision and accuracy. Linearity: The ability of the test to return values that are directly proportional to the concentration of the analyte in the sample.
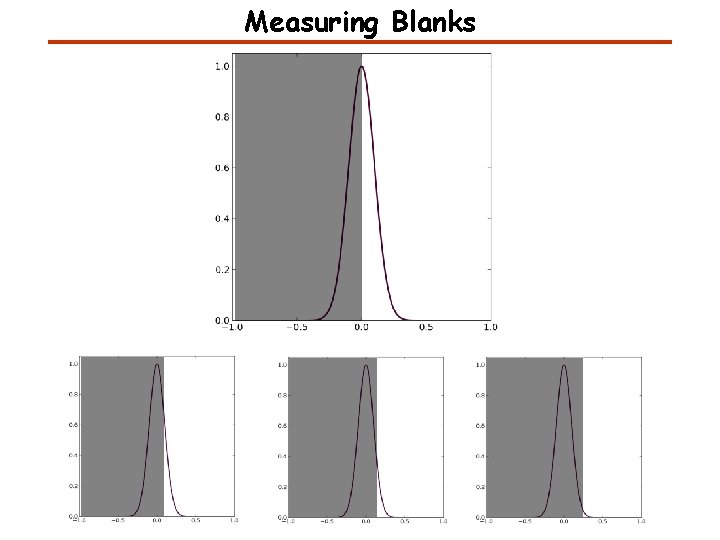
Measuring Blanks
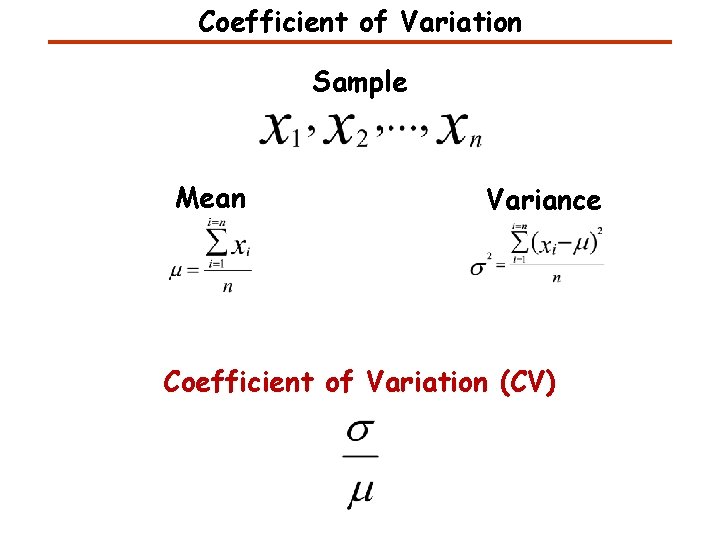
Coefficient of Variation Sample Mean Variance Coefficient of Variation (CV)
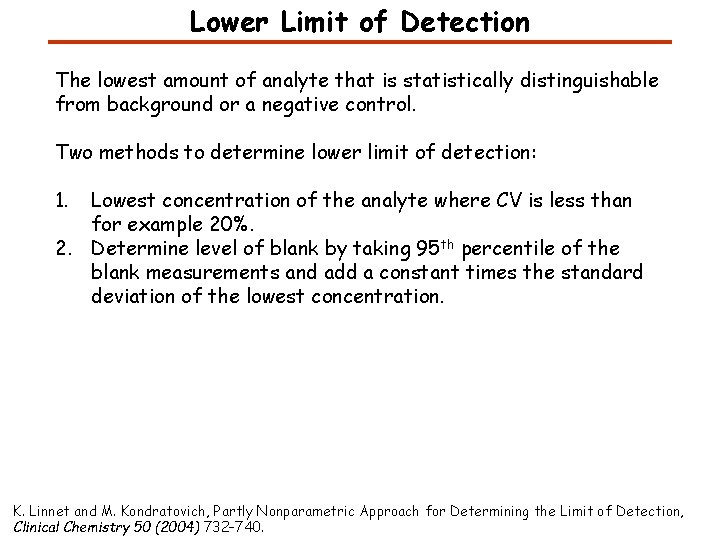
Lower Limit of Detection The lowest amount of analyte that is statistically distinguishable from background or a negative control. Two methods to determine lower limit of detection: 1. Lowest concentration of the analyte where CV is less than for example 20%. 2. Determine level of blank by taking 95 th percentile of the blank measurements and add a constant times the standard deviation of the lowest concentration. K. Linnet and M. Kondratovich, Partly Nonparametric Approach for Determining the Limit of Detection, Clinical Chemistry 50 (2004) 732– 740.
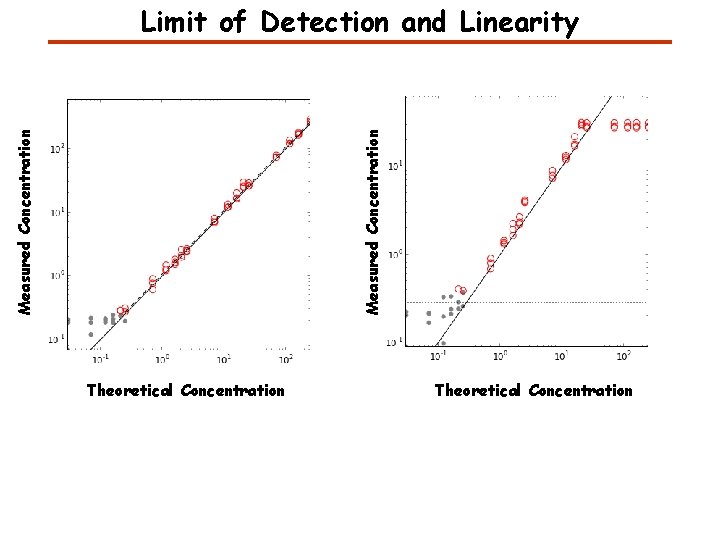
Measured Concentration Limit of Detection and Linearity Theoretical Concentration
Measured Concentration Precision and Accuracy Theoretical Concentration
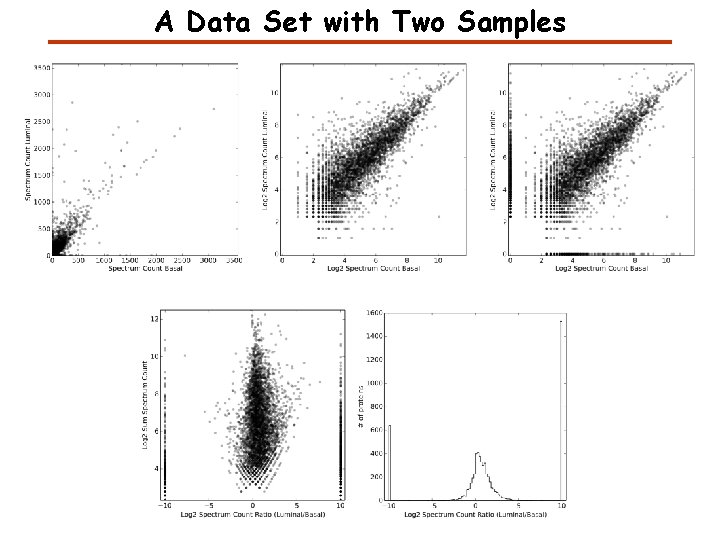
A Data Set with Two Samples
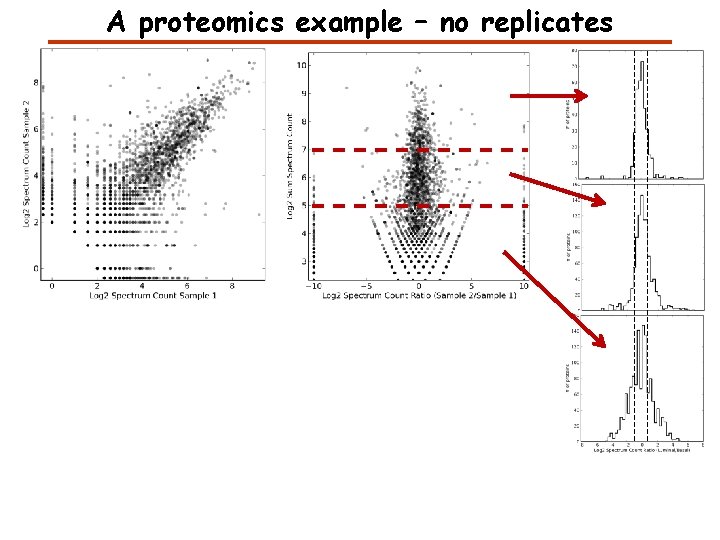
A proteomics example – no replicates
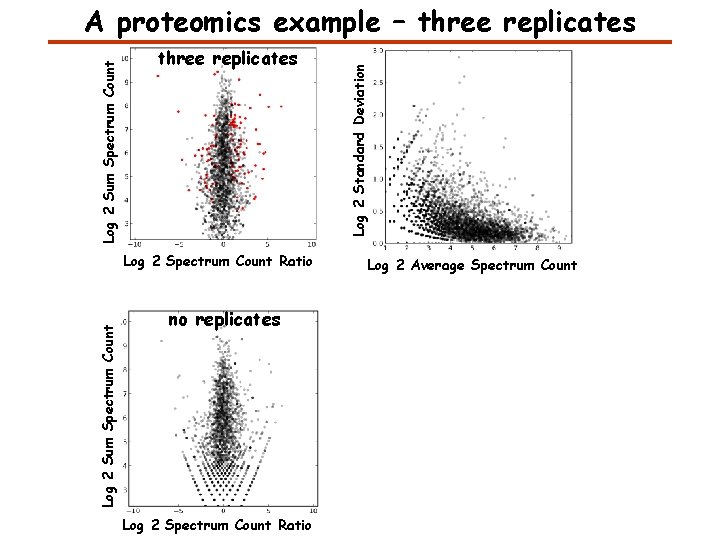
three replicates Log 2 Sum Spectrum Count Log 2 Spectrum Count Ratio no replicates Log 2 Spectrum Count Ratio Log 2 Standard Deviation Log 2 Sum Spectrum Count A proteomics example – three replicates Log 2 Average Spectrum Count
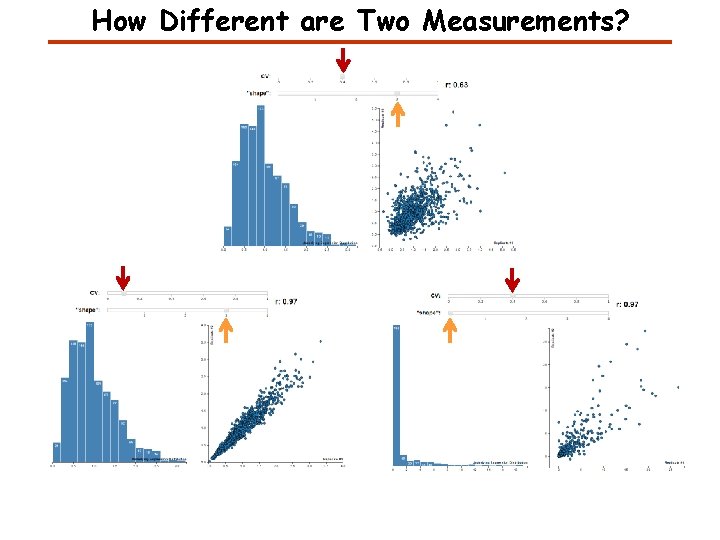
How Different are Two Measurements?
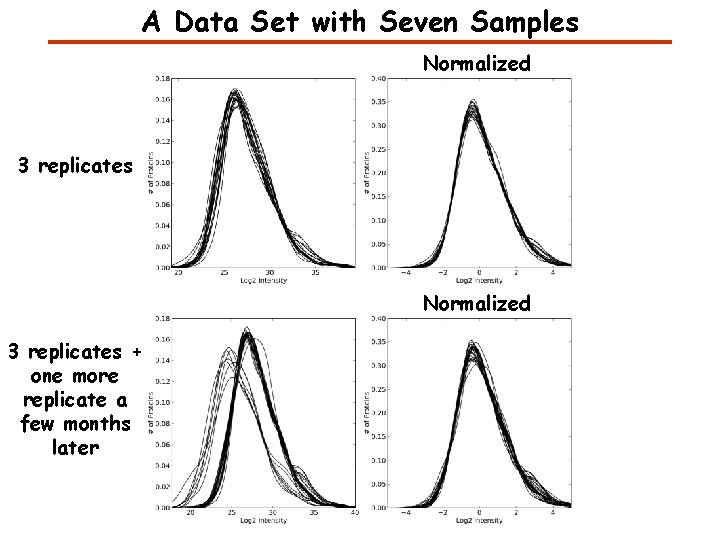
A Data Set with Seven Samples Normalized 3 replicates + one more replicate a few months later
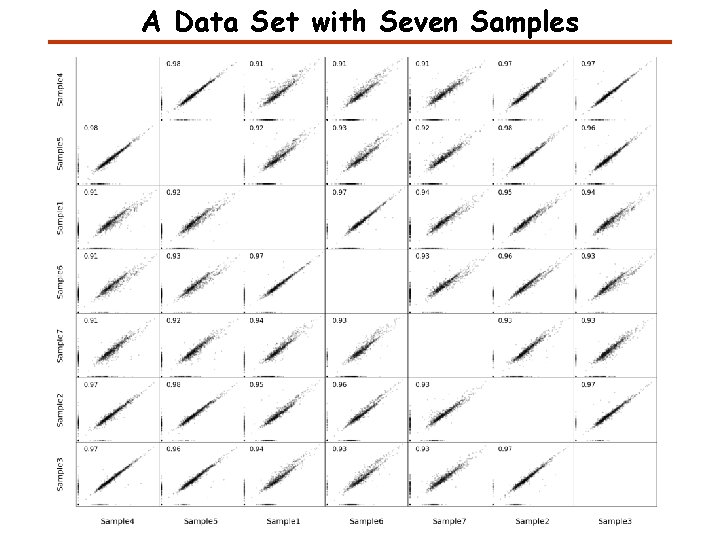
A Data Set with Seven Samples
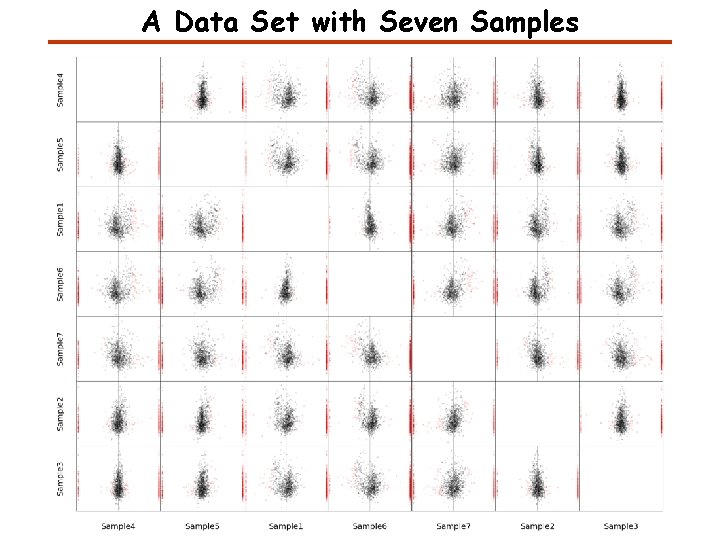
A Data Set with Seven Samples
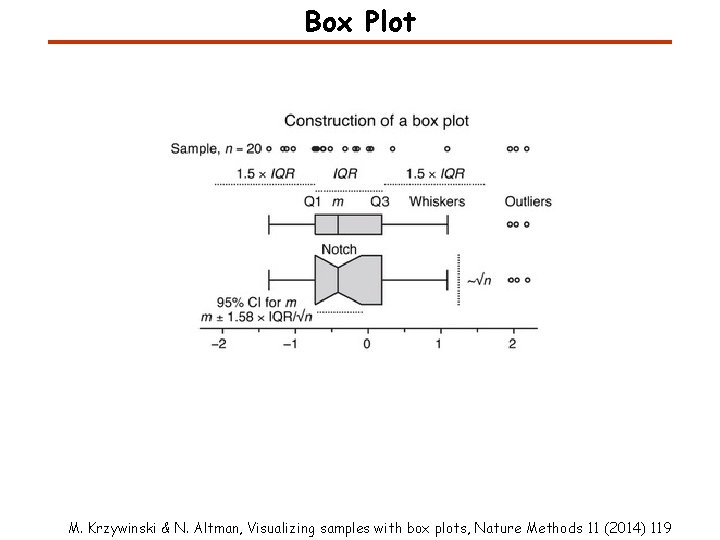
Box Plot M. Krzywinski & N. Altman, Visualizing samples with box plots, Nature Methods 11 (2014) 119
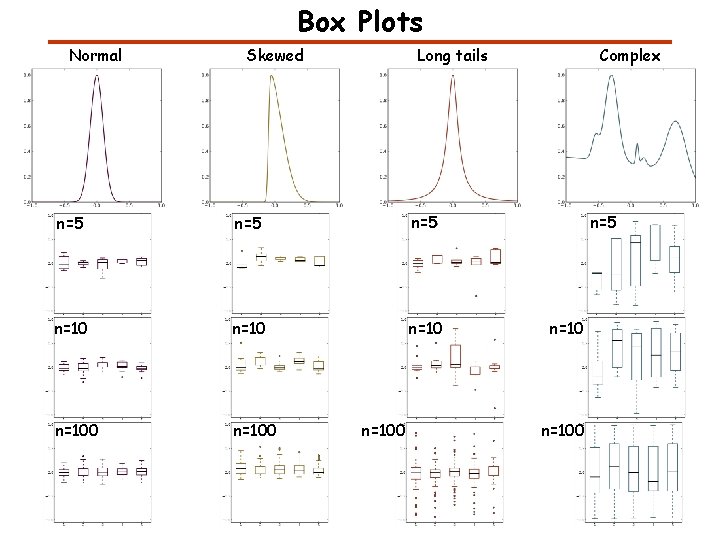
Box Plots Normal Skewed Long tails n=5 n=5 n=100 n=100 Complex n=5 n=100
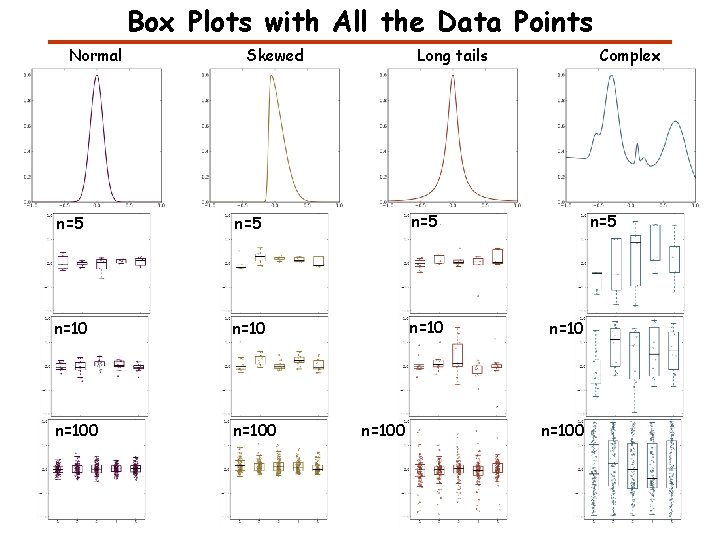
Box Plots with All the Data Points Normal Skewed Long tails n=5 n=5 n=100 n=100 Complex n=5 n=100
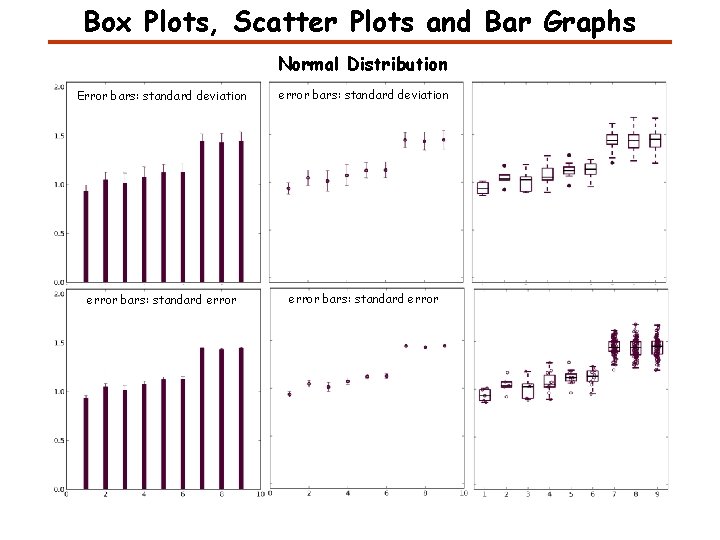
Box Plots, Scatter Plots and Bar Graphs Normal Distribution Error bars: standard deviation error bars: standard error
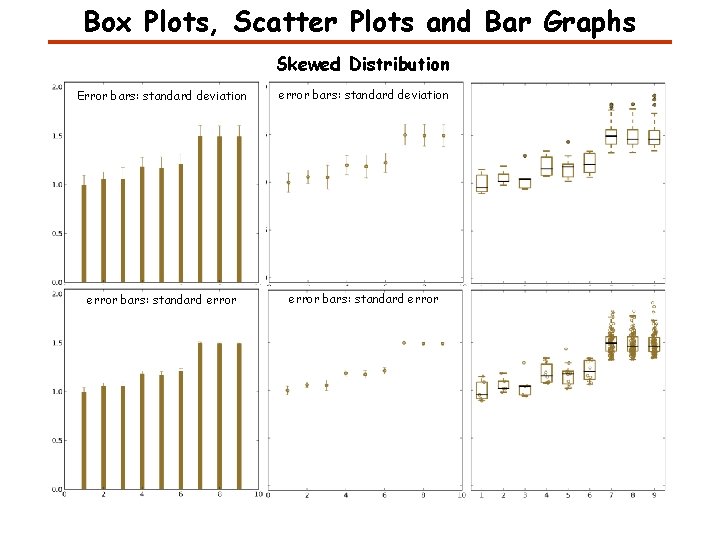
Box Plots, Scatter Plots and Bar Graphs Skewed Distribution Error bars: standard deviation error bars: standard error
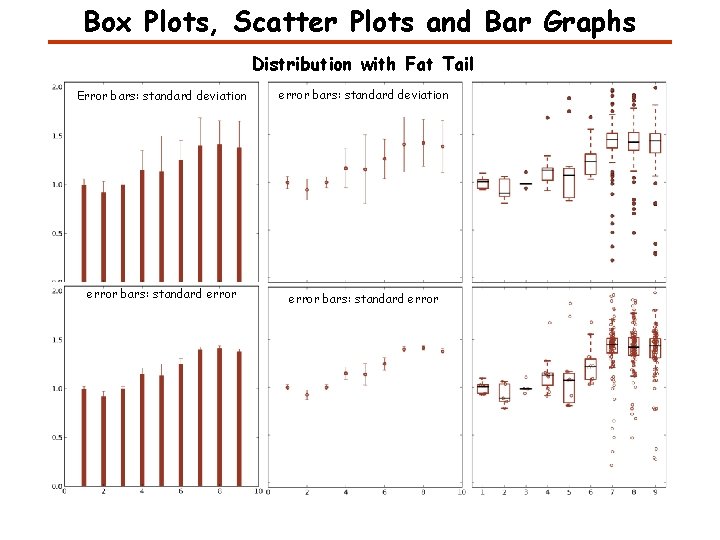
Box Plots, Scatter Plots and Bar Graphs Distribution with Fat Tail Error bars: standard deviation error bars: standard error
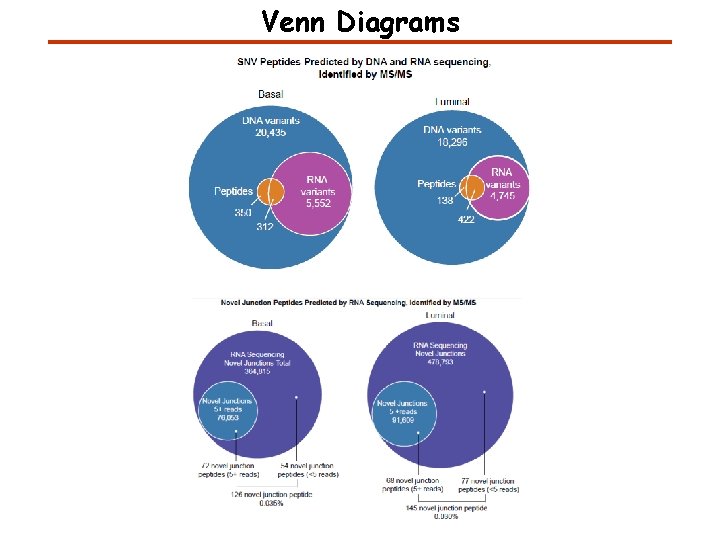
Venn Diagrams
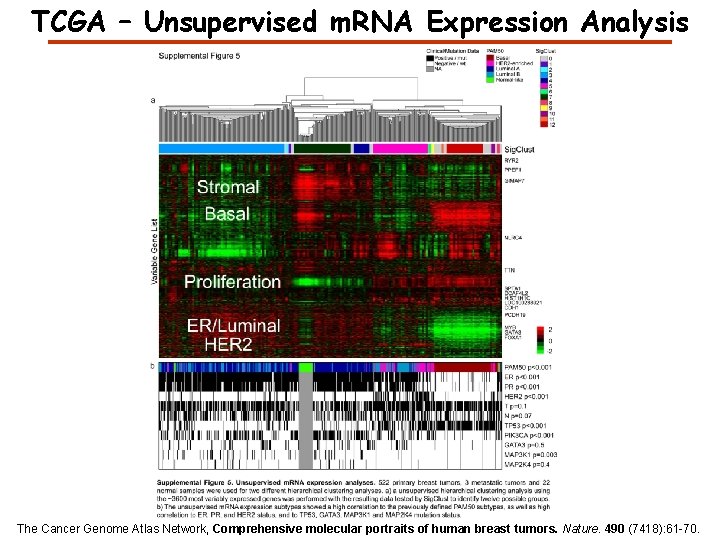
TCGA – Unsupervised m. RNA Expression Analysis The Cancer Genome Atlas Network, Comprehensive molecular portraits of human breast tumors. Nature. 490 (7418): 61 -70.
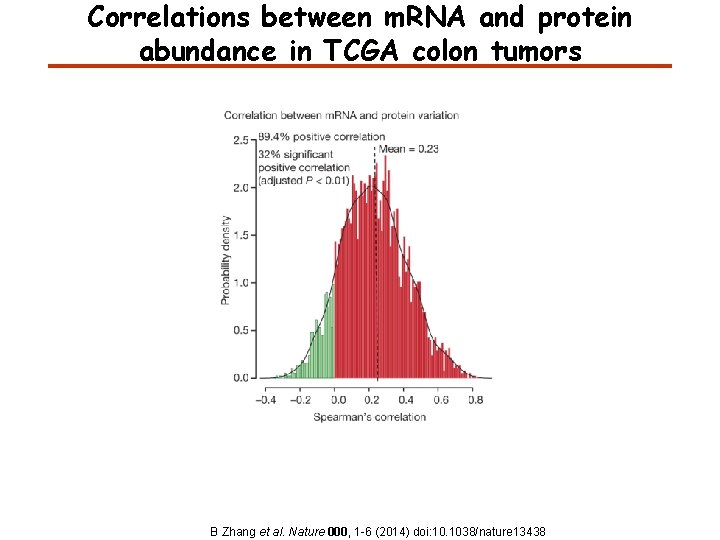
Correlations between m. RNA and protein abundance in TCGA colon tumors B Zhang et al. Nature 000, 1 -6 (2014) doi: 10. 1038/nature 13438
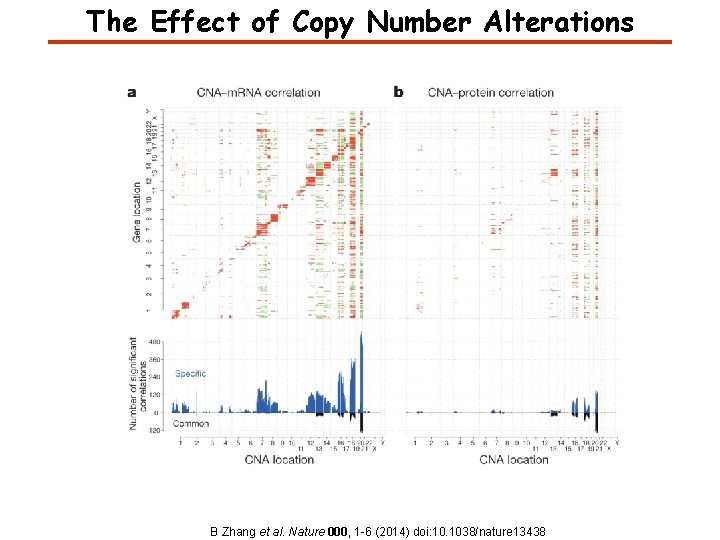
The Effect of Copy Number Alterations B Zhang et al. Nature 000, 1 -6 (2014) doi: 10. 1038/nature 13438
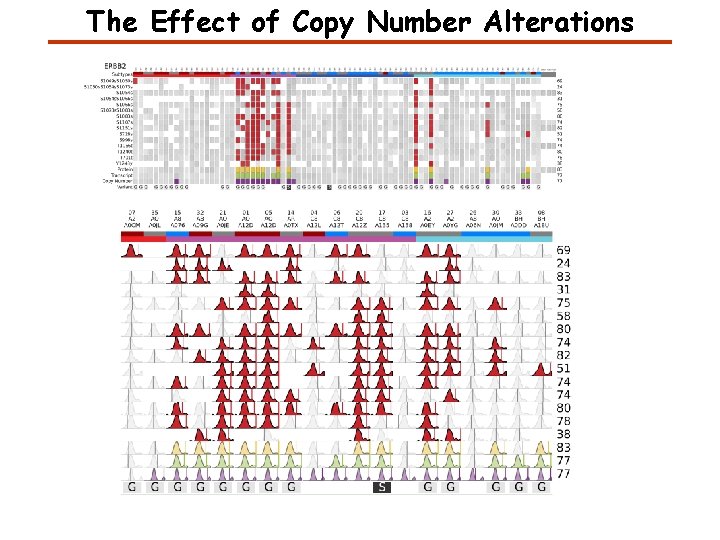
The Effect of Copy Number Alterations
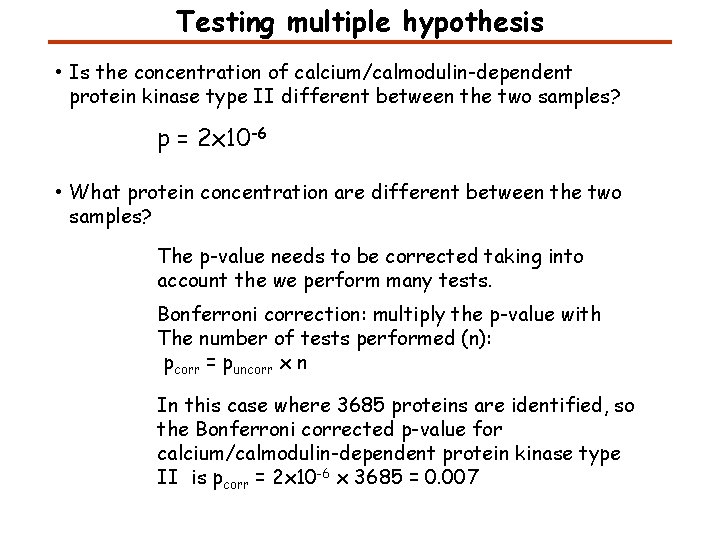
Testing multiple hypothesis • Is the concentration of calcium/calmodulin-dependent protein kinase type II different between the two samples? p = 2 x 10 -6 • What protein concentration are different between the two samples? The p-value needs to be corrected taking into account the we perform many tests. Bonferroni correction: multiply the p-value with The number of tests performed (n): pcorr = puncorr x n In this case where 3685 proteins are identified, so the Bonferroni corrected p-value for calcium/calmodulin-dependent protein kinase type II is pcorr = 2 x 10 -6 x 3685 = 0. 007
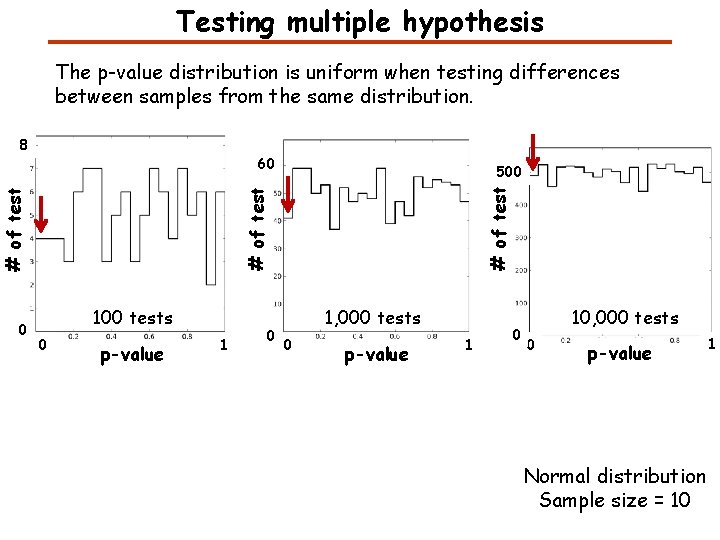
Testing multiple hypothesis The p-value distribution is uniform when testing differences between samples from the same distribution. 8 60 # of test 0 500 100 tests 0 p-value 1 0 1, 000 tests 0 p-value 1 0 10, 000 tests 0 p-value Normal distribution Sample size = 10 1
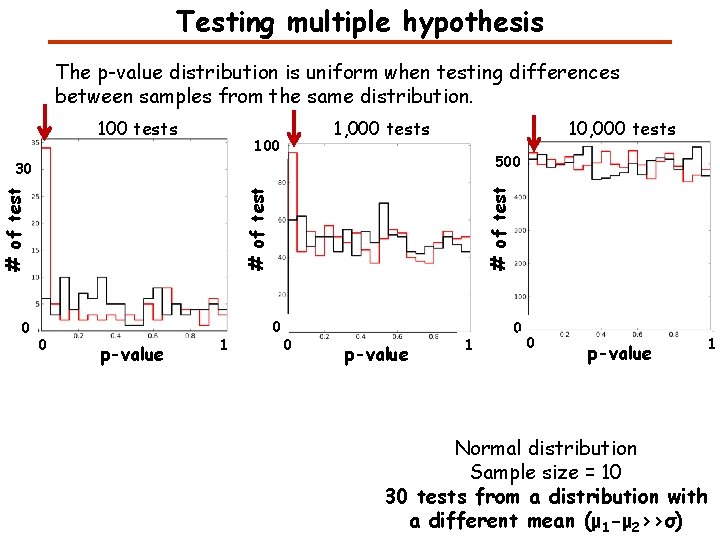
Testing multiple hypothesis The p-value distribution is uniform when testing differences between samples from the same distribution. 100 tests 1, 000 tests 100 10, 000 tests 500 # of test 30 0 p-value 1 Normal distribution Sample size = 10 30 tests from a distribution with a different mean (μ 1 -μ 2>>σ)
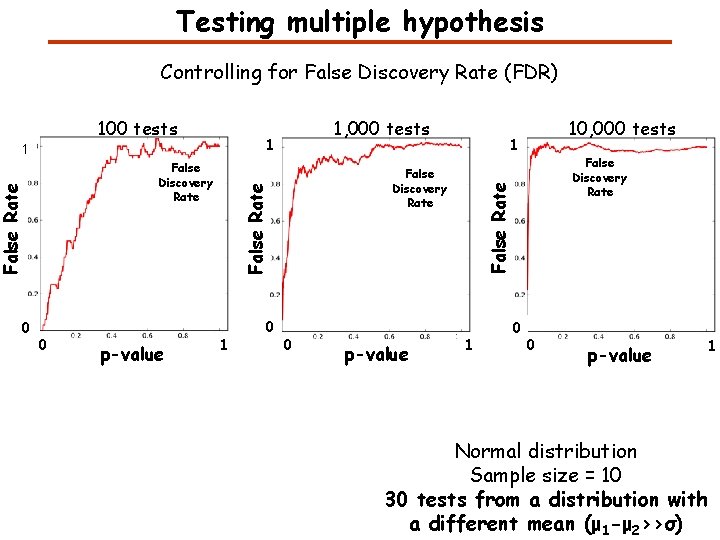
Testing multiple hypothesis Controlling for False Discovery Rate (FDR) 1 1 0 p-value 1 0 0 p-value 10, 000 tests 1 False Discovery Rate False Rate 0 1, 000 tests False Discovery Rate False Rate 100 tests 1 0 0 p-value 1 Normal distribution Sample size = 10 30 tests from a distribution with a different mean (μ 1 -μ 2>>σ)
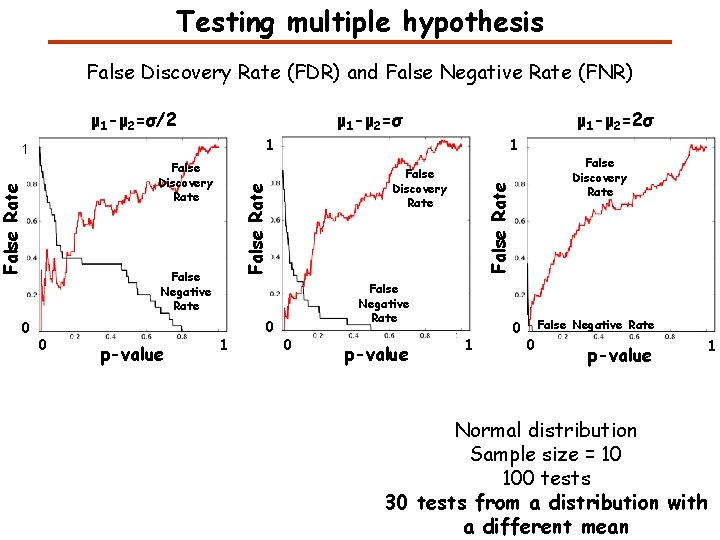
Testing multiple hypothesis False Discovery Rate (FDR) and False Negative Rate (FNR) μ 1 -μ 2=σ/2 μ 1 -μ 2=σ 1 False Negative Rate 0 p-value False Discovery Rate False Discovery Rate 1 1 0 False Negative Rate 0 p-value False Discovery Rate False Rate 1 0 μ 1 -μ 2=2σ 1 0 False Negative Rate 0 p-value 1 Normal distribution Sample size = 10 100 tests 30 tests from a distribution with a different mean
Proteomics Informatics – Data Analysis and Visualization (Week 13)