
Data Visualization Meetup November 2020 http tfdlvis ucalgaryblogs
Data Visualization Meetup November 2020 http: //tfdlvis. ucalgaryblogs. ca/
Agenda Welcome & Introductions Visualization Sketching / Prototyping Activity Bring a Visualization ◦ Show off a visualization that you found of interest Tableau Tutorial Date & timing of the next meeting ◦ Topics http: //tfdlvis. ucalgaryblogs. ca/
Meetup Mailing list https: //mailman. ucalgary. ca/mailman/listinfo/datavisualizationmeetup-l Survey https: //forms. gle/wx 9 Fs. PYt. Tt 1 h 4 Gn. C 7 Results ◦ 5 responses ◦ Topics of Interest: vis talks & projects, training, software, sketching, introduce a tool/ dataset, explore/discuss a visualization, data wrangling ◦ Timing: Evenings on Fridays or Wednesdays http: //tfdlvis. ucalgaryblogs. ca/
Visualization Sketching
Fast & easy ◦ Encourages exploration ◦ Easier to discard Sketching Not bound by software / data limitations Learn about your data / find problems Explore the “design space” rather than software capabilities

Are you good at drawing?
Visual Encoding TRANSFORM DATA INTO GEOMETRY
Images perceived as a set of signs Sender encodes information in signs Receiver decodes information from signs Jacques Bertin, Sémiologie graphique (the semiology of graphics) 1967
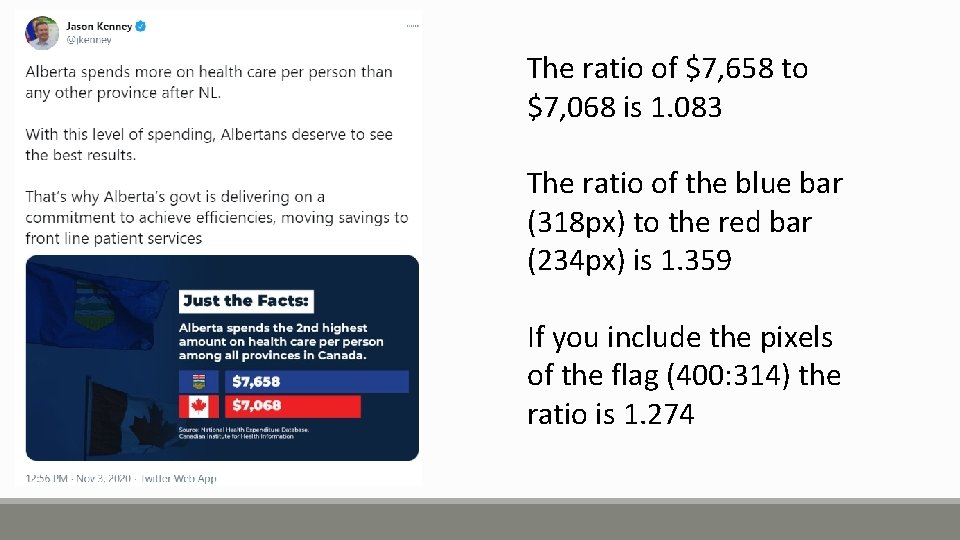
The ratio of $7, 658 to $7, 068 is 1. 083 The ratio of the blue bar (318 px) to the red bar (234 px) is 1. 359 If you include the pixels of the flag (400: 314) the ratio is 1. 274
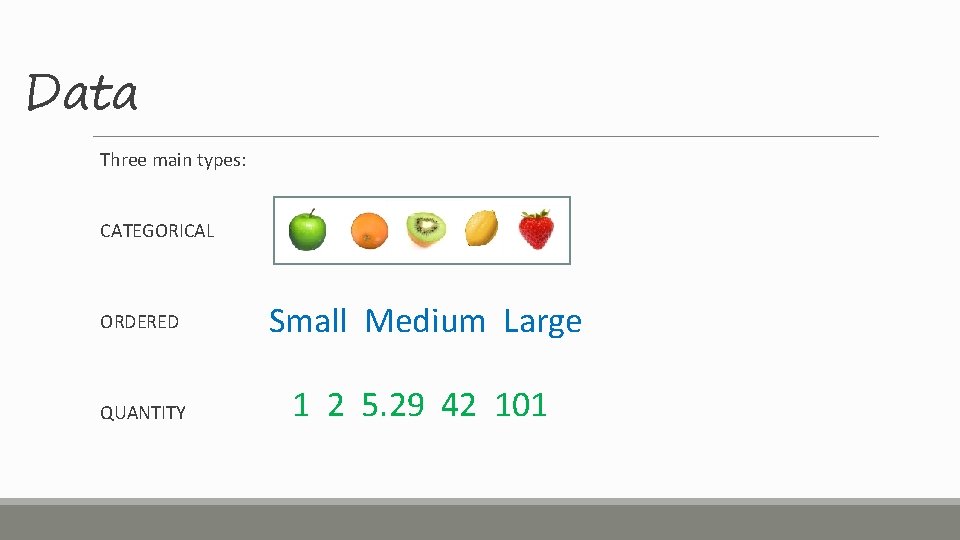
Data Three main types: CATEGORICAL ORDERED Small Medium Large QUANTITY 1 2 5. 29 42 101
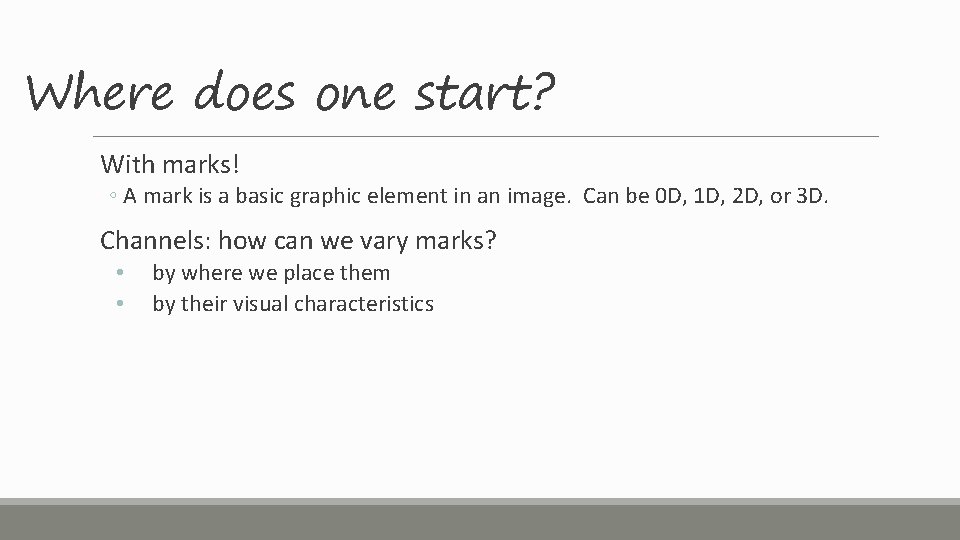
Where does one start? With marks! ◦ A mark is a basic graphic element in an image. Can be 0 D, 1 D, 2 D, or 3 D. Channels: how can we vary marks? • • by where we place them by their visual characteristics
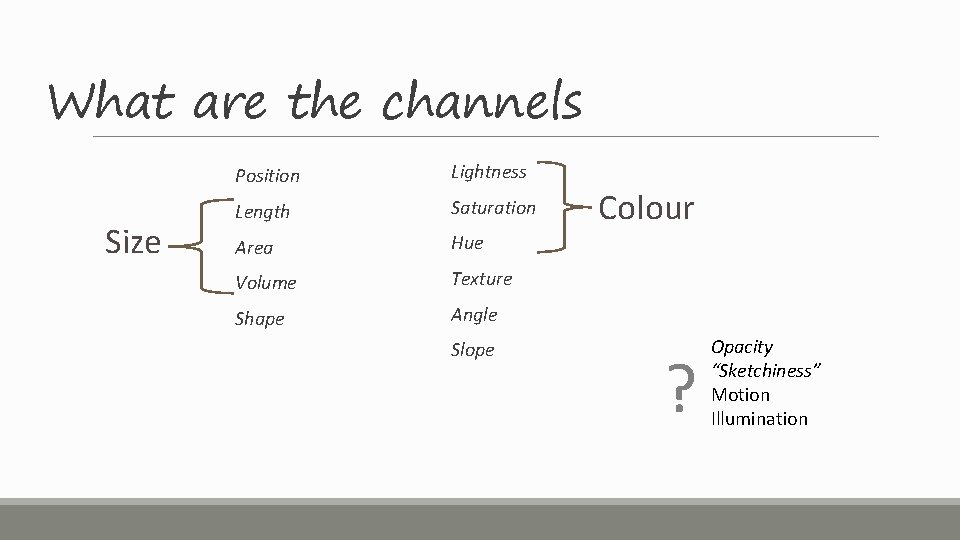
What are the channels Size Position Lightness Length Saturation Area Hue Volume Texture Shape Angle Slope Colour ? Opacity “Sketchiness” Motion Illumination
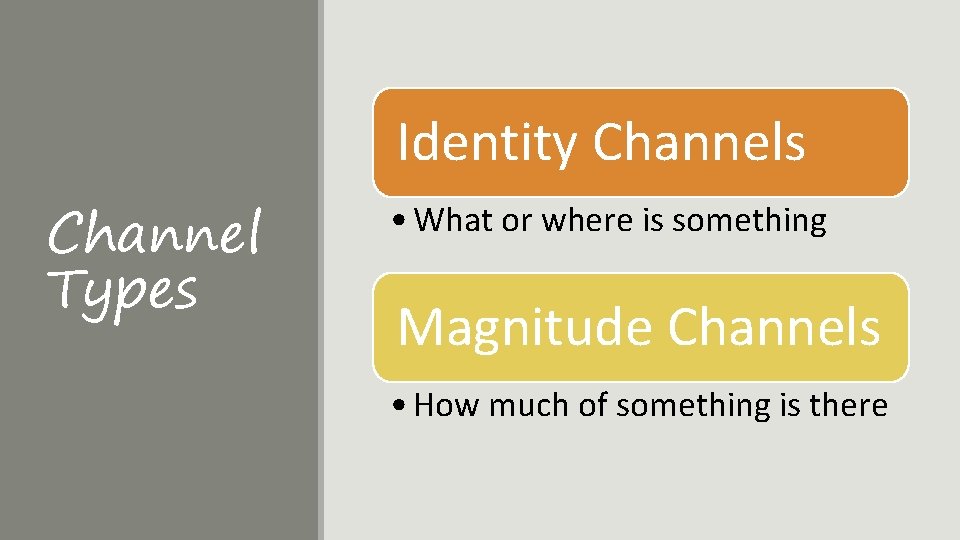
Identity Channels Channel Types • What or where is something Magnitude Channels • How much of something is there
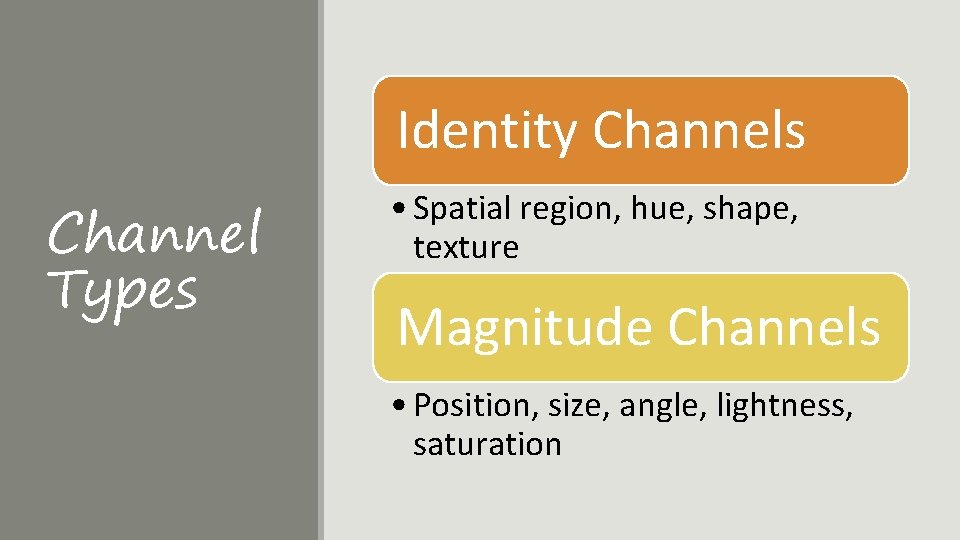
Identity Channels Channel Types • Spatial region, hue, shape, texture Magnitude Channels • Position, size, angle, lightness, saturation
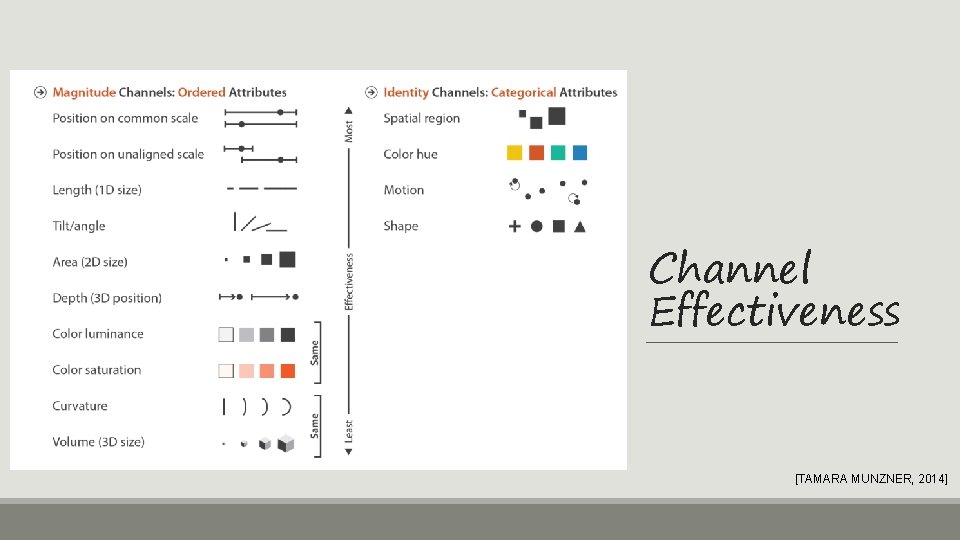
Channel Effectiveness [TAMARA MUNZNER, 2014]
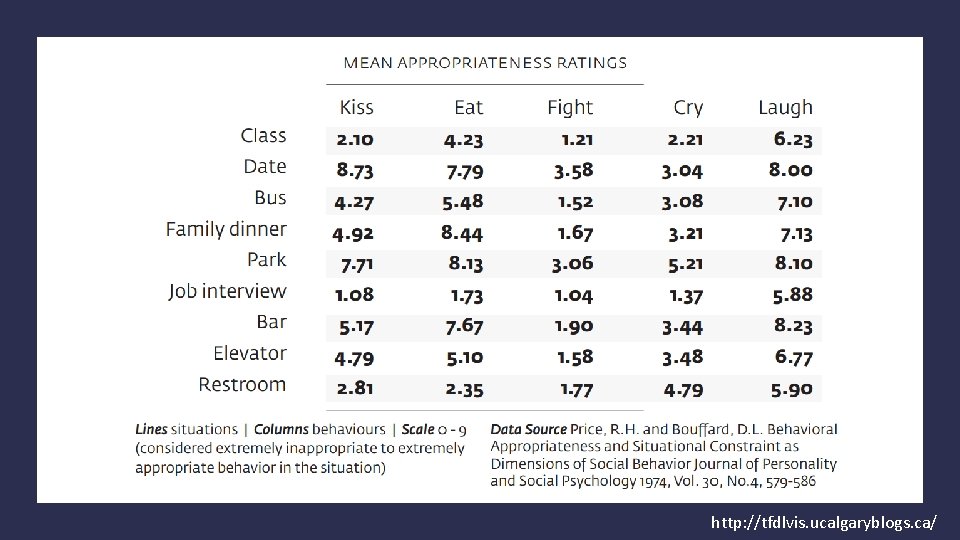
Sketching Exercise Create a visualization Anything you want ◦ What interests you in the data? ◦ What questions do you have? Do more than one Challenge: Try to encode as many properties as possible in your visualization.
http: //tfdlvis. ucalgaryblogs. ca/
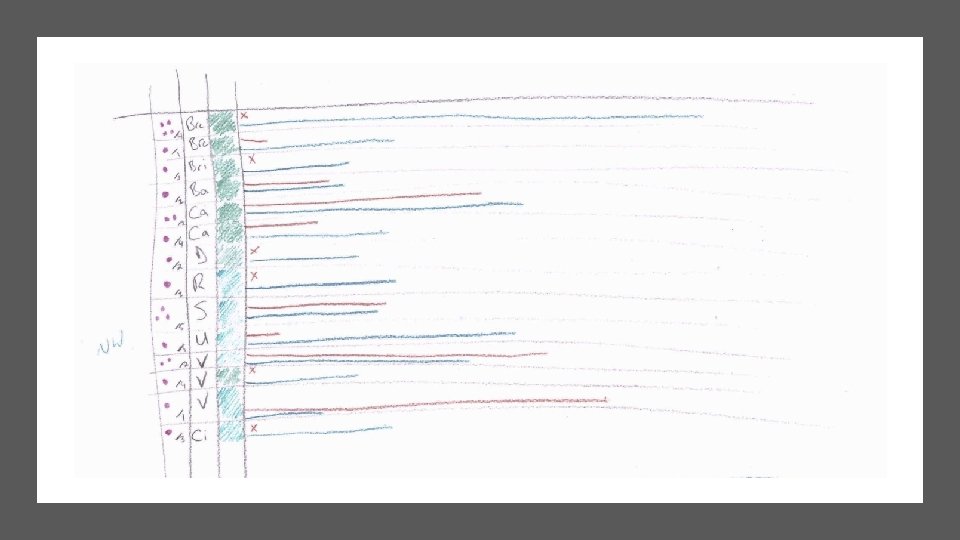
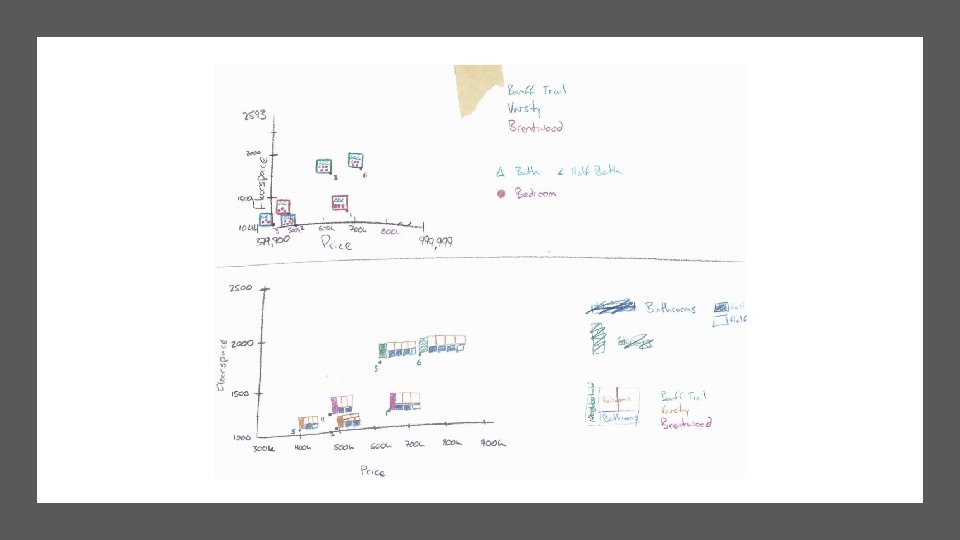
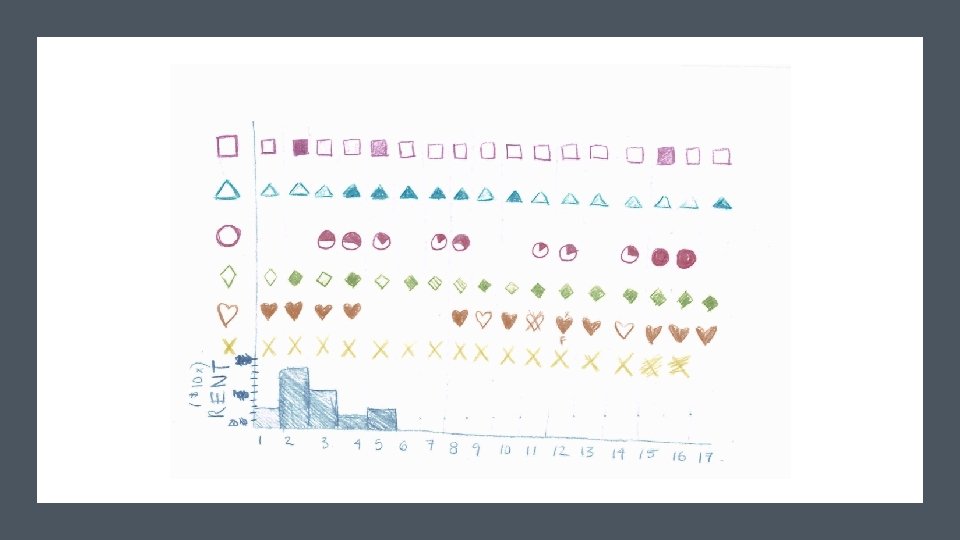
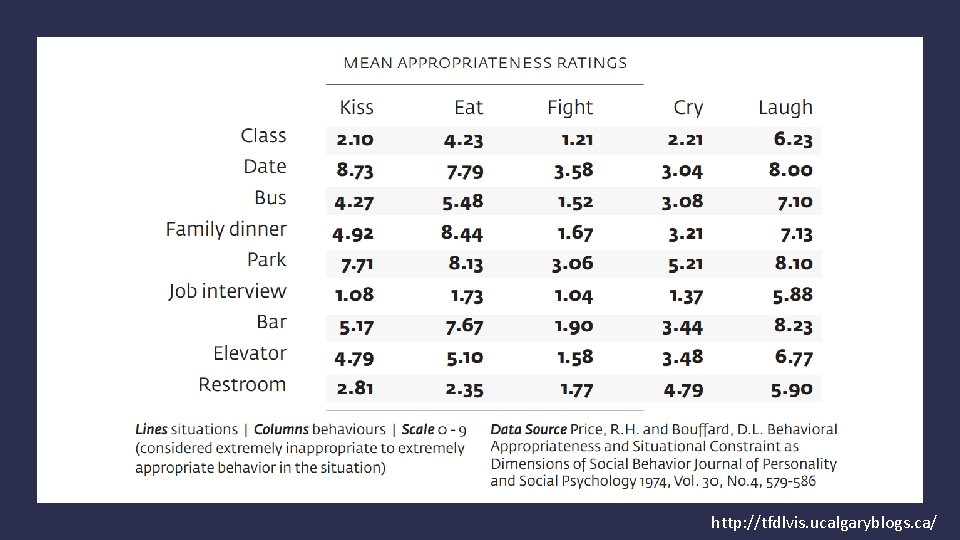
http: //tfdlvis. ucalgaryblogs. ca/
Visualization Showcase Show-off a recent visualization that you have encountered Can be something good or something bad Share screen and/or post image/link in chat
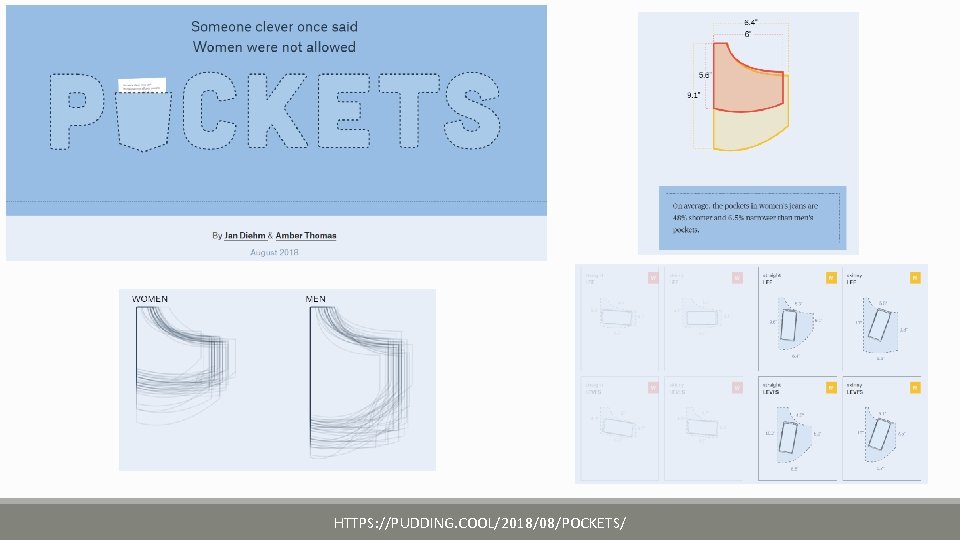
HTTPS: //PUDDING. COOL/2018/08/POCKETS/

Tableau Tutorial
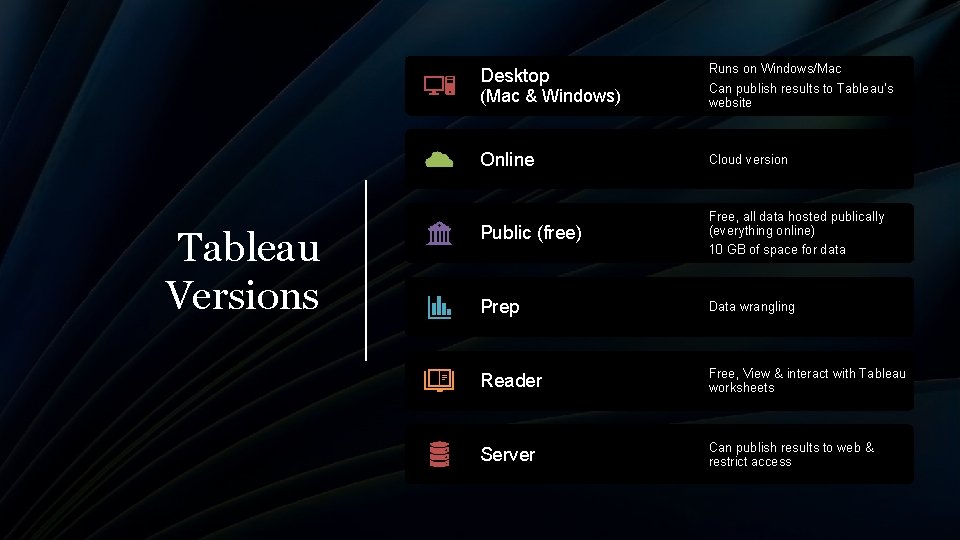
Tableau Versions Desktop (Mac & Windows) Runs on Windows/Mac Can publish results to Tableau’s website Online Cloud version Public (free) Free, all data hosted publically (everything online) Prep Data wrangling Reader Free, View & interact with Tableau worksheets Server Can publish results to web & restrict access 10 GB of space for data

Academic/Student Program • Available for free to post-secondary students. • http: //www. tableau. com/academic/
File (excel, csv) Tableau & Database (Access, Oracle, My. SQL) Online Sources (Google Analytics, Get data files ◦ calgweather. csv Amazon Redshift)
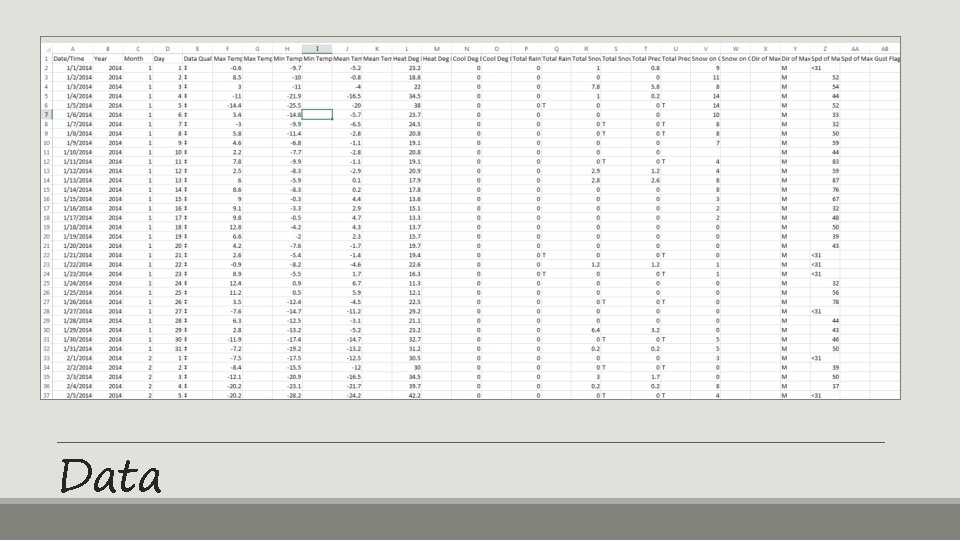
Data
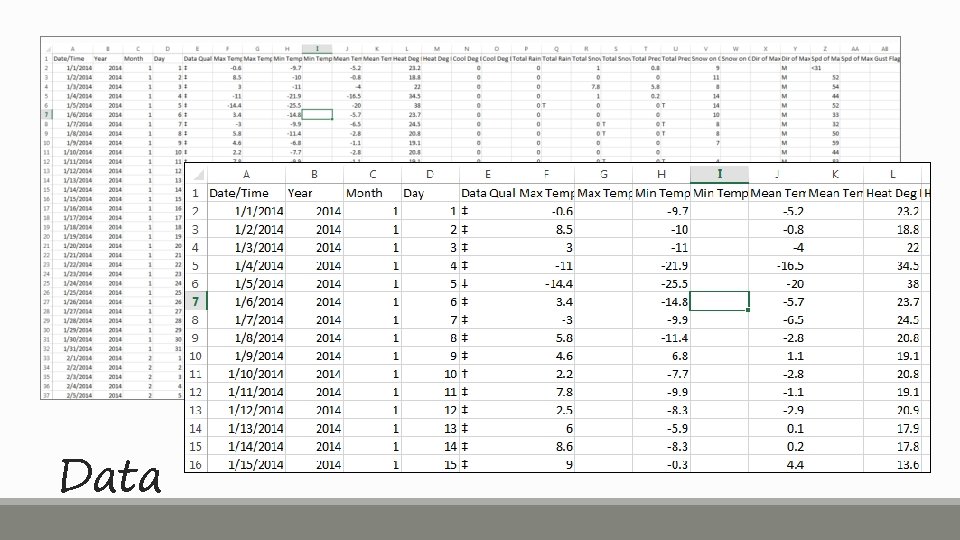
Data
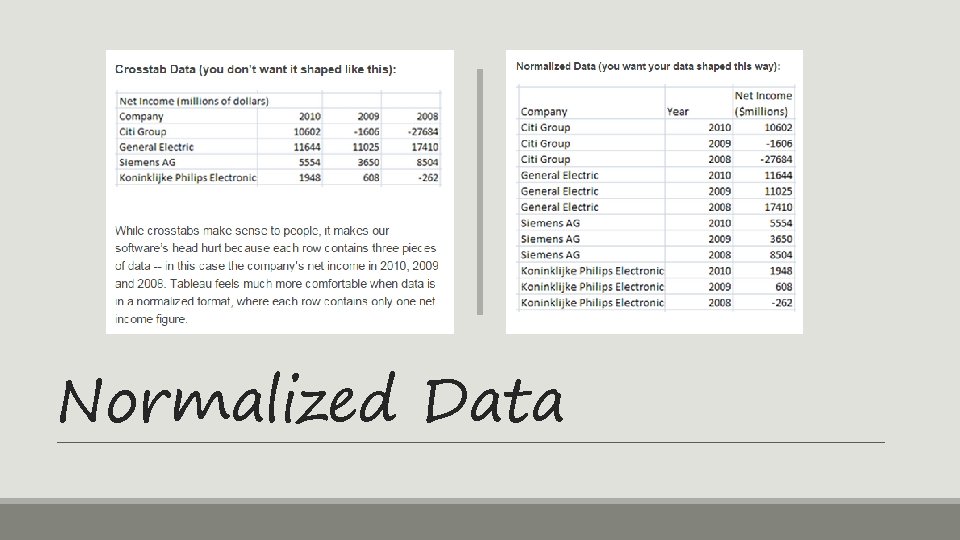
Normalized Data
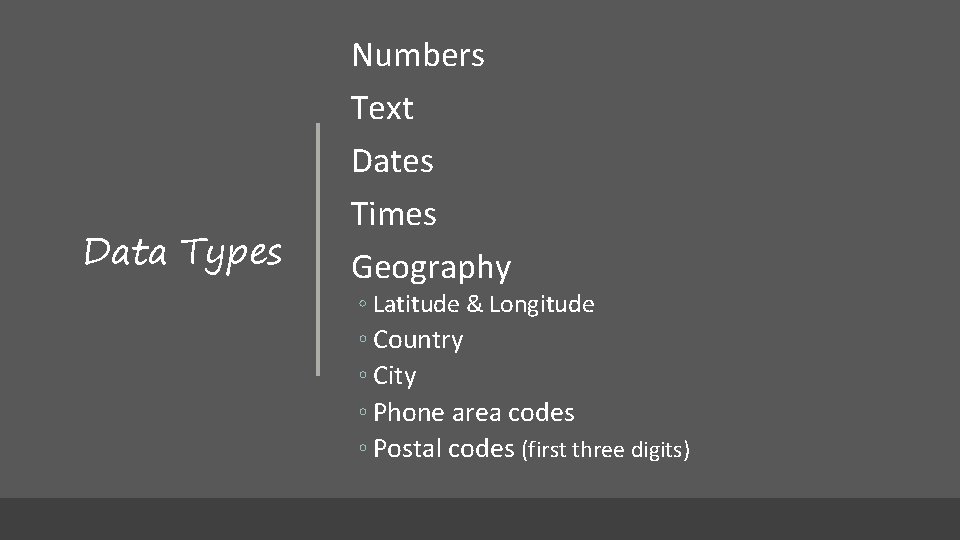
Data Types Numbers Text Dates Times Geography ◦ Latitude & Longitude ◦ Country ◦ City ◦ Phone area codes ◦ Postal codes (first three digits)
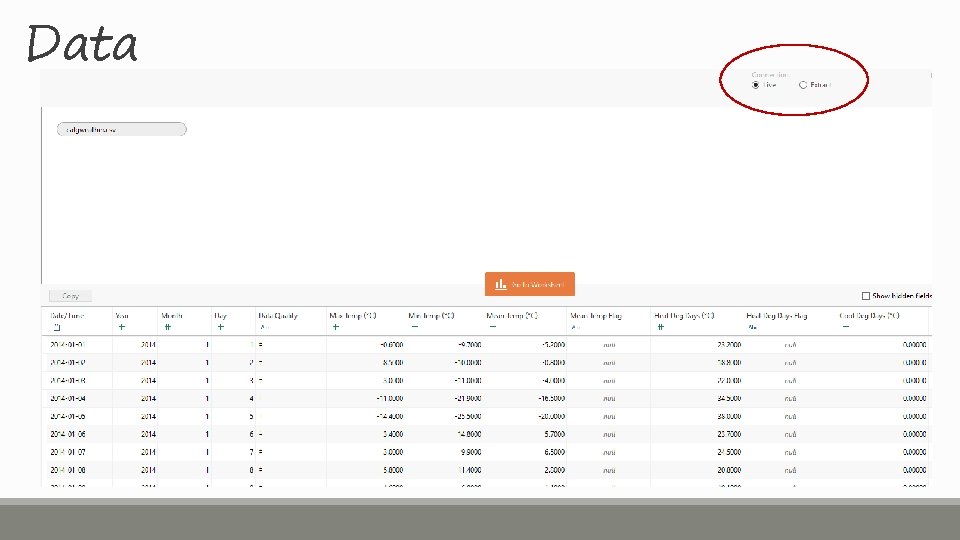
Data
Output • PDF / Powerpoint / Image • Tableau workbook (can be read in Tableau Reader) • Create an interactive webpage – Public – Server license
• Training videos – http: //www. tableau. com/learn/training More Info • Tableau Visualization of the Day – http: //www. tableau. com/public/communi ty/viz-of-the-day
Next Time Visualization Showcase Data Wrangling - Open. Refine Would anyone like to present something? Next Date: Friday, December 4?

Thanks for coming mailman. ucalgary. ca/ mailman/listinfo/ datavisualizationmeetup-l Slides & data: tfdlvis. ucalgaryblogs. ca John Brosz, Ph. D Data Visualization Coordinator, jdlbrosz@ucalgary. ca
- Slides: 36