University of Nairobi School of Computing Informatics ICT

University of Nairobi School of Computing & Informatics ICT Sector Performance Review 2009/10 Prof. Timothy M. Waema Research ICT Africa Kenya Team Leader 16 November, 2010
 and ICT research")
Agenda 1. 2. 3. 4. 5. 6. Research ICT Africa (RIA) and ICT research Access and usage demand survey (2007) ICT sector performance review 2009/10 (supply-side) Regulatory environment perception survey Research challenges Challenges & policy recommendations

1. RIA Network is one of the research networks originally started with funds from IDRC Network has grown from 2004 and now consists of 18 African countries Purpose of RIA research is: and ICT research to create a rich evidence base of the ICT sector developments in selected African countries to enable comparison of policy outcomes in different countries against national strategies and sector performance influence ICT policy Kenya team consists of 1. Prof. Timothy M. Waema 2. Ms Margaret Nyambura 3. Dr. Catherine Adeya 4. Prof. Meoli Kashorda 5. Dr. Monica Kerrets. Makau

2. Access and usage demand survey

Methodology Use of NASSEP IV sampling frame KNBS Sample 1461 HHs HH selection Uniform sample of 24 HHs in each cluster 1 st HH randomly selected in each cluster Next HH systematically determined (last HH + interval) Provision for replacements for vacant, demolished or households whose occupants were not available after a maximum of three call-backs Respondents selection Major urban – 584 (40%) Other urban – 439 (30%) Rural - 438 (30%) Head of HH or next most senior member of HH Data collection using PDA & analysis by SPSS

Key findings

HHs with computer & Internet

E-mail presence

Reasons for not using Internet

Internet tariffs – 20 hrs/month

Monthly Internet expenditure

3. ICT sector performance review 2009/10

Methodology Review of documents, e. g. CCK publications Review of websites of operators, CCK, etc. Telephone interviews with selected persons

Key findings

Summary of telephony services Fixed telephone services Connections been declining since end of monopoly Slight growth in 2009 due revitalisation of Telkom Kenya following its privatization in 2007 Phenomenal growth of mobile services eaten into this market Fixed wireless telephone services Not been growing much Expected to grow with migration to the Unified Licensing Framework
 Growth can")
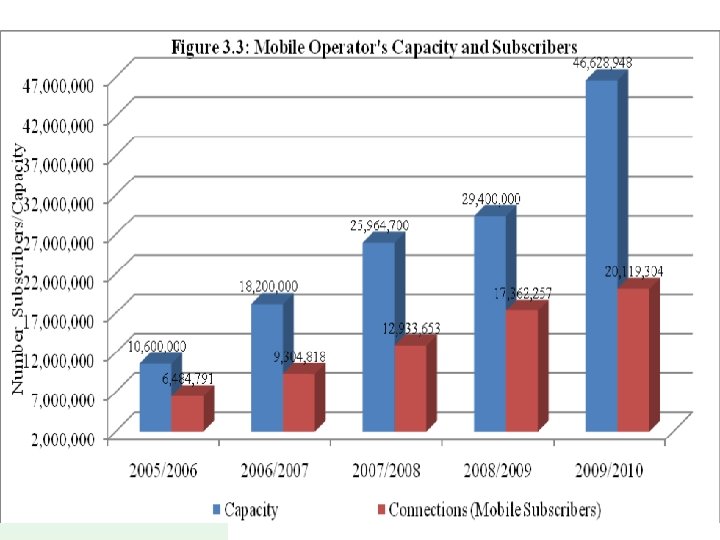
Mobile telephone services Phenomenal growth (51. 2% penetration by June 2010) Growth can be attributed to: the competitive effects resulting from the increased number of mobile operators increased mobile coverage aggressive marketing through increased offers and promotions, esp. availability of low denomination calling cards increased affordability of handsets Increased infrastructure sharing among the mobile phone operators Safaricom shares towers with Zain and Orange through reciprocal arrangements Essar Telecom Kenya (Yu) also shares Zain’s towers and base stations
 (2009/10)")
Interconnection rates fixed to mobile phones (USD) (2009/10)
")
Mobile termination rates in US cents (Sep 2010)

Internet users Have been growing slowly, with phenomenal growth 2009/2010 2. 90 m June 2008 3. 65 m June 2009 (9. 5% penetration) 7. 83 m June 2010 (20% penetration) Growth in 2009/2010 largely due to: entry of mobile operators aggressive rollout of data services by mobile operators, esp. Safaricom increased access to social networking sites through mobile phones that has become popular among the youth in the country Internet penetration figures of other countries: 33. 4% Mo 10. 8% SA 4. 1% Rw 28. 9% Nig 9. 6% Ug 1. 6% Tz 20% Ke 5. 3% Gh 0. 5% Et
 Guaranteed bandwidth (Kbps) 256 CCK Avg Sep 2009 38,")
Commercial broadbandwidth cost (Feb 2010) Guaranteed bandwidth (Kbps) 256 CCK Avg Sep 2009 38, 625 Op 1 New as Op 2 Feb % of old Feb 2010 tariff 2010 12, 500 32. 4 12, 000 New as % of old tariff 31. 1 512 72, 276 23, 000 31. 8 24, 000 33. 2 1024 282, 102 <$3, 500 48, 000 $600 17. 0 Note: Retail prices have been slow in coming down!!

4. Regulatory environment perception survey
 in Kenya from")
Background What? A perception survey of the Telecom Regulatory Environment (TRE) in Kenya from 57 industry experts from 3 balanced sectors: Operators, consultants, CSO/public sector/researchers When? Jul-Aug 2009 (before i/connection determination #2) Why? Gather perceptions of the telecom regulatory and policy environment in the country Gauge the strengths and weaknesses of the environment Use the results to influence changes in the ICT policy and regulatory environment in Kenya Benchmark with other African countries Results ca be used as a tool for investors to assess 23 regulatory risk in a country

Data collection Assessment of three sectors: For each of the 3 sectors, assessment of 7 dimensions: 1. 2. 3. 4. 5. 6. 7. Fixed services, Mobile services, ISP/VAS services Market entry Allocation of scarce resources Interconnection Regulation of anti-competitive practices Universal service obligation Tariff regulation Quality of Service For each dimension, rating the quality of the regulatory environment on a scale 1 = highly ineffective to 5 = highly effective 24

Key findings

Mobile services

VANS/ISP services

Regulation of interconnection

Regulation of anti-competitive practices

Quality of services

Average satisfaction rate

5. Research challenges Difficult to obtain some of the data, esp. Financial data - investment and revenue Most sector-oriented data not available Limited information in operators websites Some don’t publish the tariffs on the web Email contacts don’t work - except customer service email whose directed queries were rarely answered Offers and promotions that made it challenging to establish the actual tariffs CCK information often differed from the operator data While respondents promised to respond to the online regulatory review, most did not

6. Challenges & policy recommendations Challenge Policy recommendation Timing 1. National ICT policy not in tune with current realities Update the existing ICT June policy through 2011 stakeholder participation 2. Regulations not supported by key stakeholders Review regulations with March support of key 2011 stakeholders 3. High retail cost of broadband Institute a regulatory mechanism(s) to bring down retail broadband tariffs March 2011

Challenge 4. ICT is not real sectors, e. g. cannot obtain aggregated socio -economic data on ICT employment, GDP contrib. , products, etc. ) Policy recommendation Timing Mo. IC and KNBS to Dec engage in a process 2011 that will create a single ICT/ITES sector and mainstream it into the national planning and operational frameworks (e. g. KNBS can collect data on ICT/ITES as a sector like all sectors)

Challenge 5. No institution has explicit mandate over ICT sector data 6. ICT sector data is not accurate & upto-date 7. Independenc e and power of the regulator Policy recommendation Timing Give legal mandate June over ICT data to one of 2011 the existing institutions Body to regularly Conticollect and provide nuous accurate data on ICT sector, collaborating with KNBS Strengthen CCK to be a ? more independent & powerful converged regulator
- Slides: 35