Observational Health Data Sciences and Informatics OHDSI Data
 Data Science for Healthcare (Da. SH) Oct")
Observational Health Data Sciences and Informatics (OHDSI) Data Science for Healthcare (Da. SH) Oct 5, 2016
 Mission: To improve health, by")
Observational Health Data Sciences and Informatics (OHDSI, as “Odyssey”) Mission: To improve health, by empowering a community to collaboratively generate the evidence that promotes better health decisions and better care A multi-stakeholder, interdisciplinary, international collaborative with a coordinating center at Columbia University Aiming for 1, 000, 000 patient data network http: //ohdsi. org

OHDSI’s global research community • • >140 collaborators from 20 different countries Experts in informatics, statistics, epidemiology, clinical sciences Active participation from academia, government, industry, providers Currently 600 million patient records in 52 databases http: //ohdsi. org/who-we-are/collaborators/

Why large-scale analysis is needed in healthcare All drugs All health outcomes of interest

Patient-level predictions for personalized evidence requires big data 2 million patients seem excessive or unnecessary? • Imagine a provider wants to compare her patient with other patients with the same gender (50%), in the same 10 -year age group (10%), and with the same comorbidity of Type 2 diabetes (5%) • Imagine the patient is concerned about the risk of ketoacidosis (0. 5%) associated with two alternative treatments they are considering • With 2 million patients, you’d only expect to observe 25 similar patients with the event, and would only be powered to observe a relative risk > 2. 0 Aggregated data across a health system of 1, 000 providers may contain 2, 000 patients

Evidence OHDSI seeks to generate from observational data • Clinical characterization – Natural history: Who has diabetes, and who takes metformin? – Quality improvement: What proportion of patients with diabetes experience complications? • Population-level estimation – Safety surveillance: Does metformin cause lactic acidosis? – Comparative effectiveness: Does metformin cause lactic acidosis more than glyburide? • Patient-level prediction – Precision medicine: Given everything you know about me, if I take metformin, what is the chance I will get lactic acidosis? – Disease interception: Given everything you know about me, what is the chance I will develop diabetes?

OHDSI’s approach to open science Open science Data + Analytics + Domain expertise Open source software Generate evidence Enable users to do something • Open science is about sharing the journey to evidence generation • Open-source software can be part of the journey, but it’s not a final destination • Open processes can enhance the journey through improved reproducibility of research and expanded adoption of scientific best practices

Standardizing workflows to enable reproducible research Open science Database summary Population-level estimation for comparative effectiveness research: Is <intervention X> better than <intervention Y> in reducing the risk of <condition Z>? Cohort definition Defined inputs: • Target exposure • Comparator group • Outcome • Time-at-risk • Model specification Cohort summary Compare cohorts Exposureoutcome summary Effect estimatio n& calibration Generate evidence Compare databases Consistent outputs: • analysis specifications for transparency and reproducibility (protocol + source code) • only aggregate summary statistics (no patient-level data) • model diagnostics to evaluate accuracy • results as evidence to be disseminated • static for reporting (e. g. via publication) • interactive for exploration (e. g. via app)
 – 43 sources terminologies from")
OHDSI Distinguishing Features • International effort (size & coverage) – 43 sources terminologies from around the world • Open science (depth) – Infrastructure serves the science – Stack: Terminology, CDM, ETL, QA, Visualization, Novel analytic methods, Clinical research • Full information model

How OHDSI Works OHDSI Coordinating Center Source data warehouse, with identifiable patient-level data ETL Standardized, deidentified patientlevel database (OMOP CDM v 5) Standardized large-scale analytics Analysis results Data network support Analytics development and testing Research and education OHDSI. org Summary statistics results repository Experiment Analogy Plausibility Strength Temporality Consistency Coherence Biological gradient Specificity Comparative effectiveness Predictive modeling OHDSI Data Partners

Deep information model OMOP CDM v 5. 0. 1 Person Observation_period Specimen Standardized health system data Location Provider Death Visit_occurrence Cost Drug_exposure Device_exposure Observation Fact_relationship Cohort_attribute Condition_era Drug_era Dose_era Standardized derived elements Condition_occurrence Note Concept Vocabulary Domain Concept_class Concept_relationship Relationship Concept_synonym Cohort Measurement CDM_source Concept_ancestor Source_to_concept_map Drug_strength Cohort_definition Attribute_definition Standardized vocabularies Procedure_occurrence Standardized health economics Payer_plan_period Standardized clinical data Care_site Standardized meta-data

Extensive vocabularies

Preparing your data for analysis OHDSI tools built to help Patient-level data in source system/ schema ETL design ETL implement White. Rabbit: profile your source data ATHENA: standardized vocabularies for all CDM domains Rabbit. In. AHat: map your source structure to CDM tables and fields Patient-level data in OMOP CDM: DDL, index, constraints for Oracle, SQL Server, Postgres. QL; Vocabulary tables with loading scripts ETL test ACHILLES: profile your CDM data; review data quality assessment; explore population-level summaries Usagi: map your source codes to CDM vocabulary OHDSI Forums: Public discussions for OMOP CDM Implementers/developers http: //github. com/OHDSI

Step 1: What is in your dataset? White. Rabbit • White. Rabbit, a tool that lets you – Scans your dataset – Extracts summary information on the contents – Produces a file that can be consumed for ETL planning

Step 2: Map Your Dataset to CDM Rabbit In a Hat • Rabbit-In-a-Hat is a tool that uses the White. Rabbit output and lets you match up your dataset with the CDM model

OHDSI Has Extensive Vocabulary Maps Athena 1 SNOMED 2 ICD 9 CM 3 ICD 9 Proc 4 CPT 4 5 HCPCS 6 LOINC 7 NDFRT 8 Rx. Norm 9 NDC 10 GPI 11 UCUM 12 Gender 13 Race 14 Place of Service 15 Med. DRA 16 Multum 17 Read 18 OXMIS 19 Indication 20 ETC 21 ATC 22 Multilex 28 VA Product 31 SMQ 32 VA Class 33 Cohort 34 ICD 10 35 ICD 10 PCS 40 DRG 41 MDC 42 APC 43 Revenue Code 44 Ethnicity 46 Me. SH 47 NUCC 48 Specialty 50 SPL 53 Genseqno 54 CCS 55 OPCS 4 56 Gemscript 57 HES Specialty 60 PCORNet 65 Currency 70 ICD 10 CM 72 CIEL Systematic Nomenclature of Medicine - Clinical Terms (IHDSTO) International Classification of Diseases, Ninth Revision, Clinical Modification, Volume 1 and 2 (NCHS) International Classification of Diseases, Ninth Revision, Clinical Modification, Volume 3 (NCHS) Current Procedural Terminology version 4 (AMA) Healthcare Common Procedure Coding System (CMS) Logical Observation Identifiers Names and Codes (Regenstrief Institute) National Drug File - Reference Terminology (VA) Rx. Norm (NLM) National Drug Code (FDA and manufacturers) Medi-Span Generic Product Identifier (Wolters Kluwer Health) Unified Code for Units of Measure (Regenstrief Institute) OMOP Gender Race and Ethnicity Code Set (USBC) Place of Service Codes for Professional Claims (CMS) Medical Dictionary for Regulatory Activities (MSSO) Cerner Multum (Cerner) NHS UK Read Codes Version 2 (HSCIC) Oxford Medical Information System (OCHP) Indications and Contraindications (FDB) Enhanced Therapeutic Classification (FDB) WHO Anatomic Therapeutic Chemical Classification Multilex (FDB) VA National Drug File Product (VA) Standardised Med. DRA Queries (MSSO) VA National Drug File Class (VA) Legacy OMOP HOI or DOI cohort International Classification of Diseases, 10 th Revision, (WHO) ICD-10 Procedure Coding System (CMS) Diagnosis-related group (CMS) Major Diagnostic Categories (CMS) Ambulatory Payment Classification (CMS) UB 04/CMS 1450 Revenue Codes (CMS) OMOP Ethnicity Medical Subject Headings (NLM) National Uniform Claim Committee Health Care Provider Taxonomy Code Set (NUCC) Medicare provider/supplier specialty codes (CMS) Structured Product Labeling (FDA) Generic sequence number (FDB) Clinical Classifications Software for ICD-9 -CM (HCUP) OPCS Classification of Interventions and Procedures version 4 (NHS) Gemscript NHS dictionary of medicine and devices (NHS) Hospital Episode Statistics Specialty (NHS) National Patient-Centered Clinical Research Network (PCORI) International Currency Symbol (ISO 4217) International Classification of Diseases, 10 th Revision, Clinical Modification (NCHS) Columbia International e. Health Laboratory (Columbia University)

Additional Vocabulary Support • If you use non-standard vocabularies, you can also utilize our vocabulary mapper tool Usagi

Step 3: Turn the Crank • Write the SQL using the generated ETL doc as you guide • Get help on the forums from the many folks who have done it before • We provide tools to explore and analyze your data and data quality as you go along so you can iterate as needed

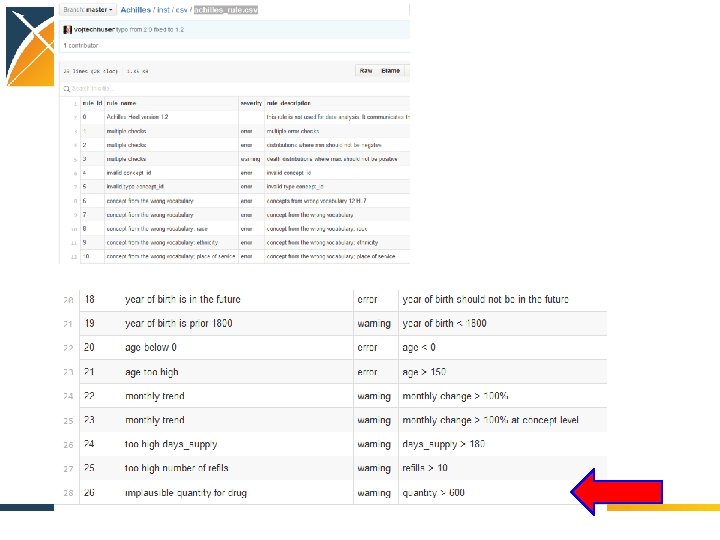
ACHILLES Heel Helps You Validate Your Data Quality

ATLAS to build, visualize, and analyze cohorts

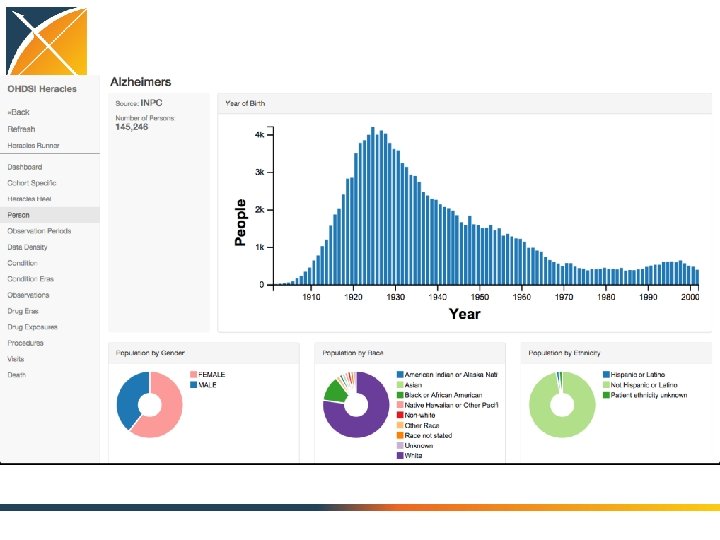
Characterize the cohorts of interest

LAERTES: Summarizing evidence from existing data sources: literature, labeling, spontaneous reporting

OHDSI in Action • Generate evidence – Randomized trial is the gold standard – Observational research seen as supporting

Characterization • Today we carry out RCTs without clear knowledge of actual practice • There will be no RCTs without an observational precursor – It will be required to characterize a population using large-scale observational data before designing an RCT – Disease burden – Actual treatment practice – Time on therapy – Course and complication rate – Done now somewhat through literature and pilot studies

Treatment Pathways Global stakeholders Public Academics Industry Conduits Evidence RCT, Obs Social media Lay press Local stakeholders Family Literature Patient Guidelines Clinician Advertising Regulator Formulary Labels Inputs Indication Feasibility Cost Preference Consultant

Network process 1. Join the collaborative 2. Propose a study to the open collaborative 3. Write protocol – http: //www. ohdsi. org/web/wiki/doku. php? id=research: studies 4. 5. 6. 7. 8. Code it, run it locally, debug it (minimize others’ work) Publish it: https: //github. com/ohdsi Each node voluntarily executes on their CDM Centrally share results Collaboratively explore results and jointly publish findings

OHDSI in action: Chronic disease treatment pathways • Conceived at AMIA • Protocol written, code written and tested at 2 sites • Analysis submitted to OHDSI network • Results submitted for 7 databases 15 Nov 2014 30 Nov 2014 2 Dec 2014 5 Dec 2014

OHDSI participating data partners Abbreviation Name AUSOM Ajou University School of Medicine Description Population, millions CCAE South Korea; inpatient hospital 2 EHR Market. Scan Commercial Claims and Encounters. US private-payer claims 119 CPRD UK Clinical Practice Research Datalink UK; EHR from general practice 11 CUMC Columbia University Medical Center US; inpatient EHR 4 GE GE Centricity US; outpatient EHR 33 INPC Regenstrief Institute, Indiana Network for Patient Care US; integrated health exchange 15 JMDC Japan Medical Data Center Japan; private-payer claims 3 MDCD Market. Scan Medicaid Multi-State US; public-payer claims 17 MDCR Market. Scan Medicare Supplemental and Coordination of Benefits US; private and public-payer claims 9 OPTUM STRIDE Optum Clin. Formatics Stanford Translational Research Integrated Database Environment US; private-payer claims US; inpatient EHR 40 2 HKU Hong Kong University Hong Kong; EHR 1

Treatment pathway event flow

Proceedings of the National Academy of Sciences, 2016

Treatment pathways for diabetes T 2 DM : All databases First drug Second drug Only drug

Population-level heterogeneity across systems, and patient-level heterogeneity within systems Type 2 Diabetes Mellitus CCAE Hypertension CUMC CPRD INPC JMDC MDCR Depression MDCD GE OPTUM
 have a")
Patient-level heterogeneity HTN: All databases 25% of HTN patients (10% of others) have a unique path despite 250 M pop

Monotherapy – diabetes 1 0. 9 General upward trend in monotherapy 0. 8 0. 7 0. 6 0. 5 0. 4 0. 3 0. 2 0. 1 0 1989 1994 1999 2004 2009

Monotherapy – HTN 1 Academic medical centers differ from general practices 0. 9 0. 8 0. 7 0. 6 0. 5 0. 4 0. 3 0. 2 0. 1 0 1989 1994 1999 2004 2009

Monotherapy – diabetes 1 General practices, whether EHR or claims, have similar profiles 0. 9 0. 8 0. 7 0. 6 0. 5 0. 4 0. 3 0. 2 0. 1 0 1989 1994 1999 2004 2009

Conclusions: Treatment pathways • General progress toward more consistent therapy over time and across locations • Differ by country • Differ by practice type • Not differ so much by data type (claims, EHR) • Differ by disease – Even before guidelines published – Disease differences and literature • Huge proportion of unique pathways

Conclusions: Network research • It is feasible to encode the world population in a single data model – Over 600, 000 records by voluntary effort (682, 000) • Generating evidence is feasible • Stakeholders willing to share results • Able to accommodate vast differences in privacy and research regulation

What is the quality of the current evidence from observational analyses? August 2010: “Among patients in the UK General Practice Research Database, the use of oral bisphonates was not significantly associated with incident esophageal or gastric cancer” Sept 2010: “In this large nested casecontrol study within a UK cohort [General Practice Research Database], we found a significantly increased risk of oesophageal cancer in people with previous prescriptions for oral bisphonates” 41

Distribution of possible results for one hypothesis Stat signif > 1 1. 6 1. 4 1. 2 1 OR 0. 8 Databases 0. 6 0. 4 Methods

Distribution of possible results for one hypothesis Stat signif > 1 1. 6 1. 4 1. 2 1 OR 0. 8 Databases 0. 6 0. 4 Methods

Distribution of possible results for one hypothesis Stat signif > 1 1. 6 1. 4 1. 2 1 OR 0. 8 Stat signif < 1 0. 6 0. 4 Methods Databases

Distribution of possible results for one hypothesis JAMA BMJ 1. 6 1. 4 1. 2 1 OR 0. 8 Databases 0. 6 0. 4 Methods Study #3

Distribution of possible results for one hypothesis OR Databases Methods

Take a scientific approach to science 1. Database heterogeneity: Holding analysis constant, different data may yield different estimates Madigan D, Ryan PB, Schuemie MJ et al, American Journal of Epidemiology, 2013 “Evaluating the Impact of Database Heterogeneity on Observational Study Results” 2. Parameter sensitivity: Holding data constant, different analytic design choices may yield different estimates Madigan D, Ryan PB, Schuemie MJ, Therapeutic Advances in Drug Safety, 2013: “Does design matter? Systematic evaluation of the impact of analytical choices on effect estimates in observational studies” 3. Empirical performance: Most observational methods do not have nominal statistical operating characteristics Ryan PB, Stang PE, Overhage JM et al, Drug Safety, 2013: “A Comparison of the Empirical Performance of Methods for a Risk Identification System” 4. Empirical calibration can help restore interpretation of study findings Schuemie MJ, Ryan PB, Du. Mouchel W, et al, Statistics in Medicine, 2013: “Interpreting observational studies: why empirical calibration is needed to correct p-values”

Open science • Admit that there is a problem • Study it scientifically – Define that surface and differentiate true variation from confounding … • Total description of every study • Research into new methods

Columbia Data Sharing Approach Cornell, NYP, NYU, Sinai, Einstein, … New York City CDRN Columbia PCORnet NYC CDRN (OMOP) EHR OHDSI OMOP NYC CDRN (OMOP) i 2 b 2 OHDSI OMOP i 2 b 2 SCILHS (Boston) OHDSI i 2 b 2 SHRINE

National Precision Medicine Initiative

PMI Data and Research support Center

Decide the data model for the national initiative

Quality assurance for the nationally collected data

e. MERGE Aim 1: Advance next-generation phenotyping Aim 2: Perform genetic association studies of rare variants Aim 3: Develop practical, scalable learning mechanisms for returning results Aim 4: Provide genomic decision support Aim 5: Disseminate data and algorithms

Join the journey http: //ohdsi. org 55
- Slides: 55