PERTEMUAN 2 STATISTIKA DESKRIPTIF NOTASI SIGMA Notasi Sigma


 50 orang mahasiswa BSI")


 : I = R / k = 53")

 37 – 44 12 12/50 x")


 < 36,")

- Slides: 20
PERTEMUAN 2 STATISTIKA DESKRIPTIF
NOTASI SIGMA Notasi Sigma merupakan notasi yang digunakan untuk menyatakan penjumlahan bilangan. Perhatikan contoh berikut : Untuk notasi: dimana : 1 adalah batas bawah n adalah batas ui adalah suku dalam hal ini huruf yang dipakai tidak selalu i dapat juga menggunakan huruf lain.
co nt oh : Berikut ini beberapa sifat dari notasi sigma yang dapat dijadikan panduan dalam mengerjakan soal-soal mengenai notasi sigma :
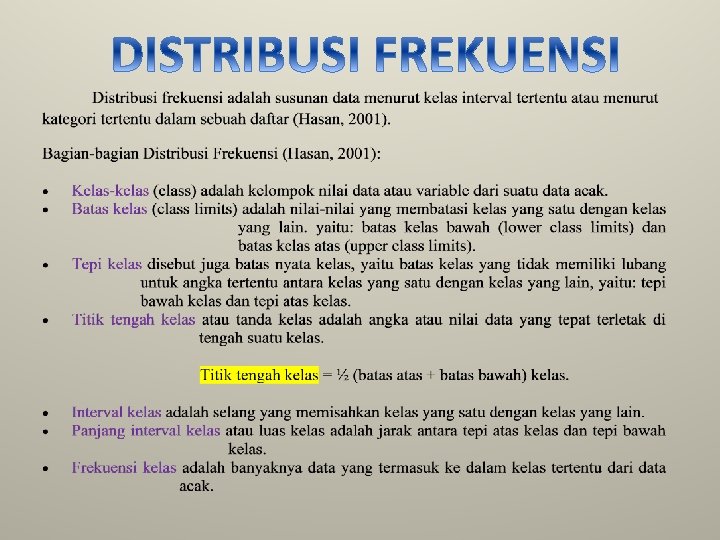
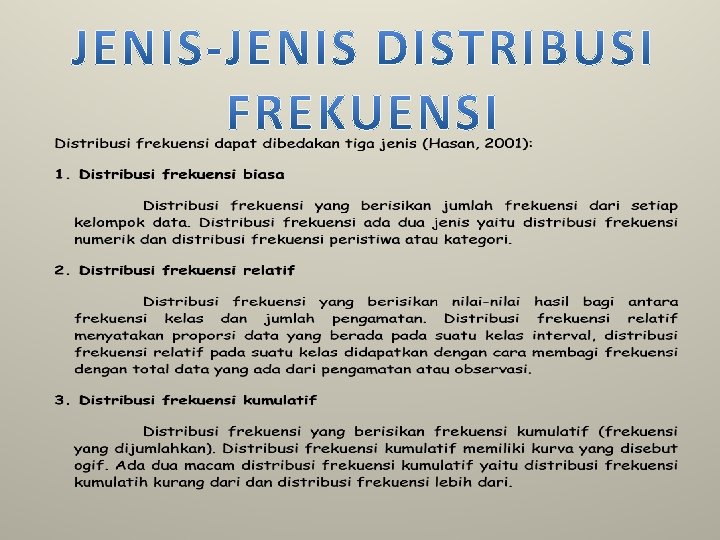
PENYUSUNAN DISTRIBUSI FREKUENSI
NOTASI SIGMA •
NOTASI SIGMA •
NOTASI SIGMA •
NOTASI SIGMA •
DISTRIBUSI FREKUENSI Soal: Ø Dibawah ini adalah Berat Badan (Kg) 50 orang mahasiswa BSI Kaliabang Kelas 11. 2 A. 05 Jurusan Sistem Informasi Akuntansi. 65 47 46 62 57 40 48 45 65 42 53 48 69 39 43 42 39 85 42 57 67 40 66 43 56 Ø Tentukanlah: 1. Data Terurut 2. Range (Jangkauan) 3. Banyaknya Kelas dengan rumus Sturges 4. Interval (Lebar Kelas) 66 42 52 54 55 52 47 51 52 61 54 51 37 55 70 55 50 58 65 49 49 50 47 39 90
DISTRIBUSI FREKUENSI Tentukanlah: 5. Batas bawah kelas ke-1 Batas kelas ke-1 Tepi bawah kelas ke-1 Tepi atas kelas ke-1 Panjang interval kelas 6. Tabel distribusi Frekuensi dengan tally/turus 7. Distribusi Frekuensi Relatif 8. Distribusi Frekuensi Kumulatif Kurang dari 9. Distribusi Frekuensi Kumulatif Lebih dari 10. Distribusi Frekuensi Kumulatif Relatif Kurang dari 11. Distribusi Frekuensi Kumulatif Relatif Lebih dari.
DISTRIBUSI FREKUENSI Penyelesaian : 1. Membuat data terurut. 37 39 39 43 43 45 49 50 50 54 55 55 65 65 65 39 46 51 55 66 40 47 51 56 66 40 47 52 57 67 2. Range (Jangkauan), R = X max – X min = 90 – 37 = 53 3. Banyaknya kelas dengan rumus STURGES : k = 1 + 3, 3 log N k = 1 + 3, 3 log 50 k = 6, 6 7 42 47 52 57 69 42 48 52 58 70 42 48 53 61 85 42 49 54 62 90
DISTRIBUSI FREKUENSI 4. Interval (Lebar Kelas) : I = R / k = 53 / 7 = 7, 57 8 5. Batas bawah kelas ke-1 = 37 Batas kelas ke-1 = 44 Tepi bawah kelas ke-1 = 37 – 0, 5 = 36, 5 Tepi atas kelas ke-1 = 44 + 0, 5 = 44, 5 Panjang interval kelas = 36, 5 – 44, 5 = 8 6. Titik tengah kelas ke-1 = ½ (44 + 37) = 81/2 = 40, 5
Tabel Distribusi Frekuensi Kelas Ke- Interval Kelas Titik Tengah 1 37 – 44 40, 5 |||| || 12 2 45 – 52 34, 5 |||| | 16 3 53 – 60 44, 5 |||| 10 4 61 – 68 54, 5 |||| 8 5 69 – 76 64, 5 || 2 6 77 – 84 74, 5 7 85 – 92 84, 5 Sistem Turus f 0 || 2 50
DISTRIBUSI FREKUENSI RELATIF Interval Kelas Frekuensi Relatif (%) 37 – 44 12 12/50 x 100% = 24% 45 – 52 16 32 53 – 60 10 20 61 – 68 8 16 69 – 76 2 4 76 – 84 0 0 84 – 92 2 4 50 100
DISTRIBUSI FREKUENSI KUMULATIF KURANG DARI Interval Kelas Frekuensi 37 – 44 12 12 45 – 52 16 28 53 – 60 10 38 61 – 68 8 46 69 – 76 2 48 76 – 84 0 48 84 – 92 2 50 50
DISTRIBUSI FREKUENSI KUMULATIF LEBIH DARI Interval Kelas Frekuensi 37 – 44 12 50 45 – 52 16 38 53 – 60 10 22 61 – 68 8 12 69 – 76 2 4 76 – 84 0 2 84 – 92 2 2 50
DISTRIBUSI FREKUENSI KUMULATIF RELATIF KURANG DARI Interval Kelas Frekuensi Kumulatif Relatif (%) < 36, 5 0 0/50 x 100% = 0 % < 44, 5 12 12/50 x 100% = 24 % < 52, 5 28 56 < 60, 5 38 76 < 68, 5 46 92 < 76, 5 48 96 < 84, 5 48 96 < 92, 5 50 100
Sumber : - herlawati. com - rumus-matematika. com - www. kajianpustaka. com - Hasan, M. Iqbal. 2001. Pokok-pokok Materi Statistik I (Statistik Deskriptif), Aksara. Jakarta. Bumi