p Ka calculations Methods and Applications A H

- Slides: 17
p Ka calculations Methods and Applications A. H. Juffer The University of Oulu Finland-Suomi
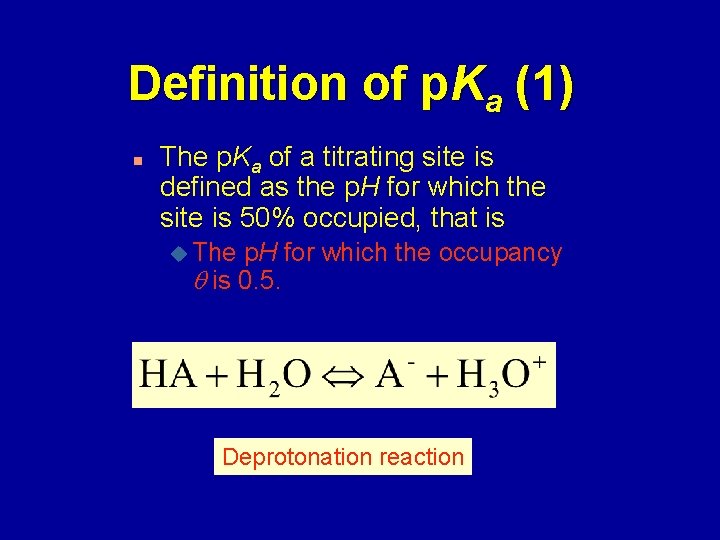
Definition of p. Ka (1) n The p. Ka of a titrating site is defined as the p. H for which the site is 50% occupied, that is u The p. H for which the occupancy is 0. 5. Deprotonation reaction
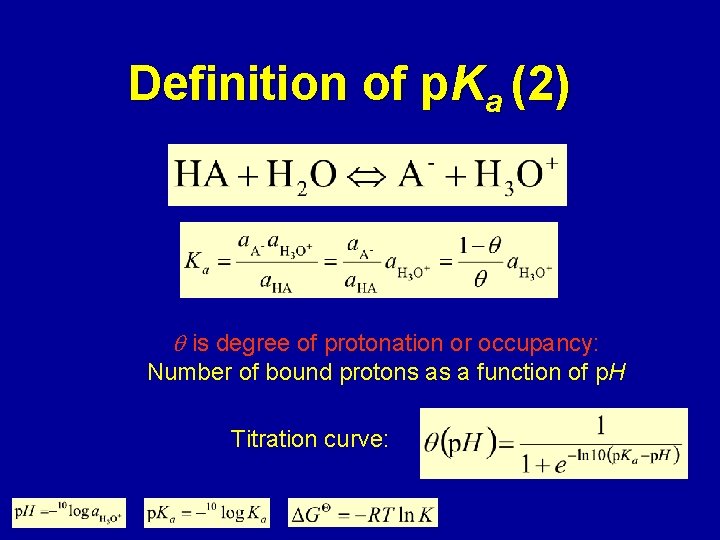
Definition of p. Ka (2) is degree of protonation or occupancy: Number of bound protons as a function of p. H Titration curve:
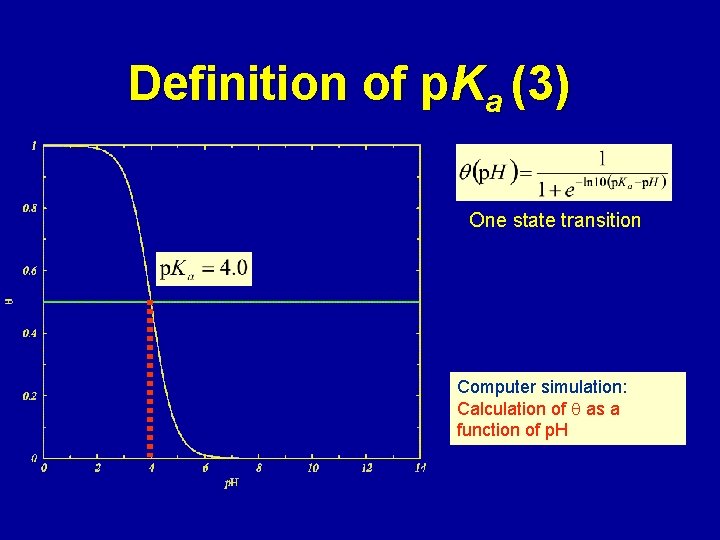
Definition of p. Ka (3) One state transition Computer simulation: Calculation of as a function of p. H
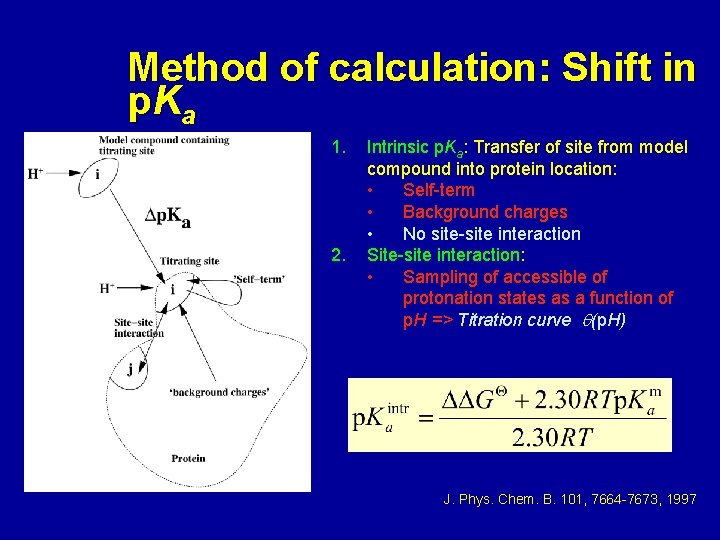
Method of calculation: Shift in p Ka 1. 2. Intrinsic p. Ka: Transfer of site from model compound into protein location: • Self-term • Background charges • No site-site interaction Site-site interaction: • Sampling of accessible of protonation states as a function of p. H => Titration curve (p. H) J. Phys. Chem. B. 101, 7664 -7673, 1997
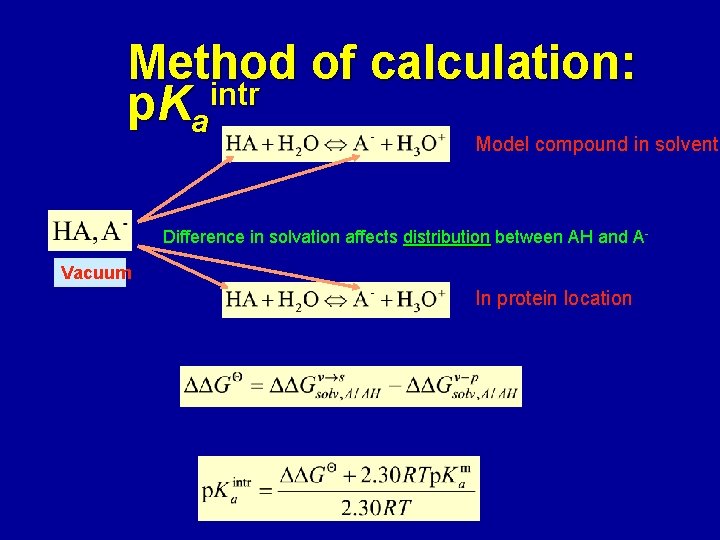
Method of calculation: p. Kaintr Model compound in solvent Difference in solvation affects distribution between AH and AVacuum In protein location
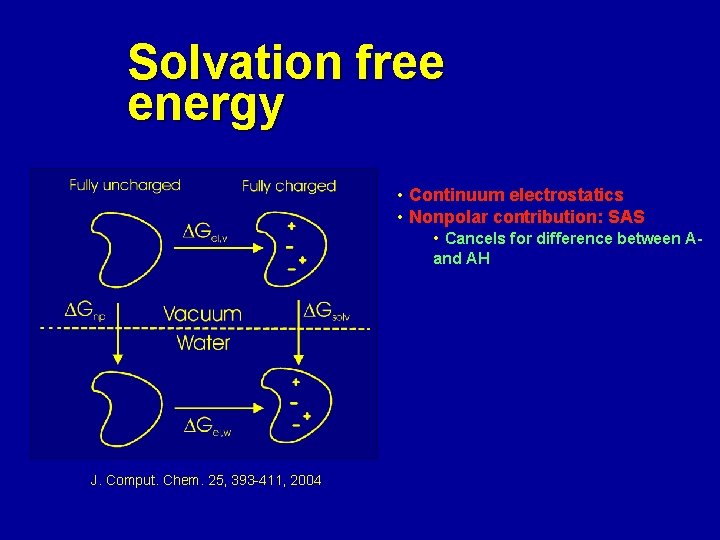
Solvation free energy • Continuum electrostatics • Nonpolar contribution: SAS • Cancels for difference between Aand AH J. Comput. Chem. 25, 393 -411, 2004
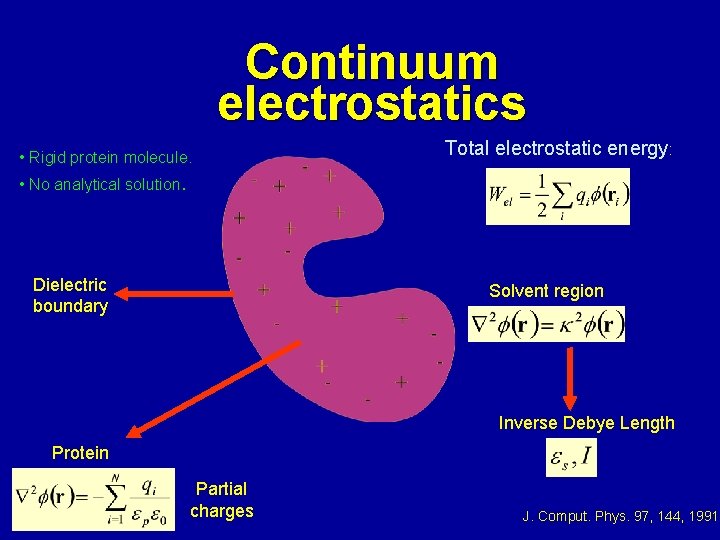
Continuum electrostatics • Rigid protein molecule. Total electrostatic energy: • No analytical solution. Dielectric boundary Solvent region Inverse Debye Length Protein Partial charges J. Comput. Phys. 97, 144, 1991
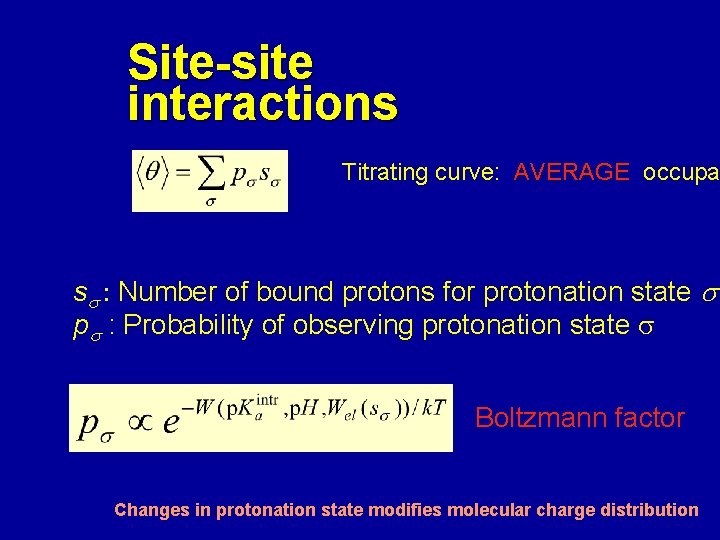
Site-site interactions Titrating curve: AVERAGE occupa ss : Number of bound protons for protonation state s ps : Probability of observing protonation state s Boltzmann factor Changes in protonation state modifies molecular charge distribution
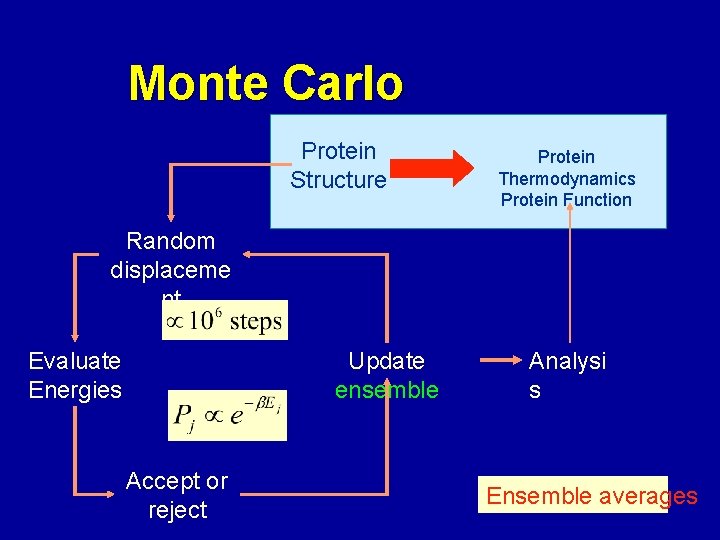
Monte Carlo Protein Structure Protein Thermodynamics Protein Function Random displaceme nt Evaluate Energies Update ensemble Accept or reject Analysi s Ensemble averages
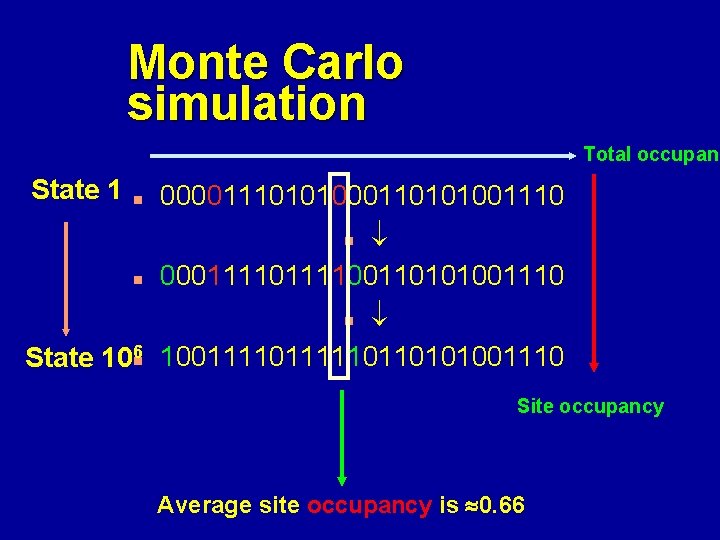
Monte Carlo simulation Total occupanc State 1 00001110101000110101001110 n n 000111100110101001110 n State 106 n 100111110110101001110 n Site occupancy Average site occupancy is 0. 66
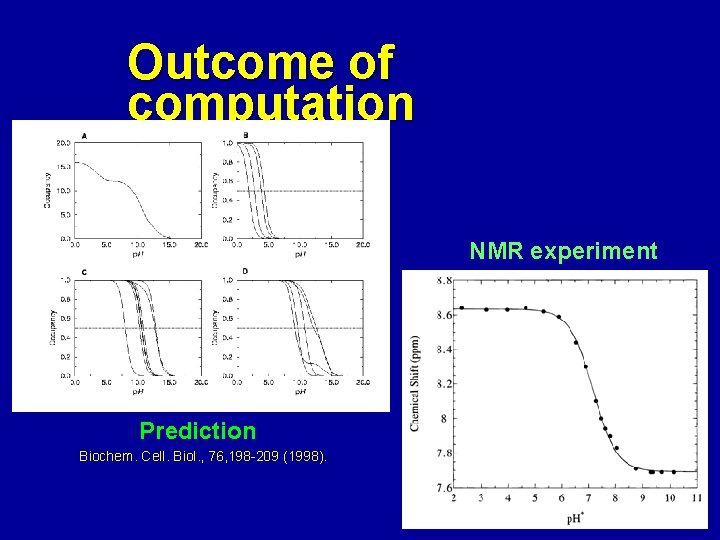
Outcome of computation NMR experiment Prediction Biochem. Cell. Biol. , 76, 198 -209 (1998).
Predictions are useful n n n Molecule level explanation of titration curves Details on electrostatic network: protein structure Statements about enzyme activity: protein function (J. Biol. Chem. , 275, 25633 -25640, 2000)
Problems n n n Correlation between protein dynamics and protonation state is commonly ignored. At low or high p. H, proteins become unstable or denaturate. New models properly should sample both conformation and protonation states simultaneously: u Coarse grained model.
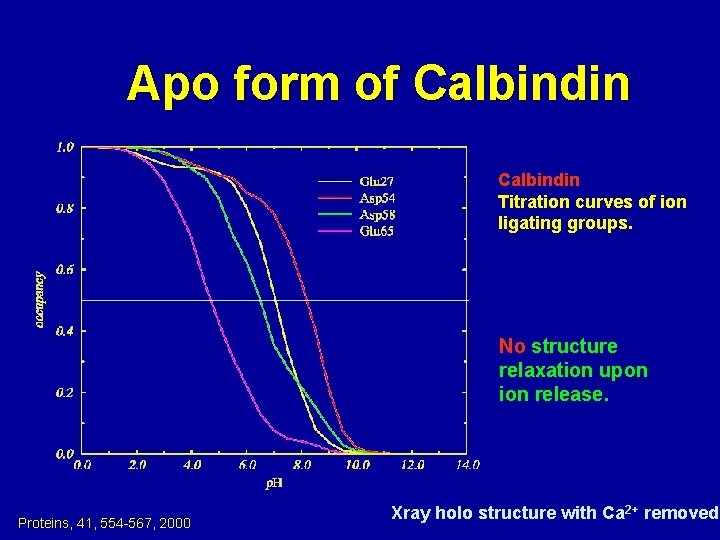
Apo form of Calbindin Titration curves of ion ligating groups. No structure relaxation upon ion release. Proteins, 41, 554 -567, 2000 Xray holo structure with Ca 2+ removed
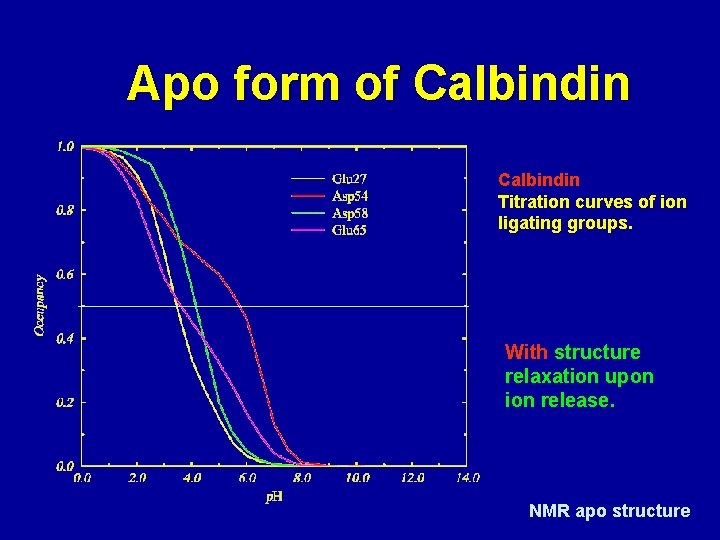
Apo form of Calbindin Titration curves of ion ligating groups. With structure relaxation upon ion release. NMR apo structure
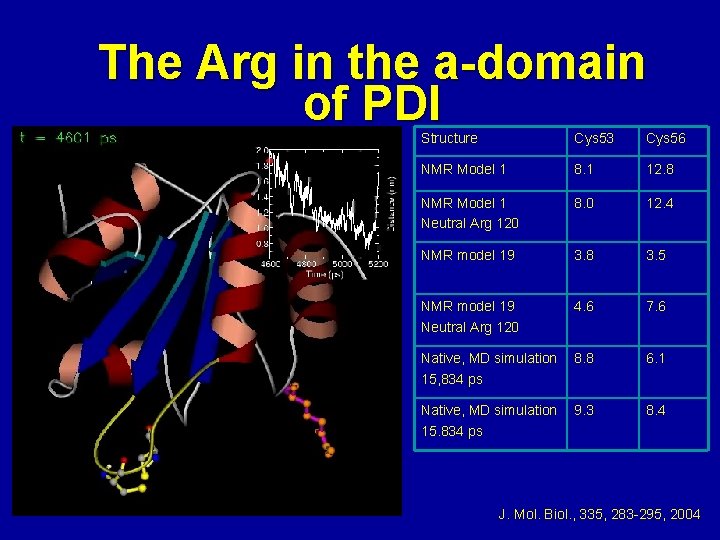
The Arg in the a-domain of PDI Structure Cys 53 Cys 56 NMR Model 1 8. 1 12. 8 NMR Model 1 Neutral Arg 120 8. 0 12. 4 NMR model 19 3. 8 3. 5 NMR model 19 Neutral Arg 120 4. 6 7. 6 Native, MD simulation 15, 834 ps 8. 8 6. 1 Native, MD simulation 15. 834 ps 9. 3 8. 4 J. Mol. Biol. , 335, 283 -295, 2004