Oklahoma Crop Agriculture Kim Anderson Cooperative Extension Crop


 Total $6. 2 Livestock $4. 8 $1. 4 Crop")
 Corn, sorghum, oats, barley, rye wheat, soybeans,")
 Harvested (Million Acres)")
 Harvested (Million Acres) Price ($/Bu)")


")
 Price ($/Bu)")
")
 Price ($/Bu)")
")
 Planted (1, 000 Acres)")
")
 Planted (1, 000 Acres)")
 Planted (1, 000 Acres)")
 Sorghum Corn Soybeans Cotton Peanuts")
")
")
 (Billion Bu/480 Bales)")

 Crop 2012 2017")

 • Number of farms: 23 (2015); 34 (2016) • Total acres")
 • Total sales of vegetables grown in the open of $259,")


- Slides: 39
Oklahoma Crop Agriculture Kim Anderson Cooperative Extension Crop Marketing Specialist Oklahoma State University
Thought for the day! • “Copying one person’s work is plagiarism. Copying two or more persons’ work is research. ” Dr. Luther Tweeten (OSU 1977). • Data and Budgets provided by: – Troy Marshall, USDA/NASS – Trent Milacek, OCES Enid – Roger Sahs, OCES Stillwater – Dave Shideler, Ag Econ Stillwater
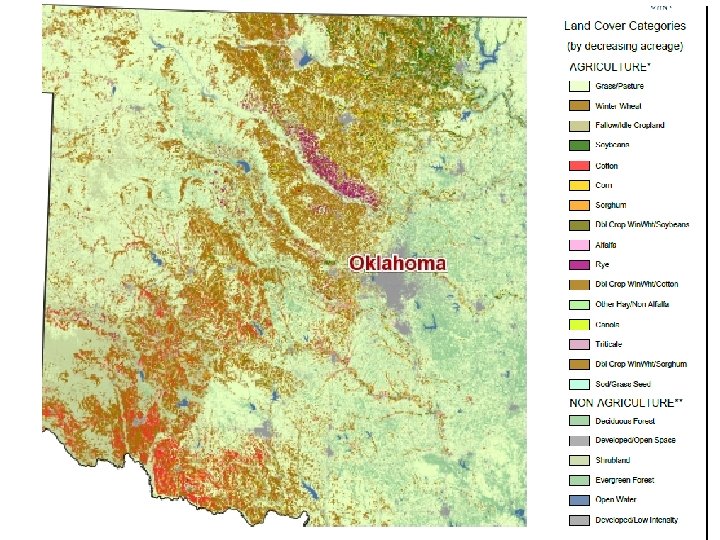
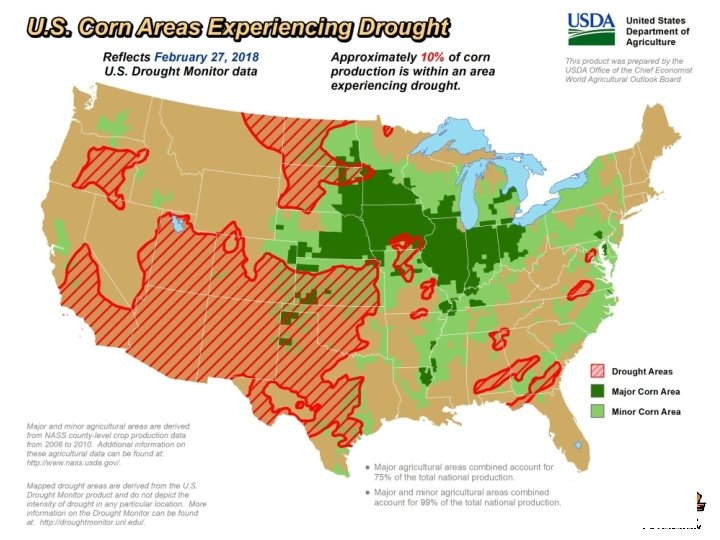
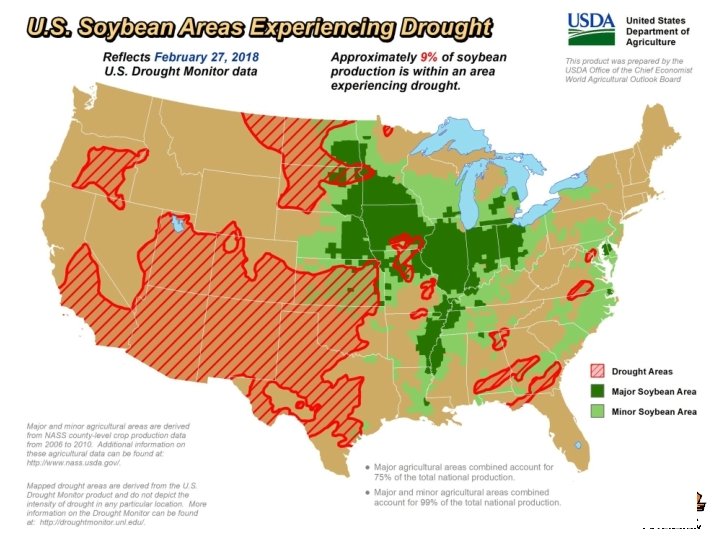
nassgeodata. gmu. edu/cropscape
Forward Contract Prices for 2018 Harvest Delivery F. Contract Basis ¢ F. Contract Price Wheat KC July -58 -40 $5. 40 $4. 90 Corn CBT Dec -55 10 $4. 05 $3. 50 Sorghum CBT Dec -65 $4. 05 $3. 40 Soybeans CBT Nov -90 $10. 35 $9. 45 ICEUS Dec -5 78. 40¢ 73¢ Crop Cotton Forward Contract Canola $6. 48 Sesame 33¢
CFTC Commitments of Traders Commodity SRW Wheat HRW Wheat Corn Soybeans 1/9/18 2/20/1 3/6/18 (Thousand Contracts) -142 -67 -33 -20 12 21 -227 -103 19 99 164 184
Oklahoma Farm Income (Billion Dollars) Total $6. 2 Livestock $4. 8 $1. 4 Crop Bureau of Economic Analysis: CA 45 Farm Income and Expenses
Oklahoma Harvested Crop Acres Harvested (Million Acres) Corn, sorghum, oats, barley, rye wheat, soybeans, peanuts, cotton, canola, vegetables, hay, others (includes double crop and cover crops).
Oklahoma Wheat Planted (Million Acres) Harvested (Million Acres)
Oklahoma Wheat Planted (Million Acres) Harvested (Million Acres) Price ($/Bu)
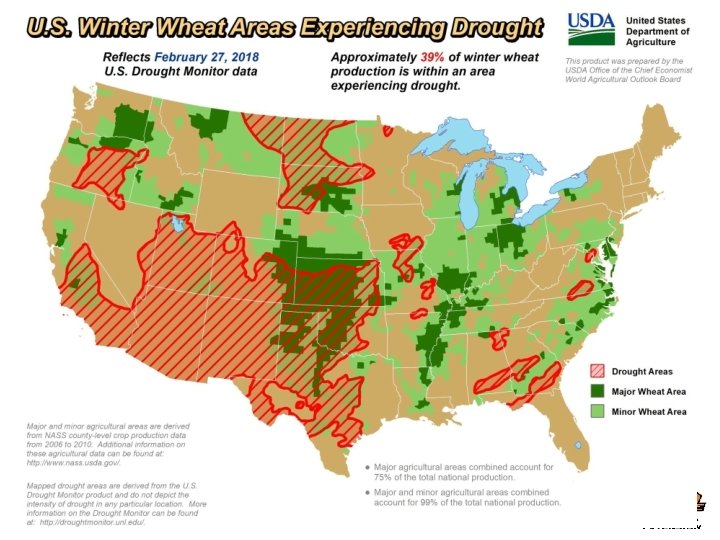
U. S. HRW Wheat Item 2016 2017 2018 Planted 26. 6 23. 4 23. 1 Harvested 21. 9 17. 6 82 75 76 Yield 49. 5 42. 5 39. 1 Production 1, 081 750 687 % Harvested Source: Informa Economics, IEG
Hard Red Winter Wheat State Oklahoma Kansas Texas March 13, 2018 Poor -Very Poor 72% 53% Good-Excellent 7% 12% 13% March 12, 2017 Poor -Very Poor 16% 23% 20% Good-Excellent 42% 40% 35% Source: USDA/NASS
Corn: Planted Acres Planted (1, 000 Acres)
Corn: Planted Acres & Price Planted (1, 000 Acres) Price ($/Bu)
Sorghum: Planted Acres Planted (1, 000 Acres)
Sorghum: Planted Acres & Price Planted (1, 000 Acres) Price ($/Bu)
Cotton: Planted Acres Planted (1, 000 Acres)
Cotton: Planted Acres & Price (¢/lb. ) Planted (1, 000 Acres)
Soybeans: Planted Acres Planted (1, 000 Acres)
Soybeans: Planted Acres & Price ($/Bu) Planted (1, 000 Acres)
Peanut: Planted Acres & Price ($/Cwt. ) Planted (1, 000 Acres)
Major Crops: Planted (1, 000 Acres) Sorghum Corn Soybeans Cotton Peanuts
World: Harvested Acres (Million)
World: Production (Billion Bu/480 Bales)
World: Harvested World: Production (Million Acres) (Billion Bu/480 Bales)
Canola Price $/50# bu Planted 1, 000 Ac Harvested 1, 000 Ac
Summary of Crop Harvested Acres: (5 -year average; 1, 000 acres) Crop 2012 2017 Change Percentage Wheat 3, 870 3, 280 -590 -15 Corn 293 307 14 5 Sorghum 208 331 123 59 Soybeans 350 437 87 25 Cotton 166 277 111 67 Cotton 12 -17 140 555 415 296 Hay 2, 930 3, 150 220 8
Net Return: Garfield Co. Return over Variable Costs Return over Fixed Costs Wheat (35 bu; $4. 90) $21 ($0) Canola (30 bu; $6. 75) ($13) ($39) Corn (80 bu; $3. 50) $14 ($13) Sorghum (50 bu; $3. 40) $7 ($20) Soybeans (25 bu; $9. 45) $26 ($19) Peanuts (4000#; $0. 20) $297 $112 Cotton (600#; $0. 68) $104 $73 Enterprise Peanuts & Cotton Budgets for SW OK
Certified Organic (Oklahoma) • Number of farms: 23 (2015); 34 (2016) • Total acres increased from 6, 082 (2015); 18, 008 (2016). – 29 farms had crop sales, – 5 livestock and/or poultry sales – 4 livestock and/or poultry products sales. • 13 growers harvested 7, 032 acres of field crops with sales of $2, 030, 942. – soybeans ($863, 120), – wheat ($687, 480), – dry hay ($455, 967). • Cattle (all cattle except milk cows and beef cows) $457, 523. Source: Troy Marshall, USDA/NASS
Certified Organic (Oklahoma) • Total sales of vegetables grown in the open of $259, 558 were produced on 14 acres from 13 farms. – – – tomatoes $73, 360, squash $23, 534, potatoes $18, 720, lettuce $16, 712 cabbage $15, 865. • Berries and other fruits (excluding apples and citrus) grown on 6 acres from 8 growers – $96, 276 • Egg sales came to $98, 500 Source: Troy Marshall, USDA/NASS
Oklahoma Climatological Survey Annual Precipitation/Temperature History with 5 -year Tendencies 1900 s 1910 s 1920 s 1930 s 1940 s 1950 s 1960 s 1970 s 1980 s 1990 s 2000 s 2010 s Precipitation Temperature
Farm Size: Acres of Cropland
Selected Annual Production Expenses by Category: 2012 -16 Source: Oklahoma Agricultural Statistics 2017, USDA/NASS Oklahoma Department of Agriculture Food & Forestry
Questions? Providing Inspiration for Agricultural Succe