Numerical Simulation and Prediction of Supercell Tornadoes Ming



- Slides: 34
Numerical Simulation and Prediction of Supercell Tornadoes Ming Xue School of Meteorology and Center for Analysis and Prediction of Storms University of Oklahoma mxue@ou. edu February 2008
Outline of Talk n n n LES-resolution simulation of supercell tornado Prediction of real tornados with radar data assimilation Sensitivity of tornado prediction to microphysics
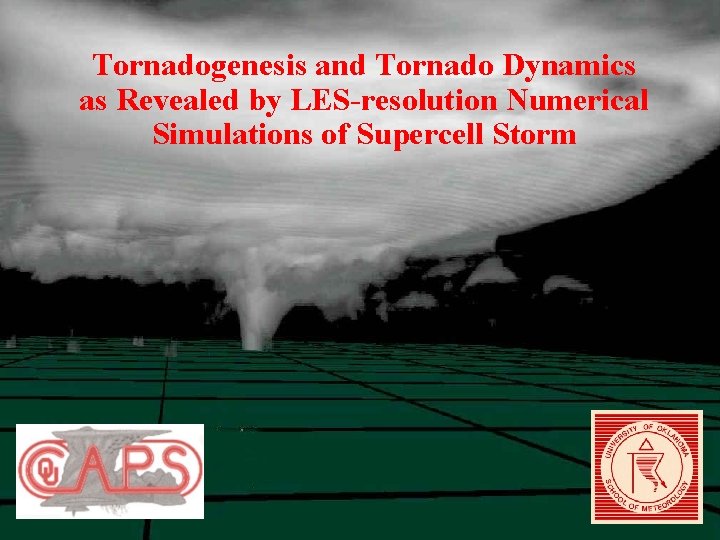
Tornadogenesis and Tornado Dynamics as Revealed by LES-resolution Numerical Simulations of Supercell Storm
Numerical Simulation of Supercell Tornado using up to 12. 5 m Grid Spacing n Using the Advanced Regional Prediction System (ARPS, Xue et al 2000, 2001, 2003) of CAPS n 1977 Del City, OK sounding (~3300 J/kg CAPE) n 2000 x 83 point uniform resolution covering 50 x 50 km 2. n Dx = 25 m, Dzmin = 20 m, dt = 0. 125 s. n Dx = 12. 5 m in a 20 x 20 km subdomain, dt = 0. 05 s. n Warmrain microphysics with surface friction at the later stage n Simulations up to 5 hours n Using 2048 Alpha Processors at Pittsburgh Supercomputing Center n 60 TB of data generated by one 25 m simulation over 30 minutes, output at 1 second intervals
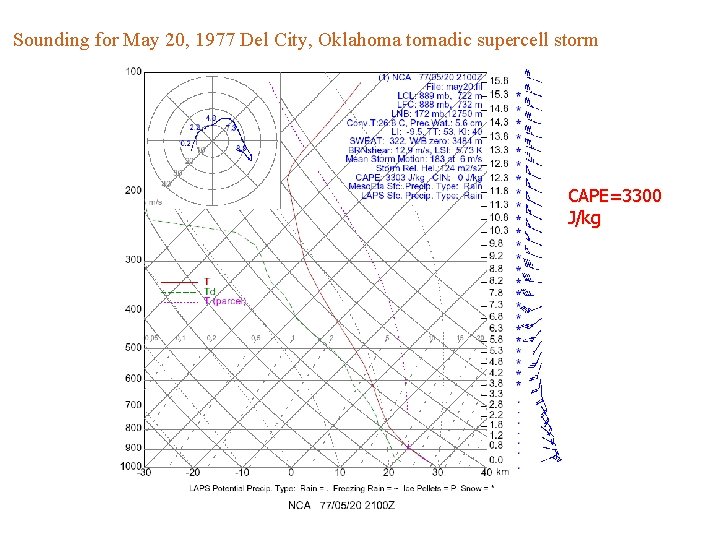
Sounding for May 20, 1977 Del City, Oklahoma tornadic supercell storm CAPE=3300 J/kg
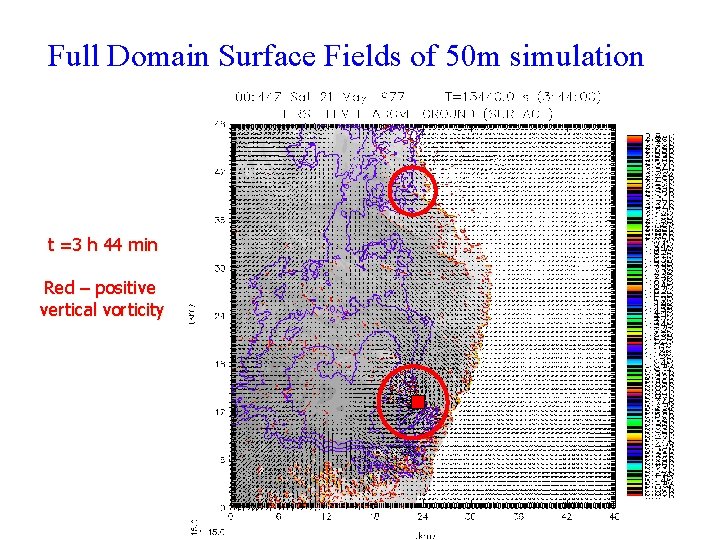
Full Domain Surface Fields of 50 m simulation t =3 h 44 min Red – positive vertical vorticity
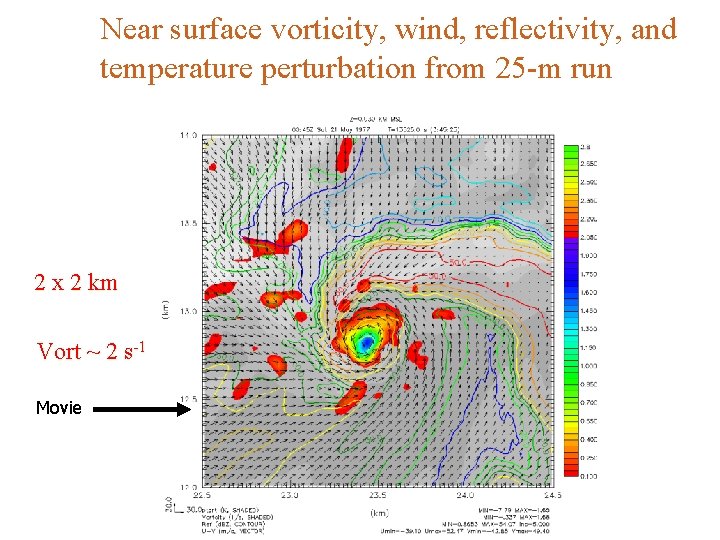
Near surface vorticity, wind, reflectivity, and temperature perturbation from 25 -m run 2 x 2 km Vort ~ 2 s-1 Movie
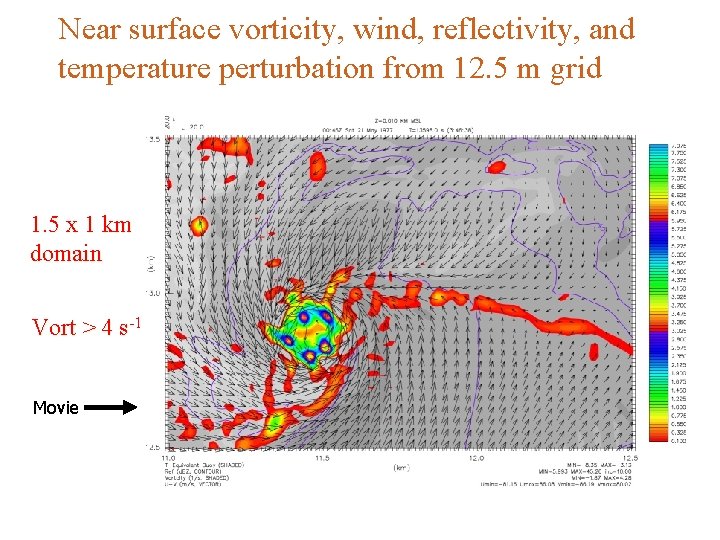
Near surface vorticity, wind, reflectivity, and temperature perturbation from 12. 5 m grid 1. 5 x 1 km domain Vort > 4 s-1 Movie
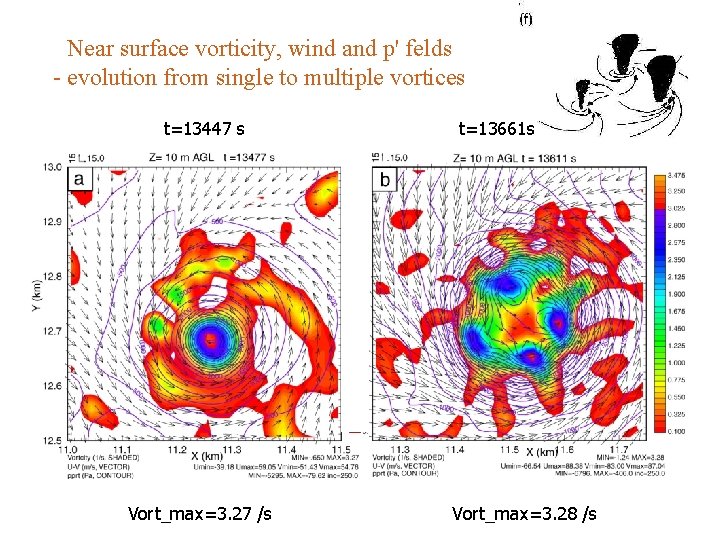
Near surface vorticity, wind and p' felds - evolution from single to multiple vortices t=13447 s Vort_max=3. 27 /s t=13661 s Vort_max=3. 28 /s
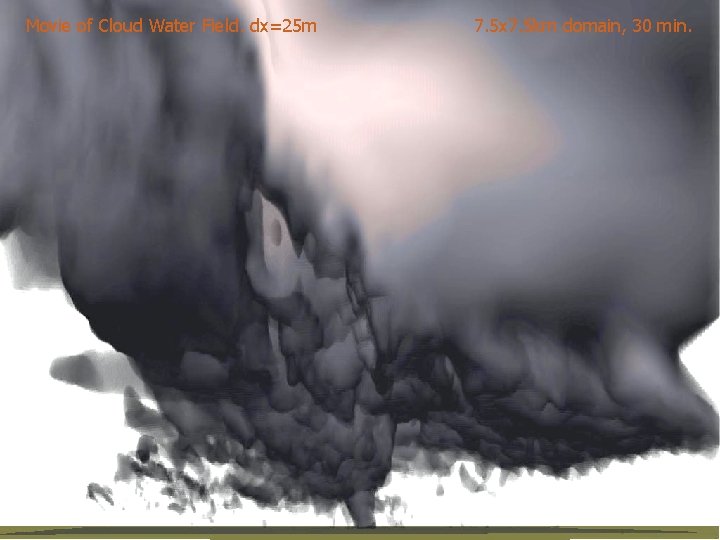
7. 5 x 7. 5 km domain, 30 min. Cloud Water Field 25 m, 7. 5 x 7. 5 km domain, 30 minutes Movie of Cloud Water Field. dx=25 m
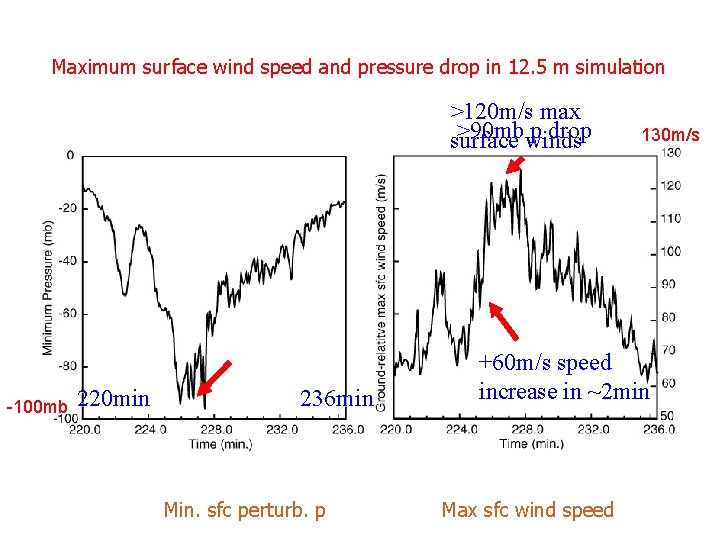
Maximum surface wind speed and pressure drop in 12. 5 m simulation >120 m/s max >90 mbwinds p drop surface -100 mb 220 min 236 min Min. sfc perturb. p 130 m/s +60 m/s speed increase in ~2 min Max sfc wind speed
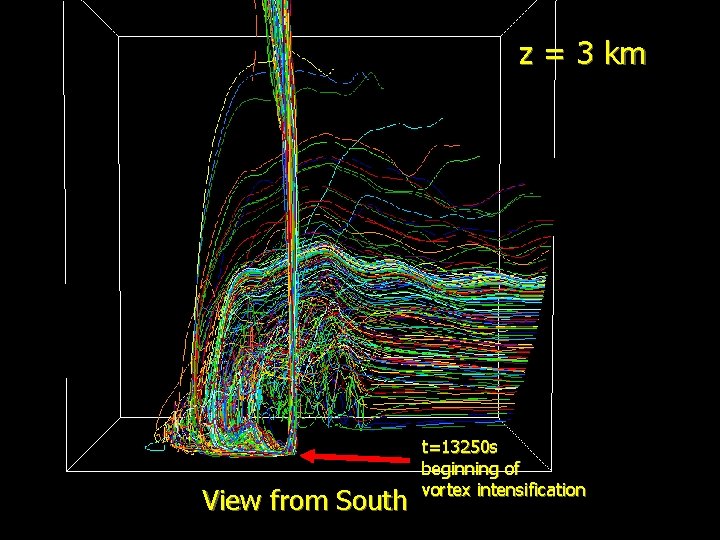
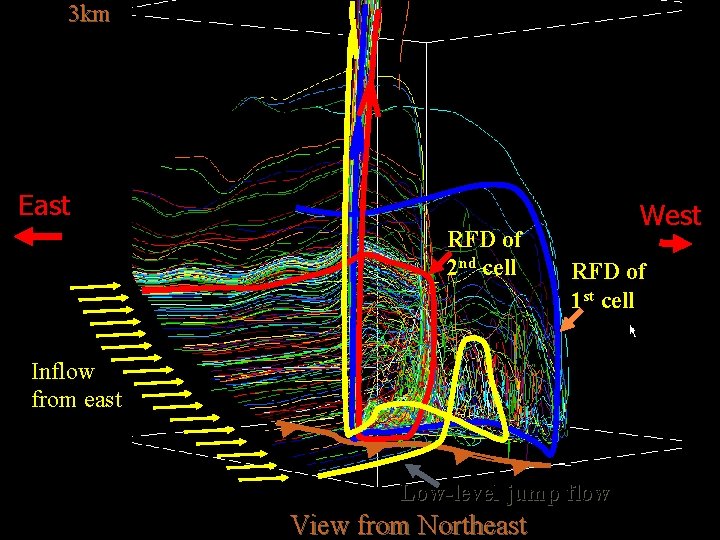
What is the main source of air parcel and vorticity feeding the tornado? Trajectory calculations based on 1 -s model output
z = 3 km View from South t=13250 s beginning of vortex intensification
3 km East RFD of 2 nd cell West RFD of 1 st cell Inflow from east Low-level jump flow View from Northeast
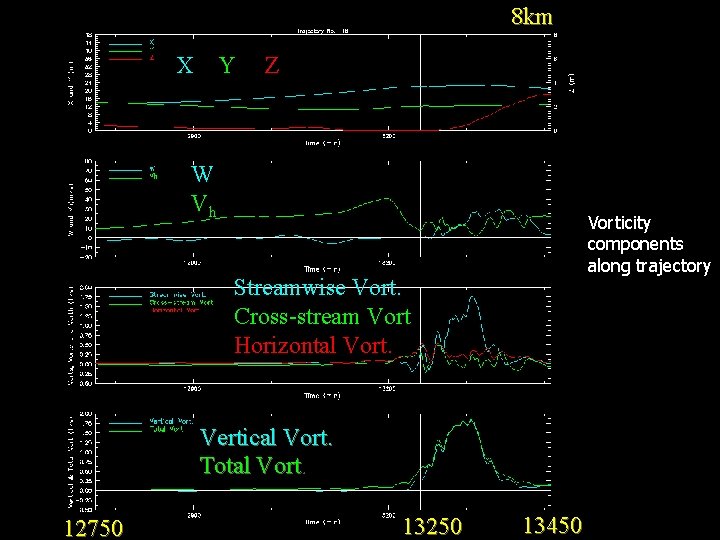
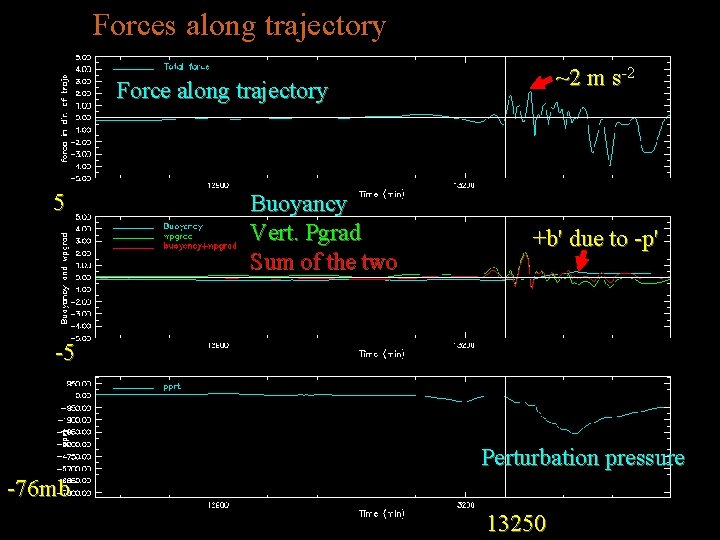
Diagnostics along Trajectories
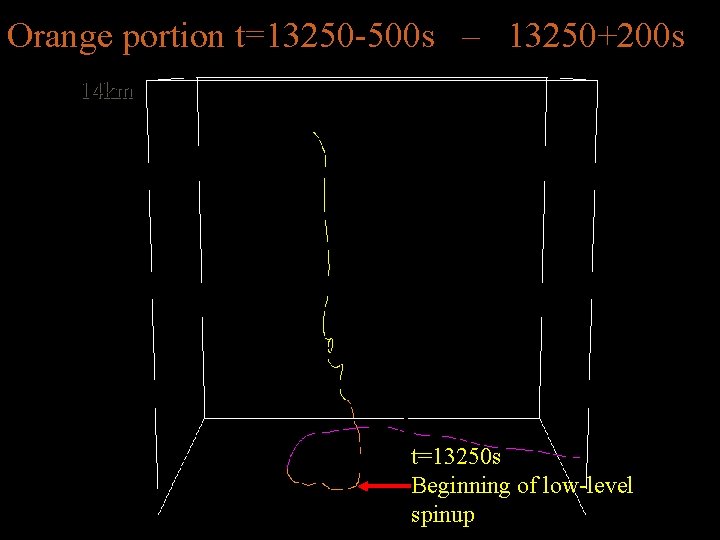
Orange portion t=13250 -500 s – 13250+200 s 14 km t=13250 s Beginning of low-level spinup
8 km X Y Z W Vh Vorticity components along trajectory Streamwise Vort. Cross-stream Vort. Horizontal Vort. Vertical Vort. Total Vort. 12750 13250 13450
Forces along trajectory ~2 m s-2 Force along trajectory 5 Buoyancy Vert. Pgrad Sum of the two +b' due to -p' -5 Perturbation pressure -76 mb 13250
Can we numerically predict real tornadoes?
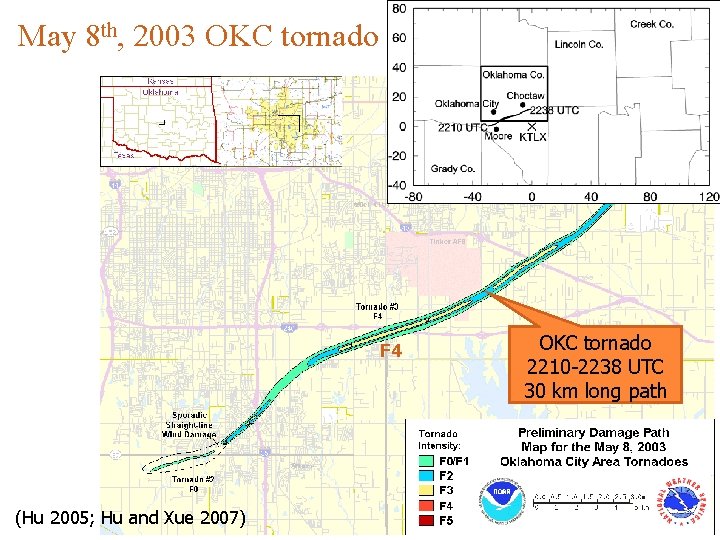
May 8 th, 2003 OKC tornado F 4 (Hu 2005; Hu and Xue 2007) OKC tornado 2210 -2238 UTC 30 km long path
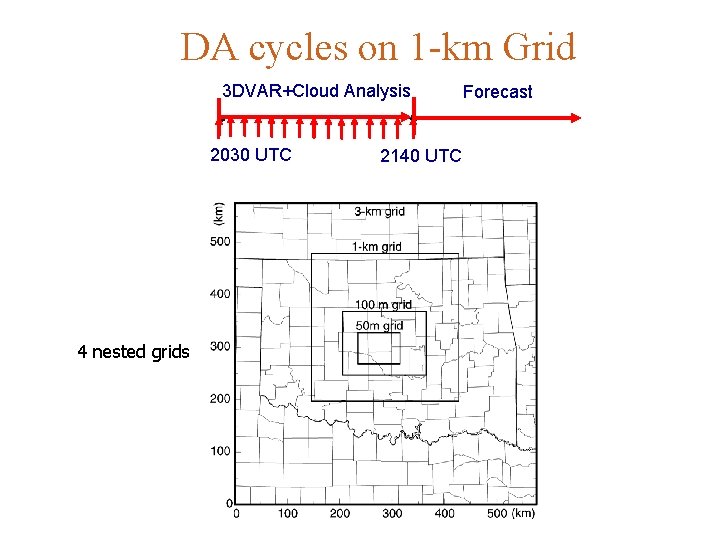
DA cycles on 1 -km Grid 3 DVAR+Cloud Analysis 2030 UTC 4 nested grids 2140 UTC Forecast
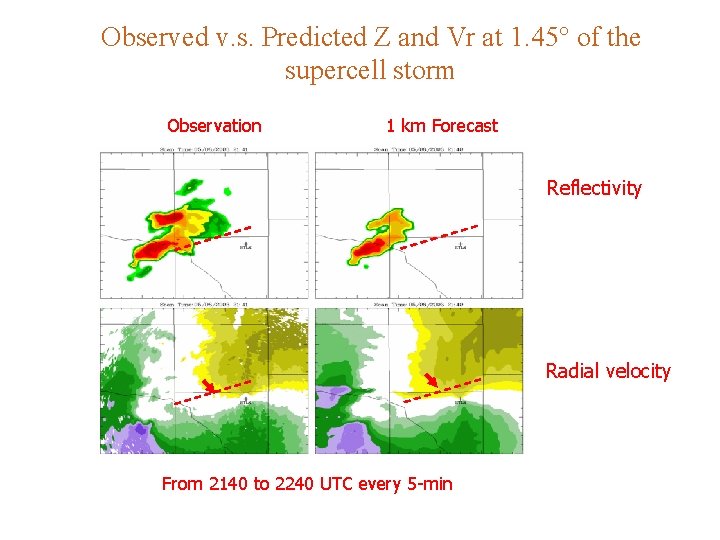
Observed v. s. Predicted Z and Vr at 1. 45° of the supercell storm Observation 1 km Forecast Reflectivity Radial velocity From 2140 to 2240 UTC every 5 -min
What about the prediction of embedded tornado?
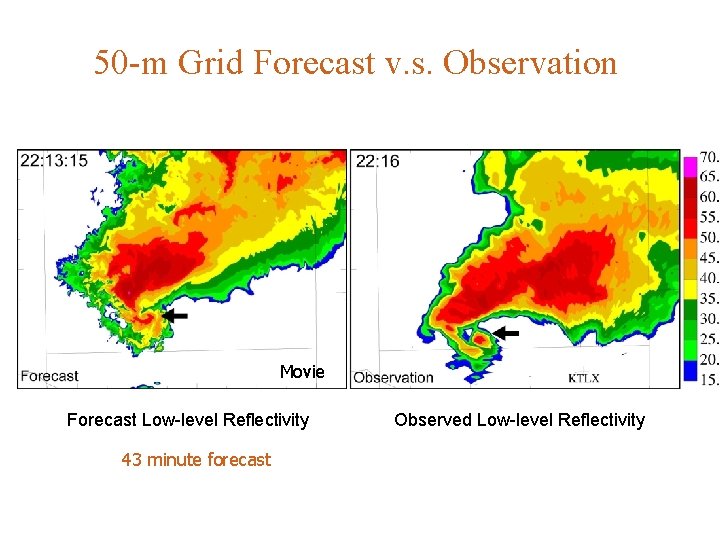
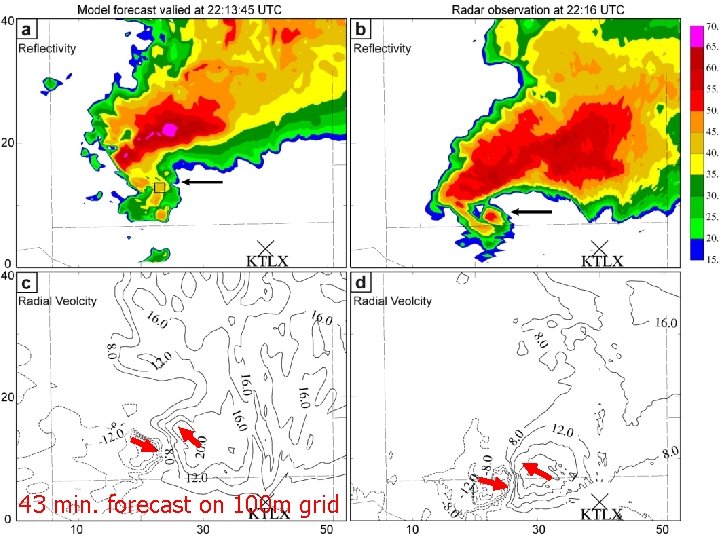
50 -m Grid Forecast v. s. Observation Movie Forecast Low-level Reflectivity 43 minute forecast Observed Low-level Reflectivity
50 -m Grid Forecast v. s. Observation Movie Forecast Low-level Reflectivity 43 minute forecast 43 min. forecast on 100 m grid Observed Low-level Reflectivity
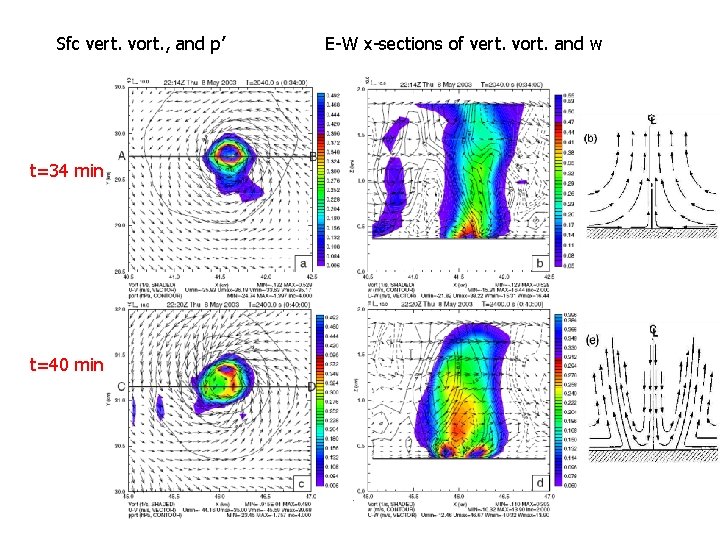
Sfc vert. vort. , and p’ t=34 min t=40 min E-W x-sections of vert. vort. and w
A case from CASA 2007 Spring Experiment CASA – an NSF ERC for Collaborative Adaptive Sensing of Atmosphere - Low cost, high density, adaptively scanning radars
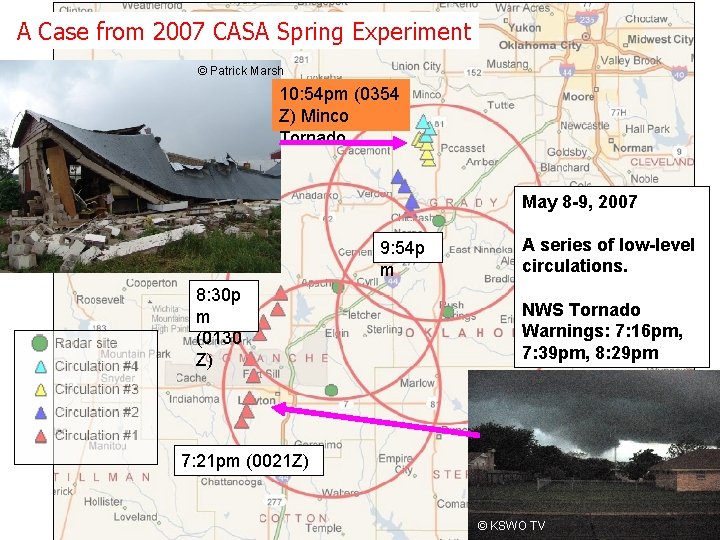
A Case from 2007 CASA Spring Experiment © Patrick Marsh 10: 54 pm (0354 Z) Minco Tornado May 8 -9, 2007 9: 54 p m 8: 30 p m (0130 Z) A series of low-level circulations. NWS Tornado Warnings: 7: 16 pm, 7: 39 pm, 8: 29 pm 7: 21 pm (0021 Z) © KSWO TV
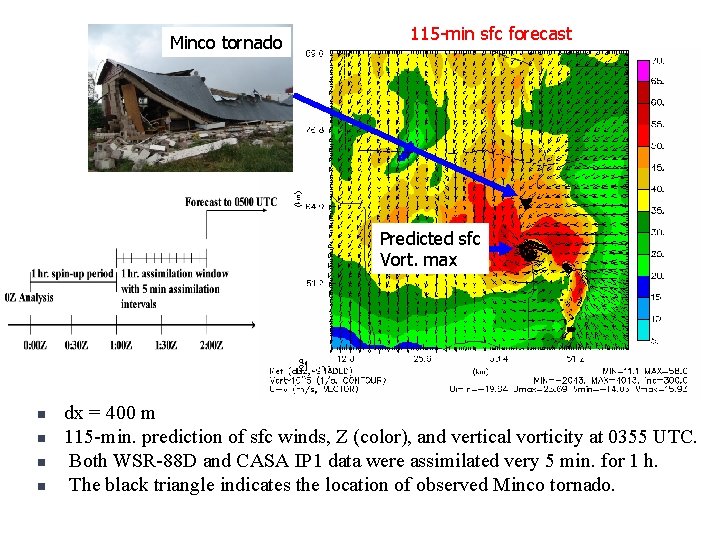
Minco tornado 115 -min sfc forecast Predicted sfc Vort. max n n dx = 400 m 115 -min. prediction of sfc winds, Z (color), and vertical vorticity at 0355 UTC. Both WSR-88 D and CASA IP 1 data were assimilated very 5 min. for 1 h. The black triangle indicates the location of observed Minco tornado.
Importance and/or Uncertainties of Microphysics? Daniel Dawson’s Poster Yesterday using multi-moment microphysics
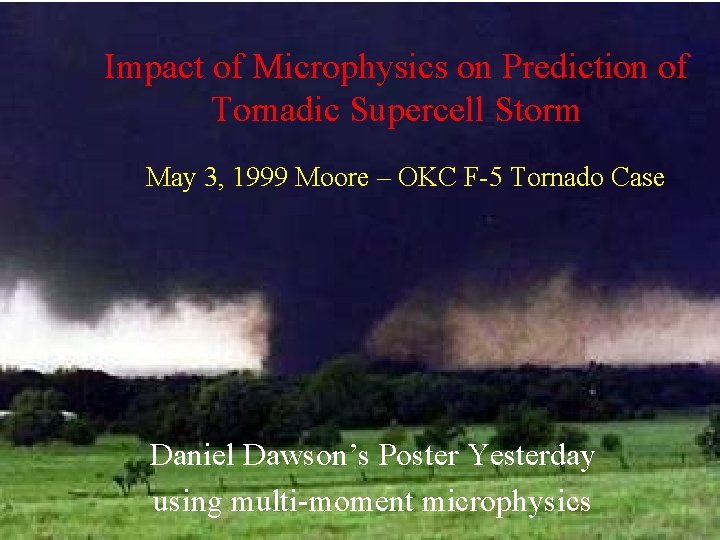
Impact of Microphysics on Prediction of Tornadic Supercell Storm May 3, 1999 Moore – OKC F-5 Tornado Case Daniel Dawson’s Poster Yesterday using multi-moment microphysics
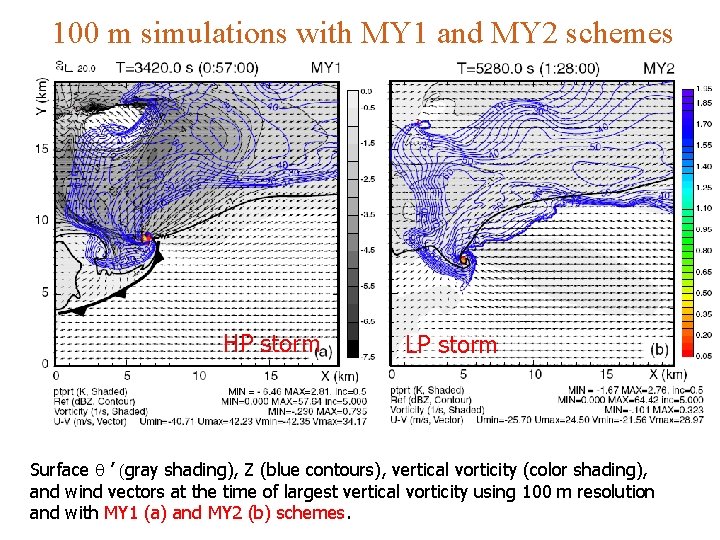
100 m simulations with MY 1 and MY 2 schemes HP storm LP storm Surface q ’ (gray shading), Z (blue contours), vertical vorticity (color shading), and wind vectors at the time of largest vertical vorticity using 100 m resolution and with MY 1 (a) and MY 2 (b) schemes.
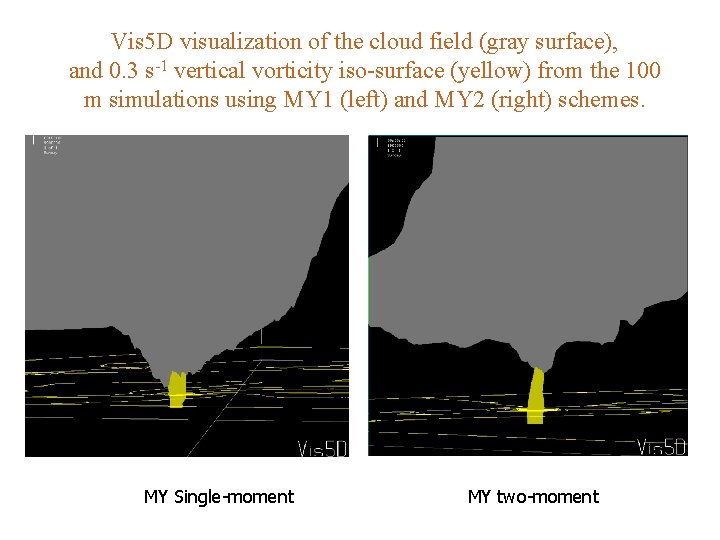
Vis 5 D visualization of the cloud field (gray surface), and 0. 3 s-1 vertical vorticity iso-surface (yellow) from the 100 m simulations using MY 1 (left) and MY 2 (right) schemes. MY Single-moment MY two-moment
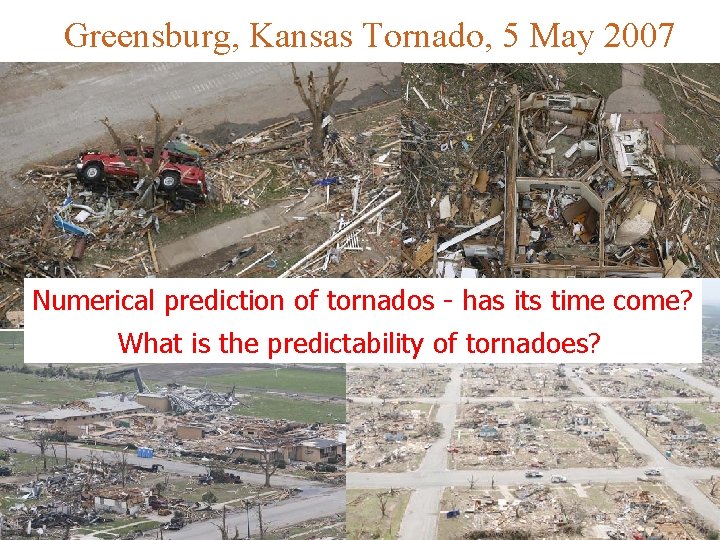
Greensburg, Kansas Tornado, 5 May 2007 Numerical prediction of tornados - has its time come? What is the predictability of tornadoes?