Needing a different space Transformed scales in Stata


- Slides: 50
Needing a different space? Transformed scales in Stata Nicholas J. Cox Department of Geography
Transformed scales? In teaching statistics and Stata I often have difficulty persuading people to think about working on transformed scales. That can mean (for example) using a transformed scale on a graph axis transforming variables for later analysis using a particular link function in a model. Whatever makes that thinking easier is welcome. 2
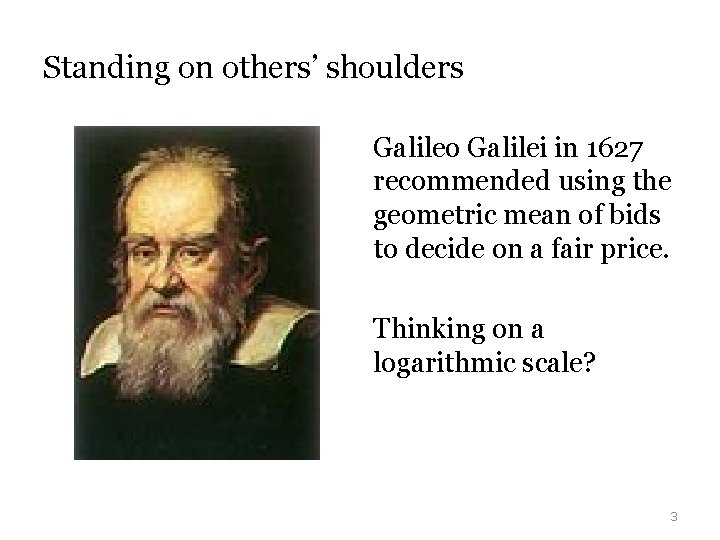
Standing on others’ shoulders Galileo Galilei in 1627 recommended using the geometric mean of bids to decide on a fair price. Thinking on a logarithmic scale? 3
In 1627 Galileo ‘was presented with an amiable dispute between a Florentine gentleman and a parish priest over the proper method to price a horse. . one bidder—undoubtedly the priest—had offered ten crowns and the other one thousand. In arriving at the proper value, the equestrians asked Galileo to be their arbiter. Was it better to employ an arithmetic or a geometric proportion in arriving at a fair price between divergent estimates? A geometric proportion was Galileo's answer. The real value of the horse was one hundred. ’ Reston, James. 1994. Galileo: A Life. New York: Harper. Collins, p. 218 4
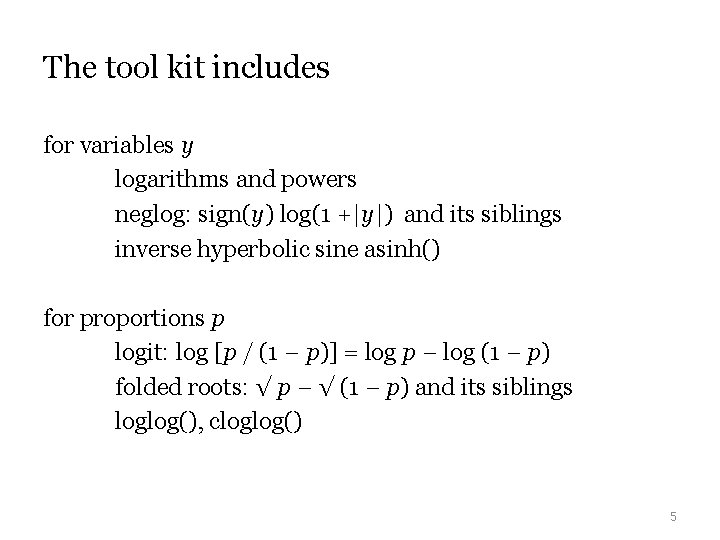
The tool kit includes for variables y logarithms and powers neglog: sign(y) log(1 +|y|) and its siblings inverse hyperbolic sine asinh() for proportions p logit: log [p / (1 − p)] = log p − log (1 − p) folded roots: √ p − √ (1 − p) and its siblings loglog(), cloglog() 5
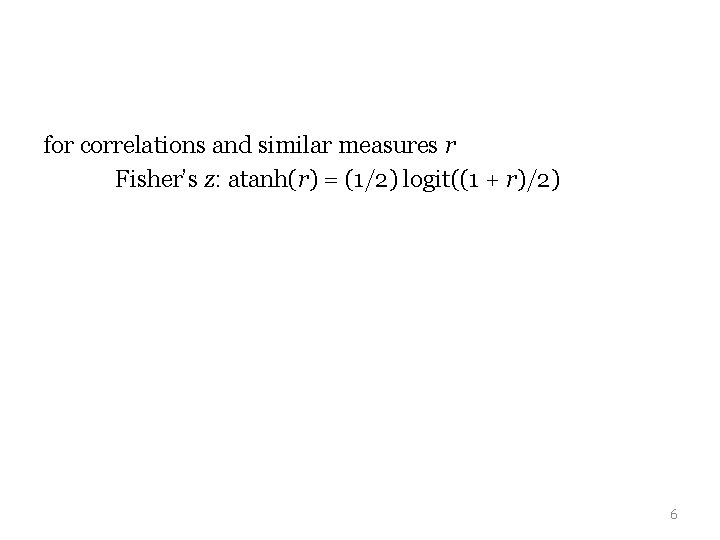
for correlations and similar measures r Fisher’s z: atanh(r) = (1/2) logit((1 + r)/2) 6
Some good references Tukey, J. W. 1957. On the comparative anatomy of transformations. Annals of Mathematical Statistics 28: 602— 632. https: //www. jstor. org/stable/2237224 Box, G. E. P. and Cox, D. R. 1964. An analysis of transformations. Journal of the Royal Statistical Society, Series B 26: 211 — 252. https: //www. jstor. org/stable/2984418 Keene, O. N. 1995. The log transformation is special Statistics in Medicine 14: 811— 819. 7
Why do we transform? Some goals (Grails) are linear relationships additive effects equal variability symmetric distribution (even normal distribution) The last goal is not the most important, as many researchers seem to think…. 8
Objections to transformation Objections – not always from those new to or naïve about statistics – include Transformation is troubling. Using an unfamiliar function just makes the analysis harder to think about. Transformation is tricky. How do we choose a transformation without seeming arbitrary or ad hoc? Transformation is treasonous. You are proposing changing the data. How is that allowed or even honest? 9
Theme and structure What makes use of a transformed scale – or choice of a transformed scale – easier to think about? (Easy and standard. ) People are always coming new to Stata, so a brisk survey of using transformed scales in graphics comes first. (Novel and in progress. ) I don’t like or use ladder, gladder or qladder. I will explain why and think aloud about what might work better. 10
Logarithmic axis scales Graph commands in most cases allow yscale(log) and xscale(log) as option choices. Limitation: This does not always give what you really want. For example, with histograms and box plots, working on logarithmic scale requires a fresh calculation. Limitation: graph does not typically make good default choices of axis labels with a logarithmic scale. If you are new to Stata, this may be the most valuable slide in the talk. 11
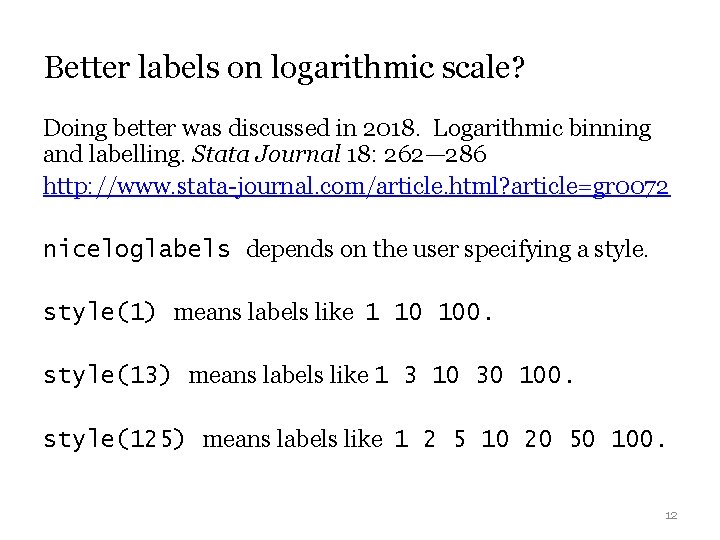
Better labels on logarithmic scale? Doing better was discussed in 2018. Logarithmic binning and labelling. Stata Journal 18: 262— 286 http: //www. stata-journal. com/article. html? article=gr 0072 niceloglabels depends on the user specifying a style(1) means labels like 1 10 100. style(13) means labels like 1 3 10 30 100. style(125) means labels like 1 2 5 10 20 50 100. 12
More generally Using other transformed scales (e. g. root, logit) divides into which numbers to use on transformed scale? which axis labels to show values on original scale? 2008. Plotting on any transformed scale. Stata Journal 8: 142— 145. https: //www. statajournal. com/article. html? article=gr 0032 ssc install mylabels 13
ladder, gladder, qladder These are official commands of some vintage. ladder and gladder were added to Stata in 1992. qladder was added to Stata in 2000. Does anybody use them much? A sample script follows. 14
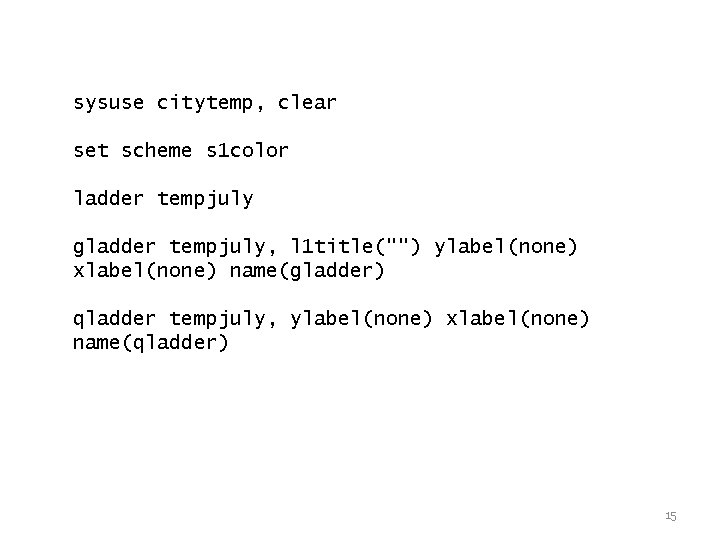
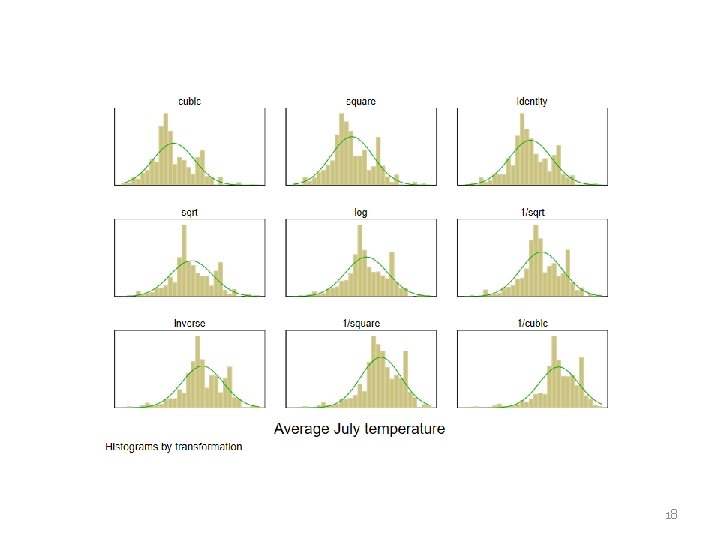
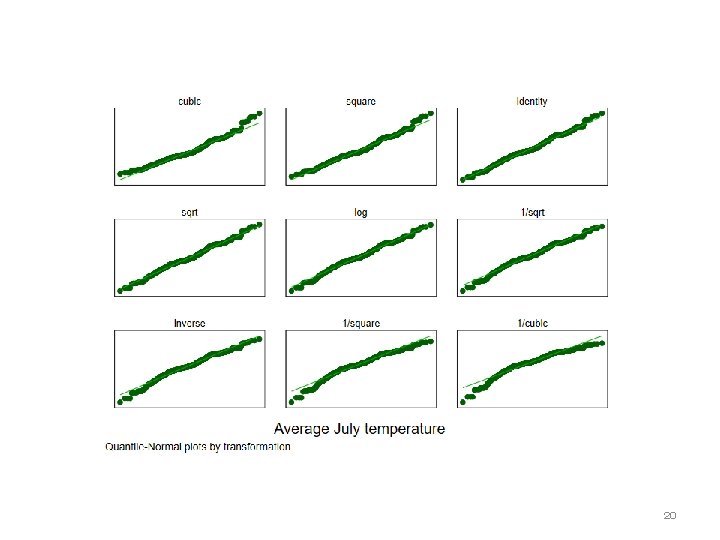
sysuse citytemp, clear set scheme s 1 color ladder tempjuly gladder tempjuly, l 1 title("") ylabel(none) xlabel(none) name(gladder) qladder tempjuly, ylabel(none) xlabel(none) name(qladder) 15
ladder This command bins transformed data and does a chi-square test for normality. If you want such a test, other tests are surely better, e. g. Shapiro-Wilk, Doornik-Hansen. Such a test often answers the wrong question. For moderate or large sample sizes, it may merely detect trivial departures from normality. For small sample sizes, it may indicate that you don’t have enough data. 16
gladder This command transforms data and shows histograms with comparable normal distributions superimposed. 17
18
qladder This command transforms data and shows normal quantile plots with comparable normal distributions as reference lines. (a. k. a. normal probability plots, normal scores plots, probit plots) 19
20
What is wrong These commands offer too many transformations. It should never be true that all the transformations from cube to reciprocal cube are serious candidates. These commands offer too few transformations. No support for cube root, neglog, asinh, logit, folded roots or anything not on the menu. Histograms are poor for choosing a transformation. The examples are poor. Fahrenheit temperatures are interval scale variables. 21
One variable at a time. Often you want to compare two or more variables. No support for group comparisons. Often you want to compare two or more groups. 22
To be fair The ladder idea is powerful (power full!) and persuasive. Many transformations lie on a ladder (J. W. Tukey): hence choose that best suited to the data (identity? ) Bivariate and multivariate transformations are another problem. Stata offers programmability to craft your own alternatives. The second law of programming: If you don’t like my program, feel free to write your own. 23
What is right Loop: candidate transformations temporary variables with transforms graph for each candidate Combine graphs and so show a portfolio. 24
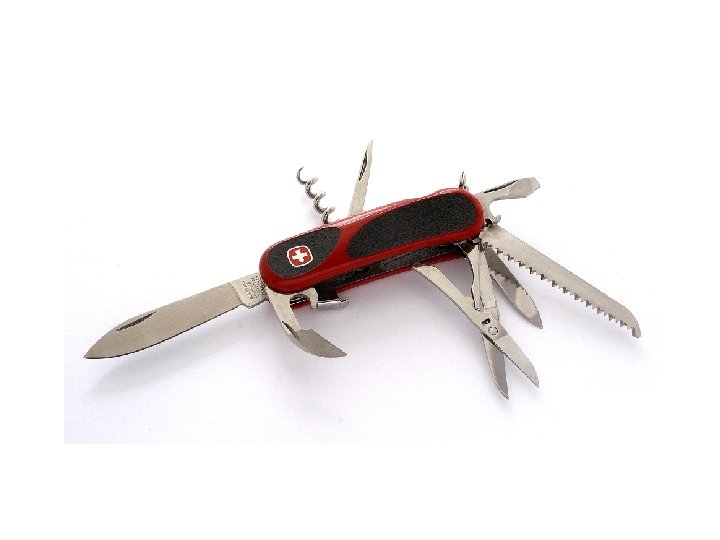
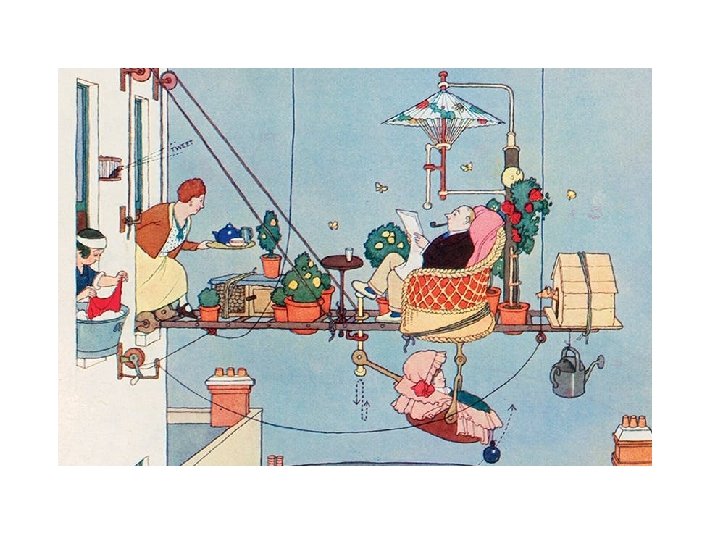
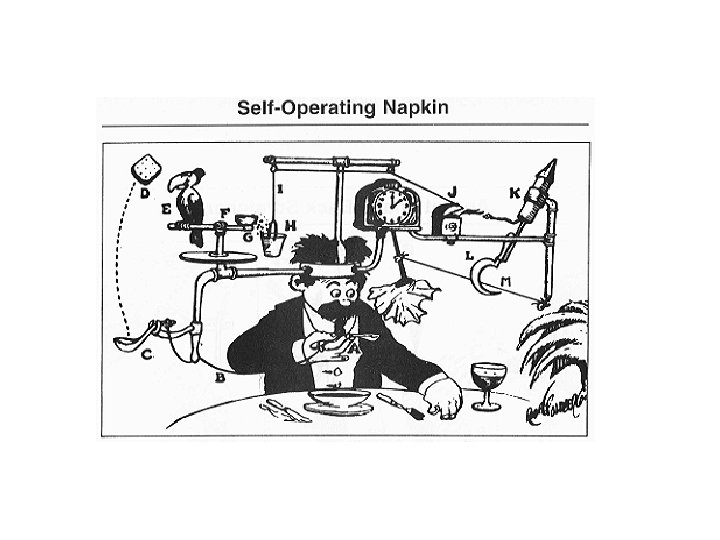
Command design means thinking through the design carefully before you write any code. That can be hard…. Commands can suffer from option creep and other conditions of complexity. The syntax becomes Baroque if not rococo, and at most only the programmer understands the command. What the programmer thinks of as a handy Swiss army knife…
might be just a Heath Robinson machine… William Heath Robinson 1872— 1944
or a Rube Goldberg machine … Reuben Garrett Lucius Goldberg (1883 – 1970)
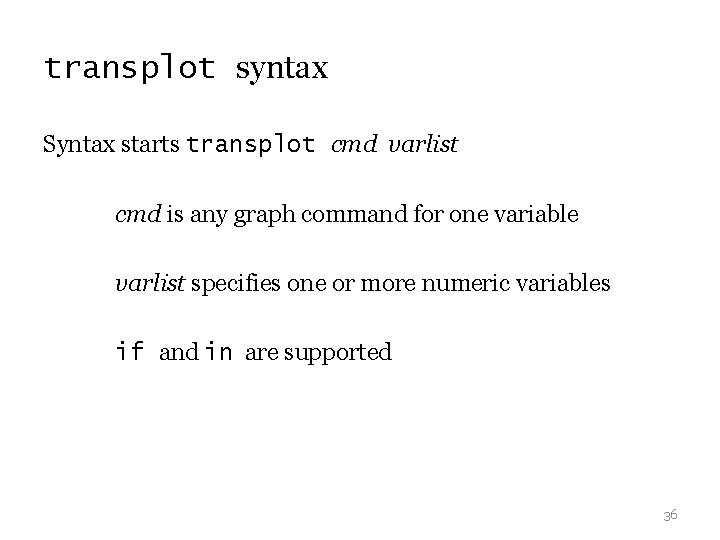
transplot Work in progress… Oneway and twoway modes are supported. 31
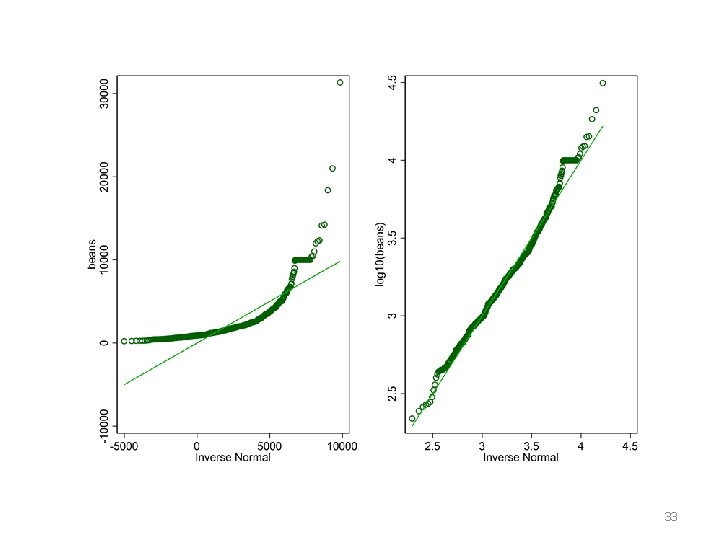
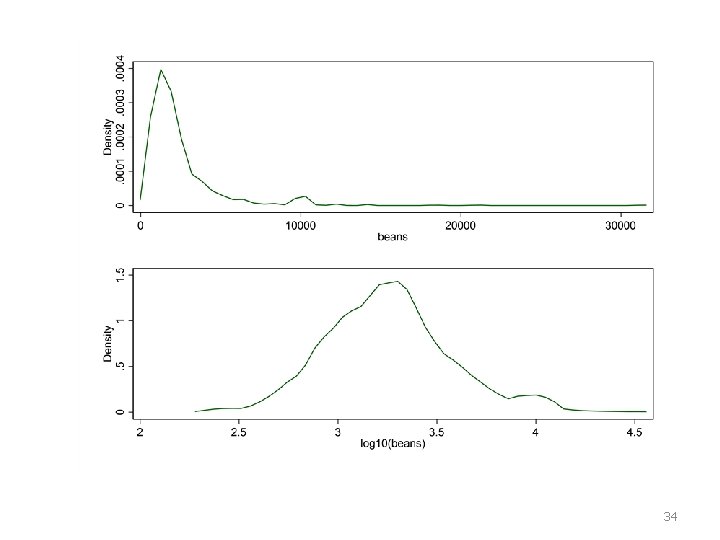
Oneway mode This mode is illustrated by transplot qnorm beans, trans(@ log 10) ms(Oh) transplot kdensity beans, trans(@ log 10) combine(col(1)) 32
33
34
Beans? ? ? Spiegelhalter, D. 2019. The Art of Statistics: Learning from Data. London: Penguin includes an example with guesses on how many jelly beans are in a jar. The data tell you more about guessing than about jelly beans, but that is fine. The dataset can be found on Git. Hub. 35
transplot syntax Syntax starts transplot cmd varlist cmd is any graph command for one variable varlist specifies one or more numeric variables if and in are supported 36
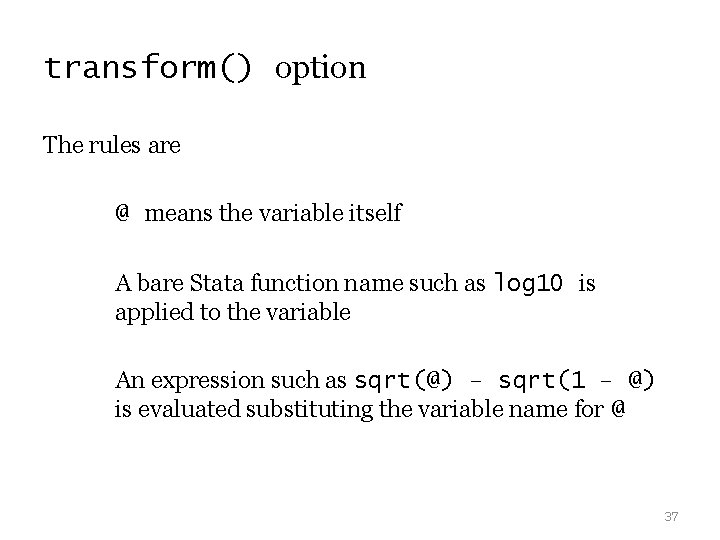
transform() option The rules are @ means the variable itself A bare Stata function name such as log 10 is applied to the variable An expression such as sqrt(@) – sqrt(1 – @) is evaluated substituting the variable name for @ 37
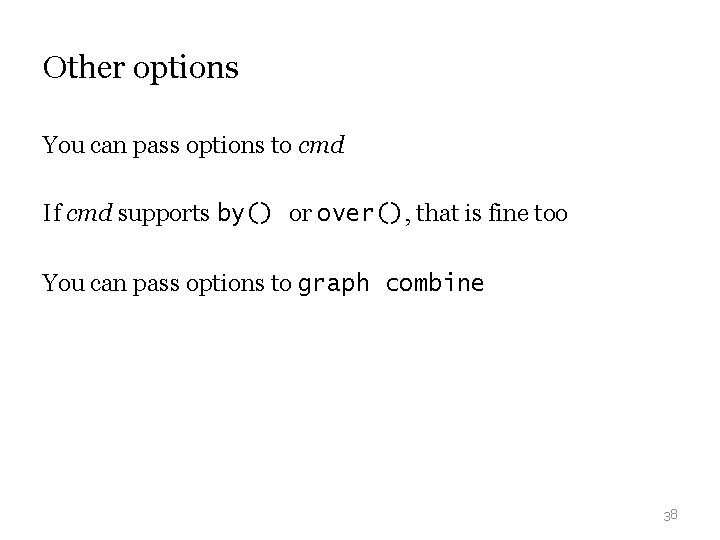
Other options You can pass options to cmd If cmd supports by() or over(), that is fine too You can pass options to graph combine 38
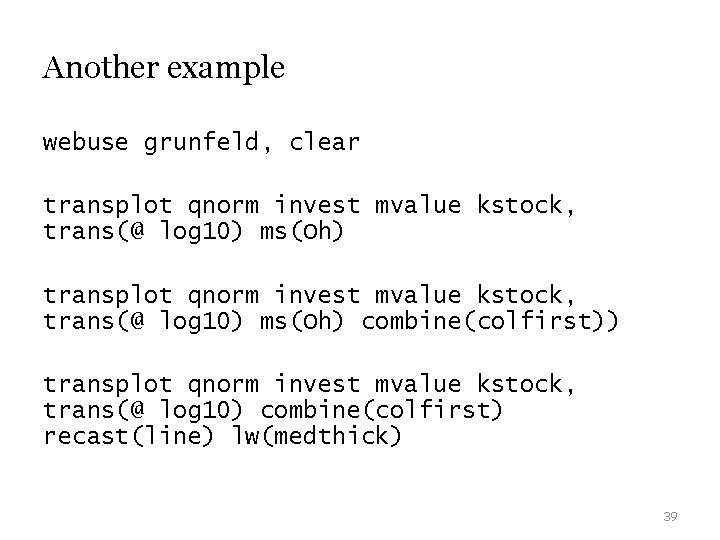
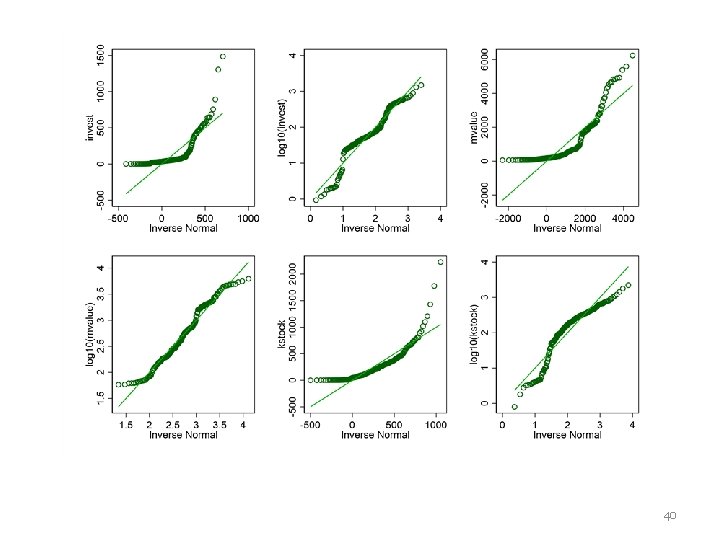
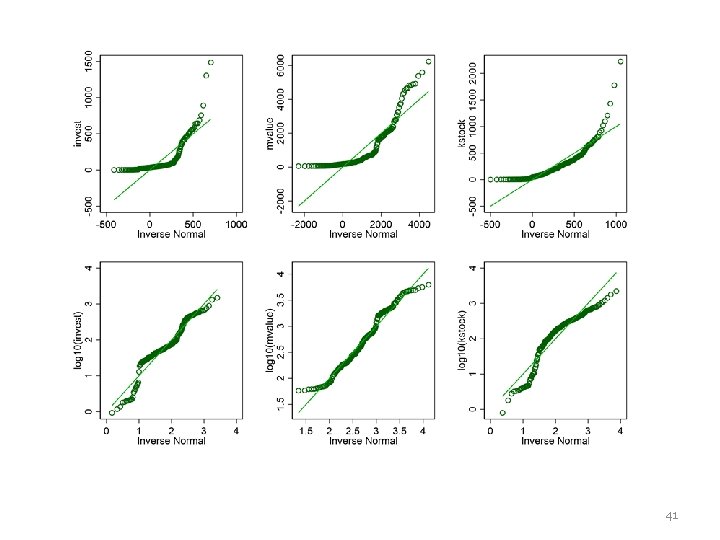
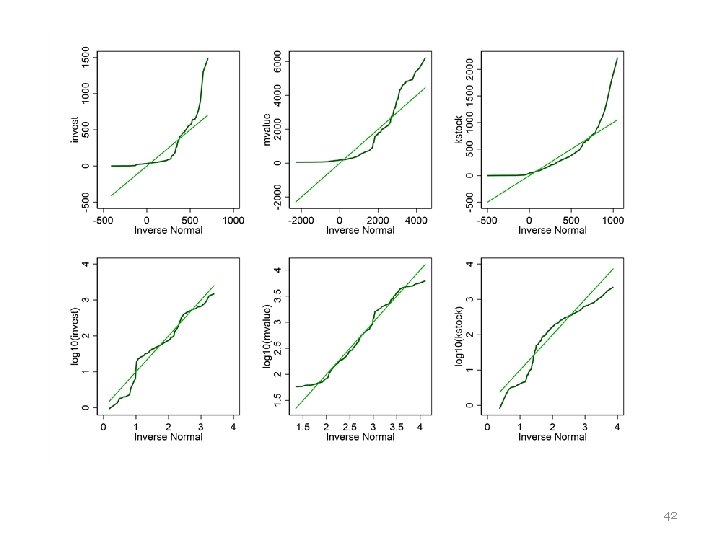
Another example webuse grunfeld, clear transplot qnorm invest mvalue kstock, trans(@ log 10) ms(Oh) combine(colfirst)) transplot qnorm invest mvalue kstock, trans(@ log 10) combine(colfirst) recast(line) lw(medthick) 39
40
41
42
qplot The official command qnorm works fine in these examples, but qplot is much more flexible. 1999. Quantile plots, generalized. Stata Technical Bulletin 51: 16— 18. 2005. The protean quantile plot. Stata Journal 5: 442— 460. 2019. Software Update: Quantile plots, generalized. Stata Journal 19: in press 43
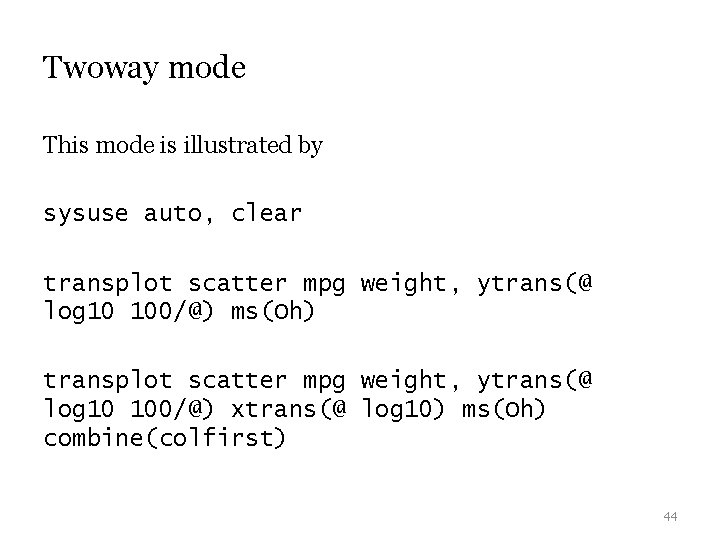
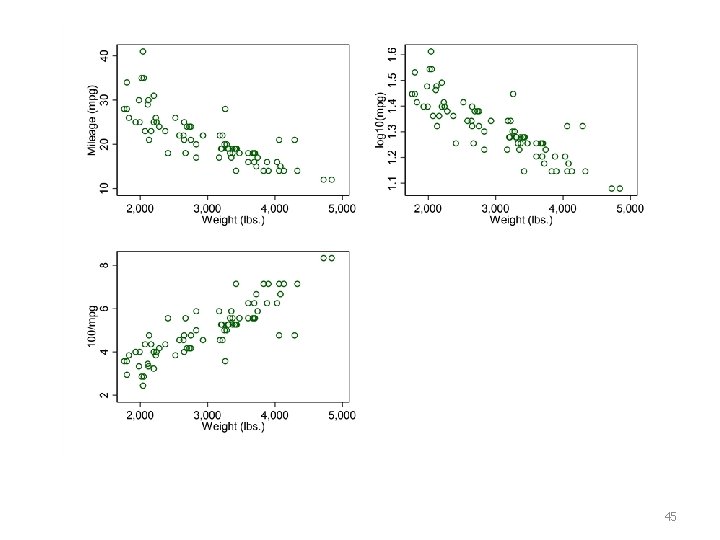
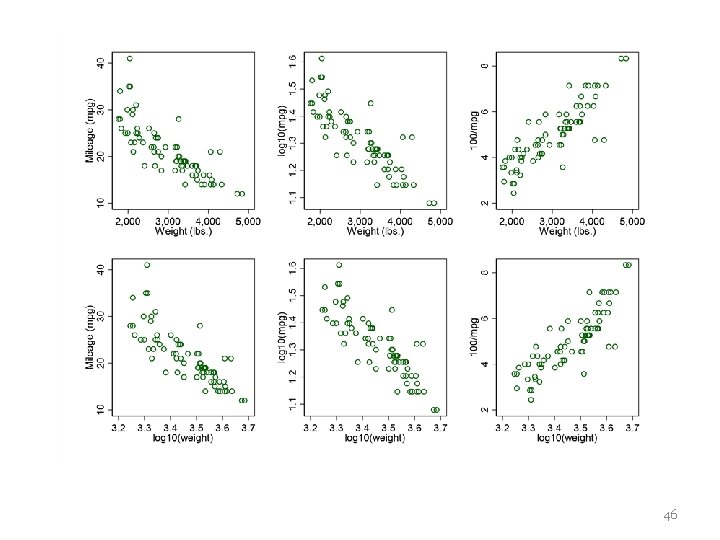
Twoway mode This mode is illustrated by sysuse auto, clear transplot scatter mpg weight, ytrans(@ log 10 100/@) ms(Oh) transplot scatter mpg weight, ytrans(@ log 10 100/@) xtrans(@ log 10) ms(Oh) combine(colfirst) 44
45
46
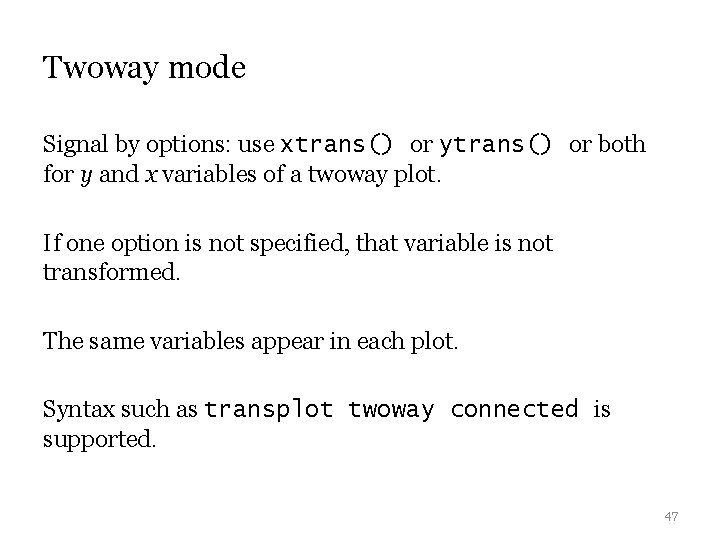
Twoway mode Signal by options: use xtrans() or ytrans() or both for y and x variables of a twoway plot. If one option is not specified, that variable is not transformed. The same variables appear in each plot. Syntax such as transplot twoway connected is supported. 47
In practice transplot allows you to draw many graphs, but comparison may be difficult with more than a chosen few. It doesn’t try to be smart about axis labels for transformed scales. transplot is for exploratory analysis, not modelling. 48
49
All graphs use Stata scheme s 1 color, which I strongly recommend as a lazy but good default. This font is Georgia. This font is Lucida Console. 50