NATIONAL CONFERENCE ON AGRICULTURE ZAID SUMMER CAMPAIGN 2019


- Slides: 43
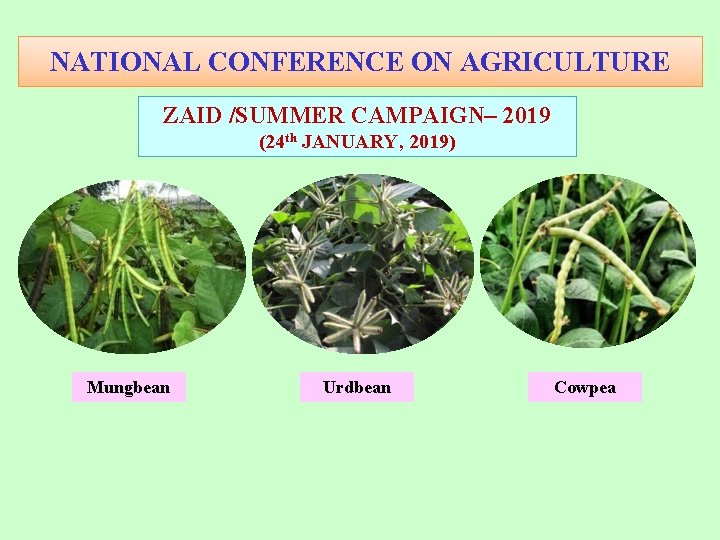
NATIONAL CONFERENCE ON AGRICULTURE ZAID /SUMMER CAMPAIGN– 2019 (24 th JANUARY, 2019) Mungbean Urdbean Cowpea
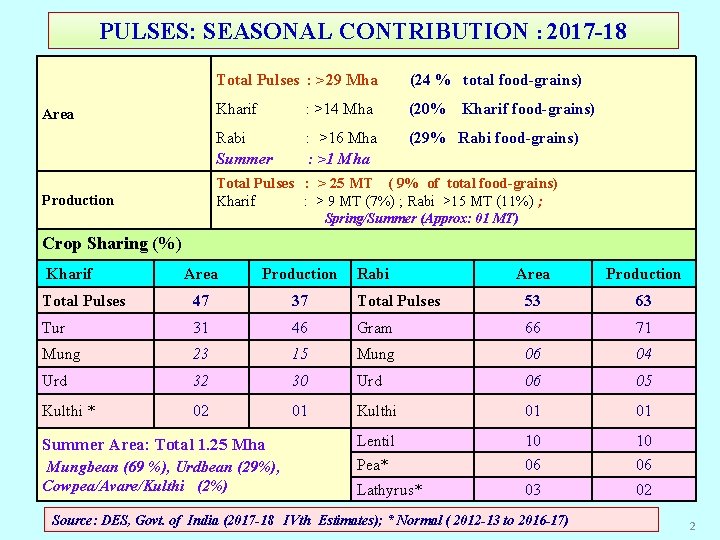
PULSES: SEASONAL CONTRIBUTION : 2017 -18 Total Pulses : >29 Mha (24 % total food-grains) Kharif : >14 Mha (20% Kharif food-grains) Area Rabi : >16 Mha (29% Rabi food-grains) Summer : >1 Mha Total Pulses : > 25 MT ( 9% of total food-grains) Kharif : > 9 MT (7%) ; Rabi >15 MT (11%) ; Production Spring/Summer (Approx: 01 MT) Crop Sharing (%) Kharif Area Production Total Pulses 47 37 Tur 31 Mung Rabi Area Production Total Pulses 53 63 46 Gram 66 71 23 15 Mung 06 04 Urd 32 30 Urd 06 05 Kulthi * 02 01 Kulthi 01 01 Summer Area: Total 1. 25 Mha Lentil 10 10 Mungbean (69 %), Urdbean (29%), Cowpea/Avare/Kulthi (2%) Pea* 06 06 Lathyrus* 03 02 Source: DES, Govt. of India (2017 -18 IVth Estimates); * Normal ( 2012 -13 to 2016 -17) 2
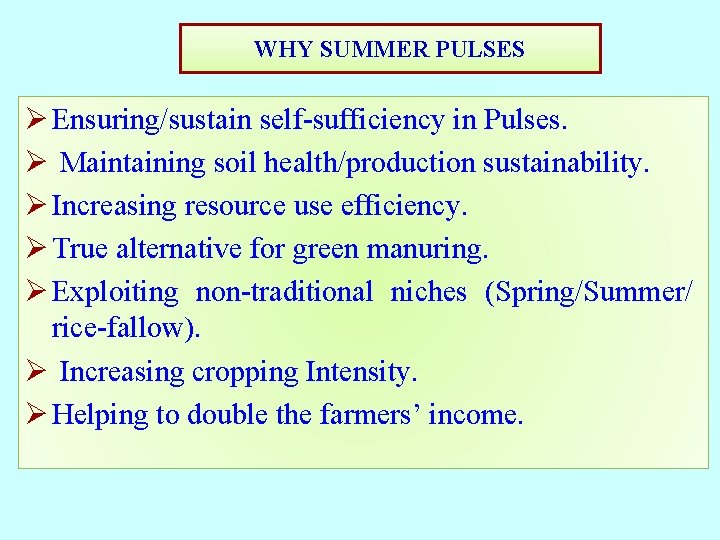
WHY SUMMER PULSES Ø Ensuring/sustain self-sufficiency in Pulses. Ø Maintaining soil health/production sustainability. Ø Increasing resource use efficiency. Ø True alternative for green manuring. Ø Exploiting non-traditional niches (Spring/Summer/ rice-fallow). Ø Increasing cropping Intensity. Ø Helping to double the farmers’ income.
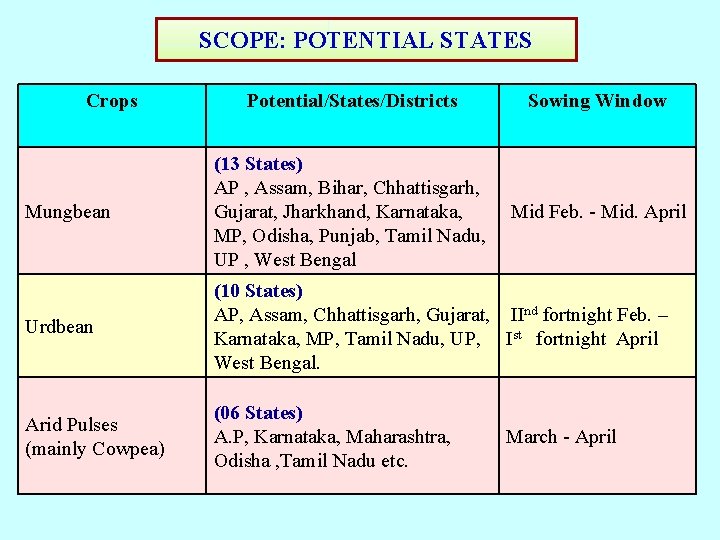
SCOPE: POTENTIAL STATES Crops Potential/States/Districts Sowing Window Mungbean (13 States) AP , Assam, Bihar, Chhattisgarh, Gujarat, Jharkhand, Karnataka, Mid Feb. - Mid. April MP, Odisha, Punjab, Tamil Nadu, UP , West Bengal Urdbean (10 States) AP, Assam, Chhattisgarh, Gujarat, IInd fortnight Feb. – Karnataka, MP, Tamil Nadu, UP, Ist fortnight April West Bengal. Arid Pulses (mainly Cowpea) (06 States) A. P, Karnataka, Maharashtra, Odisha , Tamil Nadu etc. March - April
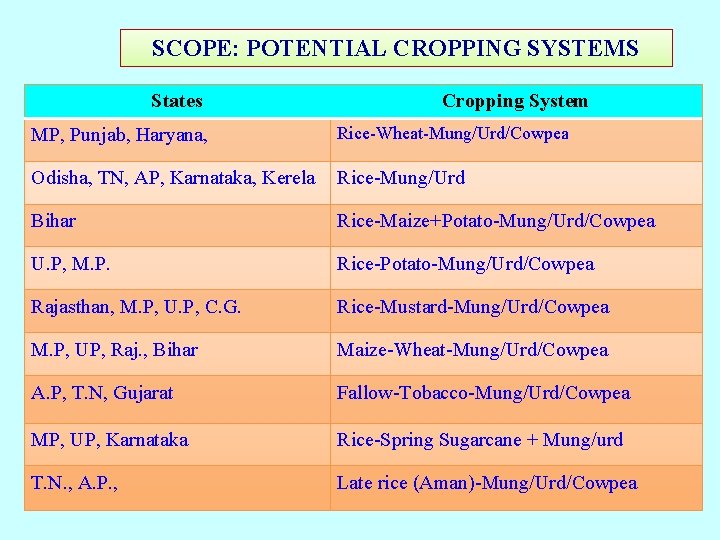
SCOPE: POTENTIAL CROPPING SYSTEMS States Cropping System MP, Punjab, Haryana, Rice-Wheat-Mung/Urd/Cowpea Odisha, TN, AP, Karnataka, Kerela Rice-Mung/Urd Bihar Rice-Maize+Potato-Mung/Urd/Cowpea U. P, M. P. Rice-Potato-Mung/Urd/Cowpea Rajasthan, M. P, U. P, C. G. Rice-Mustard-Mung/Urd/Cowpea M. P, UP, Raj. , Bihar Maize-Wheat-Mung/Urd/Cowpea A. P, T. N, Gujarat Fallow-Tobacco-Mung/Urd/Cowpea MP, UP, Karnataka Rice-Spring Sugarcane + Mung/urd T. N. , A. P. , Late rice (Aman)-Mung/Urd/Cowpea
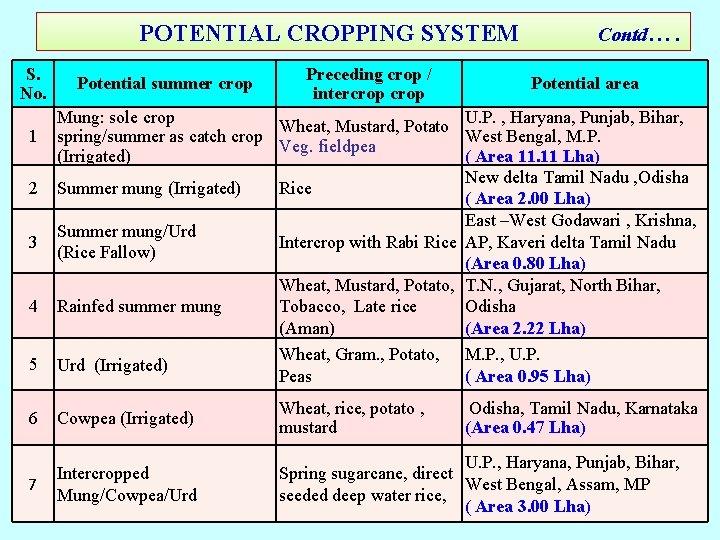
POTENTIAL CROPPING SYSTEM Contd…. S. No. 1 2 3 4 5 Potential summer crop Preceding crop / intercrop Potential area Mung: sole crop U. P. , Haryana, Punjab, Bihar, Wheat, Mustard, Potato spring/summer as catch crop West Bengal, M. P. Veg. fieldpea (Irrigated) ( Area 11. 11 Lha) New delta Tamil Nadu , Odisha Summer mung (Irrigated) Rice ( Area 2. 00 Lha) East –West Godawari , Krishna, Summer mung/Urd Intercrop with Rabi Rice AP, Kaveri delta Tamil Nadu (Rice Fallow) (Area 0. 80 Lha) Wheat, Mustard, Potato, T. N. , Gujarat, North Bihar, Tobacco, Late rice Odisha Rainfed summer mung (Aman) (Area 2. 22 Lha) Wheat, Gram. , Potato, M. P. , U. P. Urd (Irrigated) Peas ( Area 0. 95 Lha) 6 Cowpea (Irrigated) Wheat, rice, potato , mustard Odisha, Tamil Nadu, Karnataka (Area 0. 47 Lha) 7 Intercropped Mung/Cowpea/Urd U. P. , Haryana, Punjab, Bihar, Spring sugarcane, direct West Bengal, Assam, MP seeded deep water rice, ( Area 3. 00 Lha)
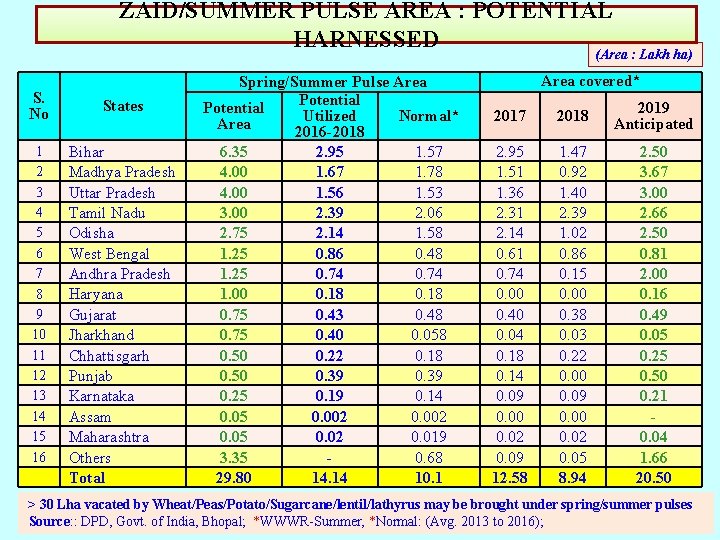
ZAID/SUMMER PULSE AREA : POTENTIAL HARNESSED (Area : Lakh ha) S. No 1 2 3 4 5 6 7 8 9 10 11 12 13 14 15 16 States Bihar Madhya Pradesh Uttar Pradesh Tamil Nadu Odisha West Bengal Andhra Pradesh Haryana Gujarat Jharkhand Chhattisgarh Punjab Karnataka Assam Maharashtra Others Total Spring/Summer Pulse Area Potential Utilized Normal* Area 2016 -2018 6. 35 4. 00 3. 00 2. 75 1. 25 1. 00 0. 75 0. 50 0. 25 0. 05 3. 35 29. 80 2. 95 1. 67 1. 56 2. 39 2. 14 0. 86 0. 74 0. 18 0. 43 0. 40 0. 22 0. 39 0. 19 0. 002 0. 02 - 14. 14 1. 57 1. 78 1. 53 2. 06 1. 58 0. 48 0. 74 0. 18 0. 48 0. 058 0. 18 0. 39 0. 14 0. 002 0. 019 0. 68 10. 1 Area covered* 2017 2018 2019 Anticipated 2. 95 1. 51 1. 36 2. 31 2. 14 0. 61 0. 74 0. 00 0. 40 0. 04 0. 18 0. 14 0. 09 0. 00 0. 02 0. 09 12. 58 1. 47 0. 92 1. 40 2. 39 1. 02 0. 86 0. 15 0. 00 0. 38 0. 03 0. 22 0. 00 0. 09 0. 00 0. 02 0. 05 8. 94 2. 50 3. 67 3. 00 2. 66 2. 50 0. 81 2. 00 0. 16 0. 49 0. 05 0. 25 0. 50 0. 21 - 0. 04 1. 66 20. 50 > 30 Lha vacated by Wheat/Peas/Potato/Sugarcane/lentil/lathyrus may be brought under spring/summer pulses Source: : DPD, Govt. of India, Bhopal; *WWWR-Summer, *Normal: (Avg. 2013 to 2016);
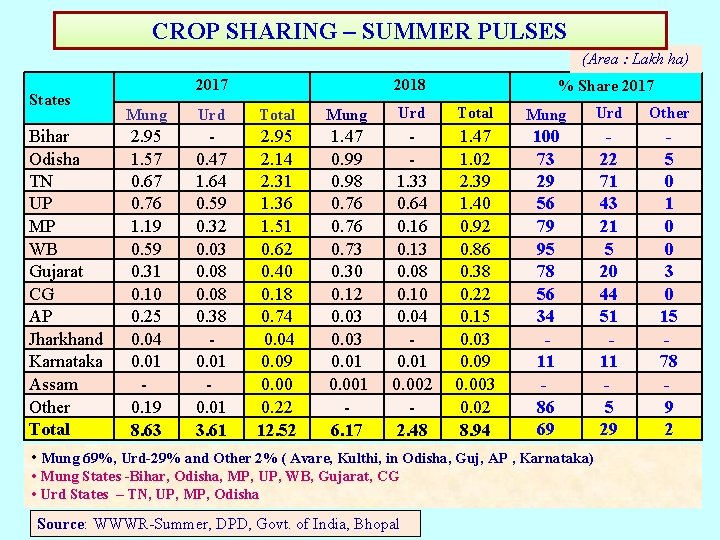
CROP SHARING – SUMMER PULSES (Area : Lakh ha) States Bihar Odisha TN UP MP WB Gujarat CG AP Jharkhand Karnataka Assam Other Total 2017 2018 % Share 2017 Mung Urd Total Mung Urd Other 2. 95 1. 57 0. 67 0. 76 1. 19 0. 59 0. 31 0. 10 0. 25 0. 04 0. 01 - 0. 19 8. 63 0. 47 1. 64 0. 59 0. 32 0. 03 0. 08 0. 38 0. 01 - 0. 01 3. 61 2. 95 2. 14 2. 31 1. 36 1. 51 0. 62 0. 40 0. 18 0. 74 0. 09 0. 00 0. 22 12. 52 1. 47 0. 99 0. 98 0. 76 0. 73 0. 30 0. 12 0. 03 0. 01 0. 001 6. 17 1. 33 0. 64 0. 16 0. 13 0. 08 0. 10 0. 04 0. 01 0. 002 2. 48 1. 47 1. 02 2. 39 1. 40 0. 92 0. 86 0. 38 0. 22 0. 15 0. 03 0. 09 0. 003 0. 02 8. 94 100 73 29 56 79 95 78 56 34 11 - 86 69 22 71 43 21 5 20 44 51 11 - 5 29 5 0 1 0 0 3 0 15 - 78 - 9 2 • Mung 69%, Urd-29% and Other 2% ( Avare, Kulthi, in Odisha, Guj, AP , Karnataka) • Mung States -Bihar, Odisha, MP, UP, WB, Gujarat, CG • Urd States – TN, UP, MP, Odisha Source: WWWR-Summer, DPD, Govt. of India, Bhopal
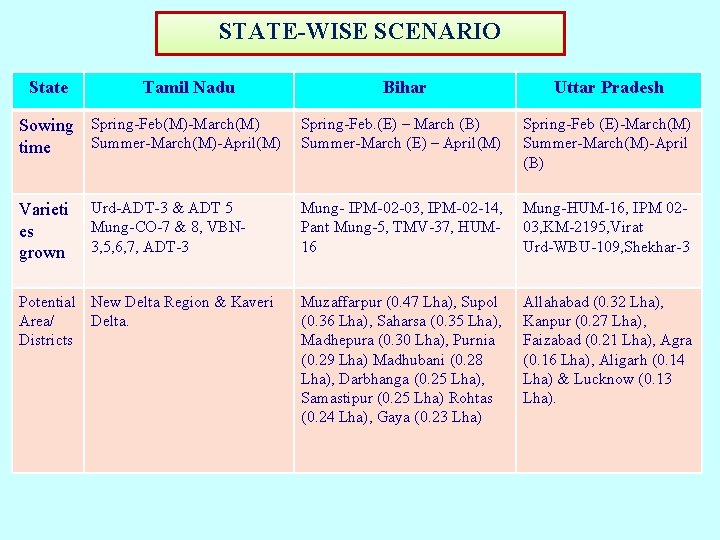
STATE-WISE SCENARIO State Tamil Nadu Sowing Spring-Feb(M)-March(M) Summer-March(M)-April(M) time Varieti es grown Urd-ADT-3 & ADT 5 Mung-CO-7 & 8, VBN 3, 5, 6, 7, ADT-3 Potential New Delta Region & Kaveri Area/ Delta. Districts Bihar Uttar Pradesh Spring-Feb. (E) – March (B) Summer-March (E) – April(M) Spring-Feb (E)-March(M) Summer-March(M)-April (B) Mung- IPM-02 -03, IPM-02 -14, Pant Mung-5, TMV-37, HUM 16 Mung-HUM-16, IPM 0203, KM-2195, Virat Urd-WBU-109, Shekhar-3 Muzaffarpur (0. 47 Lha), Supol (0. 36 Lha), Saharsa (0. 35 Lha), Madhepura (0. 30 Lha), Purnia (0. 29 Lha) Madhubani (0. 28 Lha), Darbhanga (0. 25 Lha), Samastipur (0. 25 Lha) Rohtas (0. 24 Lha), Gaya (0. 23 Lha) Allahabad (0. 32 Lha), Kanpur (0. 27 Lha), Faizabad (0. 21 Lha), Agra (0. 16 Lha), Aligarh (0. 14 Lha) & Lucknow (0. 13 Lha).
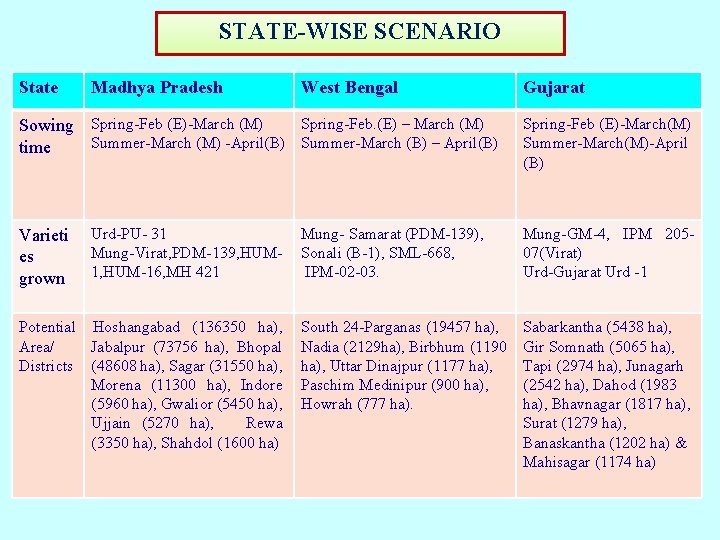
STATE-WISE SCENARIO State Madhya Pradesh West Bengal Spring-Feb. (E) – March (M) Sowing Spring-Feb (E)-March (M) Summer-March (M) -April(B) Summer-March (B) – April(B) time Varieti es grown Urd-PU- 31 Mung-Virat, PDM-139, HUM 1, HUM-16, MH 421 Potential Hoshangabad (136350 ha), Area/ Jabalpur (73756 ha), Bhopal Districts (48608 ha), Sagar (31550 ha), Morena (11300 ha), Indore (5960 ha), Gwalior (5450 ha), Ujjain (5270 ha), Rewa (3350 ha), Shahdol (1600 ha) Gujarat Spring-Feb (E)-March(M) Summer-March(M)-April (B) Mung- Samarat (PDM-139), Sonali (B-1), SML-668, IPM-02 -03. Mung-GM-4, IPM 20507(Virat) Urd-Gujarat Urd -1 South 24 -Parganas (19457 ha), Nadia (2129 ha), Birbhum (1190 ha), Uttar Dinajpur (1177 ha), Paschim Medinipur (900 ha), Howrah (777 ha). Sabarkantha (5438 ha), Gir Somnath (5065 ha), Tapi (2974 ha), Junagarh (2542 ha), Dahod (1983 ha), Bhavnagar (1817 ha), Surat (1279 ha), Banaskantha (1202 ha) & Mahisagar (1174 ha)
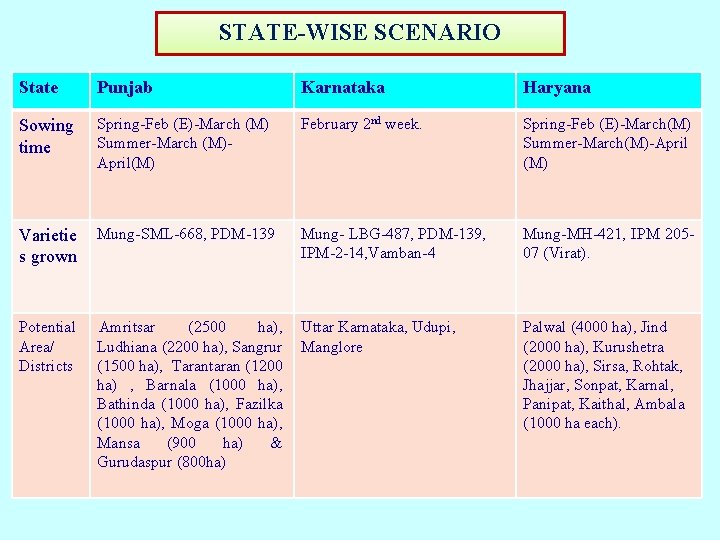
STATE-WISE SCENARIO State Punjab Karnataka Haryana Sowing time Spring-Feb (E)-March (M) Summer-March (M)April(M) February 2 nd week. Spring-Feb (E)-March(M) Summer-March(M)-April (M) Mung- LBG-487, PDM-139, IPM-2 -14, Vamban-4 Mung-MH-421, IPM 20507 (Virat). Varietie Mung-SML-668, PDM-139 s grown Potential Area/ Districts Amritsar (2500 ha), Uttar Karnataka, Udupi, Ludhiana (2200 ha), Sangrur Manglore (1500 ha), Tarantaran (1200 ha) , Barnala (1000 ha), Bathinda (1000 ha), Fazilka (1000 ha), Moga (1000 ha), Mansa (900 ha) & Gurudaspur (800 ha) Palwal (4000 ha), Jind (2000 ha), Kurushetra (2000 ha), Sirsa, Rohtak, Jhajjar, Sonpat, Karnal, Panipat, Kaithal, Ambala (1000 ha each).
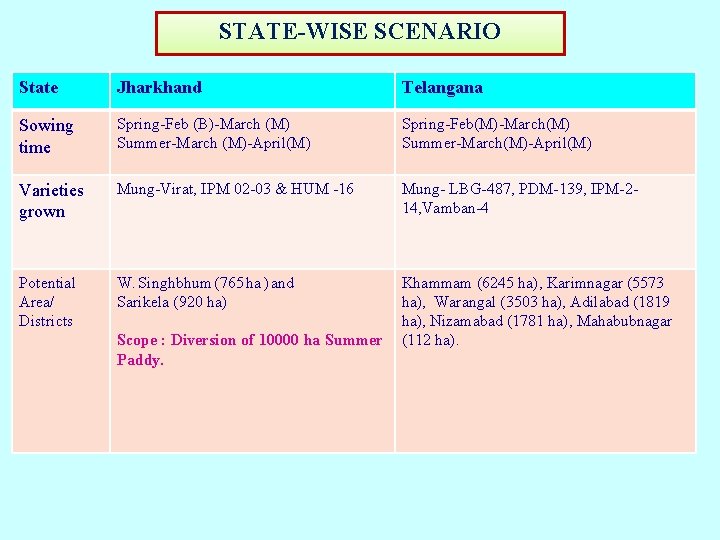
STATE-WISE SCENARIO State Jharkhand Telangana Sowing time Spring-Feb (B)-March (M) Summer-March (M)-April(M) Spring-Feb(M)-March(M) Summer-March(M)-April(M) Varieties grown Mung-Virat, IPM 02 -03 & HUM -16 Mung- LBG-487, PDM-139, IPM-214, Vamban-4 Potential Area/ Districts W. Singhbhum (765 ha ) and Khammam (6245 ha), Karimnagar (5573 Sarikela (920 ha), Warangal (3503 ha), Adilabad (1819 ha), Nizamabad (1781 ha), Mahabubnagar Scope : Diversion of 10000 ha Summer (112 ha). Paddy.
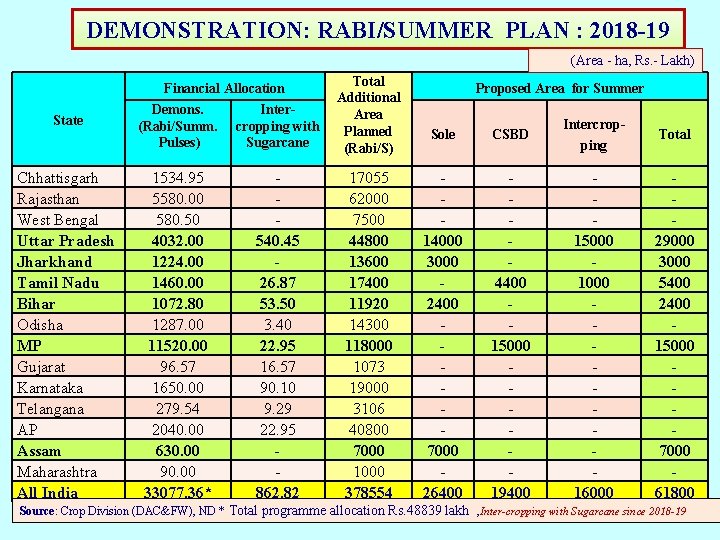
DEMONSTRATION: RABI/SUMMER PLAN : 2018 -19 (Area - ha, Rs. - Lakh) Total Additional Inter. Area cropping with Planned Sugarcane (Rabi/S) Financial Allocation State Demons. (Rabi/Summ. Pulses) Chhattisgarh Rajasthan West Bengal Uttar Pradesh Jharkhand Tamil Nadu Bihar Odisha MP Gujarat Karnataka Telangana AP Assam Maharashtra All India 1534. 95 5580. 00 580. 50 4032. 00 1224. 00 1460. 00 1072. 80 1287. 00 11520. 00 96. 57 1650. 00 279. 54 2040. 00 630. 00 90. 00 33077. 36* 540. 45 26. 87 53. 50 3. 40 22. 95 16. 57 90. 10 9. 29 22. 95 862. 82 17055 62000 7500 44800 13600 17400 11920 14300 118000 1073 19000 3106 40800 7000 1000 378554 Proposed Area for Summer Sole CSBD Intercropping Total 14000 3000 2400 7000 26400 4400 15000 19400 15000 16000 29000 3000 5400 2400 15000 7000 61800 Source: Crop Division (DAC&FW), ND * Total programme allocation Rs. 48839 lakh , Inter-cropping with Sugarcane since 2018 -19
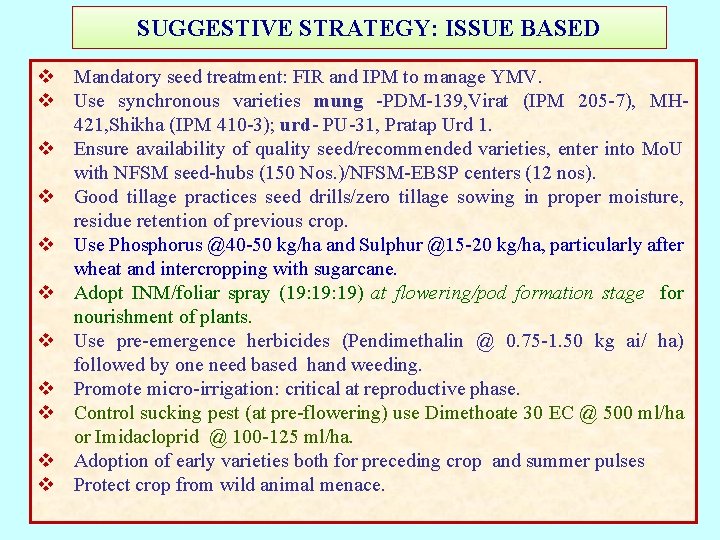
SUGGESTIVE STRATEGY: ISSUE BASED v Mandatory seed treatment: FIR and IPM to manage YMV. v Use synchronous varieties mung -PDM-139, Virat (IPM 205 -7), MH 421, Shikha (IPM 410 -3); urd- PU-31, Pratap Urd 1. v Ensure availability of quality seed/recommended varieties, enter into Mo. U with NFSM seed-hubs (150 Nos. )/NFSM-EBSP centers (12 nos). v Good tillage practices seed drills/zero tillage sowing in proper moisture, residue retention of previous crop. v Use Phosphorus @40 -50 kg/ha and Sulphur @15 -20 kg/ha, particularly after wheat and intercropping with sugarcane. v Adopt INM/foliar spray (19: 19) at flowering/pod formation stage for nourishment of plants. v Use pre-emergence herbicides (Pendimethalin @ 0. 75 -1. 50 kg ai/ ha) followed by one need based hand weeding. v Promote micro-irrigation: critical at reproductive phase. v Control sucking pest (at pre-flowering) use Dimethoate 30 EC @ 500 ml/ha or Imidacloprid @ 100 -125 ml/ha. v Adoption of early varieties both for preceding crop and summer pulses v Protect crop from wild animal menace.
Thank You
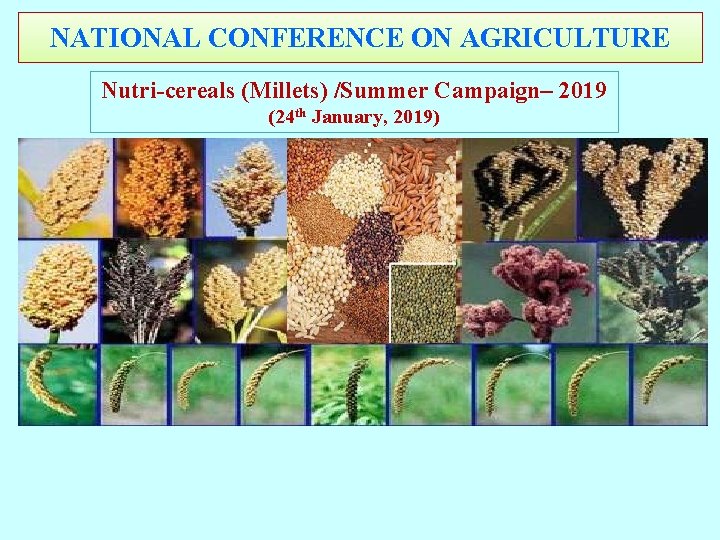
NATIONAL CONFERENCE ON AGRICULTURE Nutri-cereals (Millets) /Summer Campaign– 2019 (24 th January, 2019)
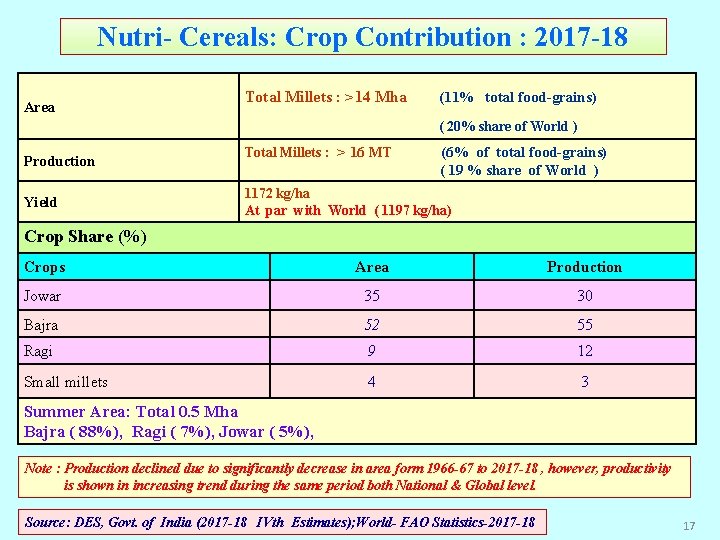
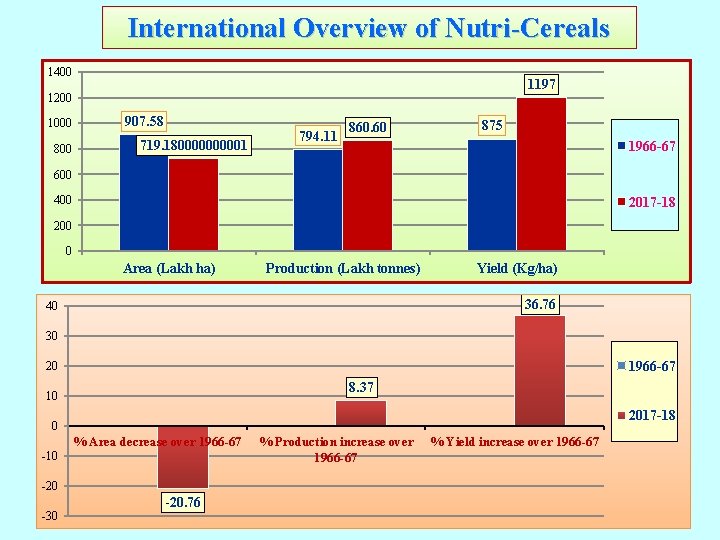
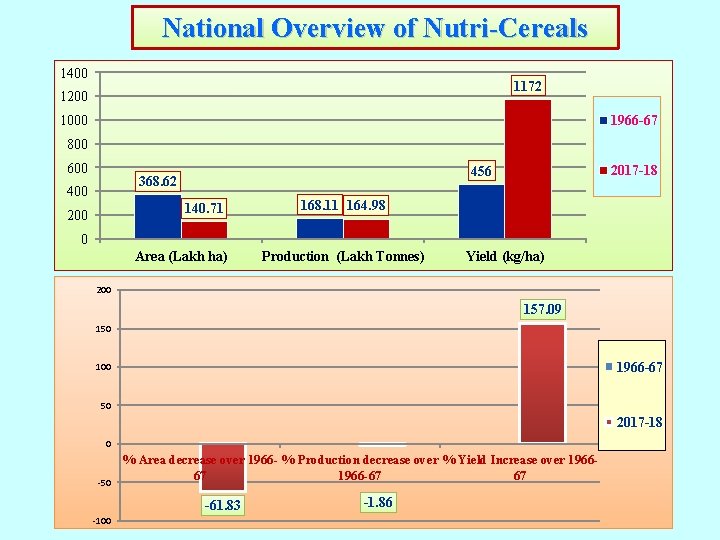
Nutri- Cereals: Crop Contribution : 2017 -18 Area Total Millets : >14 Mha (11% total food-grains) ( 20% share of World ) Production Yield Total Millets : > 16 MT (6% of total food-grains) ( 19 % share of World ) 1172 kg/ha At par with World ( 1197 kg/ha) Crop Share (%) Crops Area Production Jowar 35 30 Bajra 52 55 Ragi 9 12 Small millets 4 3 Summer Area: Total 0. 5 Mha Bajra ( 88%), Ragi ( 7%), Jowar ( 5%), Note : Production declined due to significantly decrease in area form 1966 -67 to 2017 -18 , however, productivity is shown in increasing trend during the same period both National & Global level. Source: DES, Govt. of India (2017 -18 IVth Estimates); World- FAO Statistics-2017 -18 17
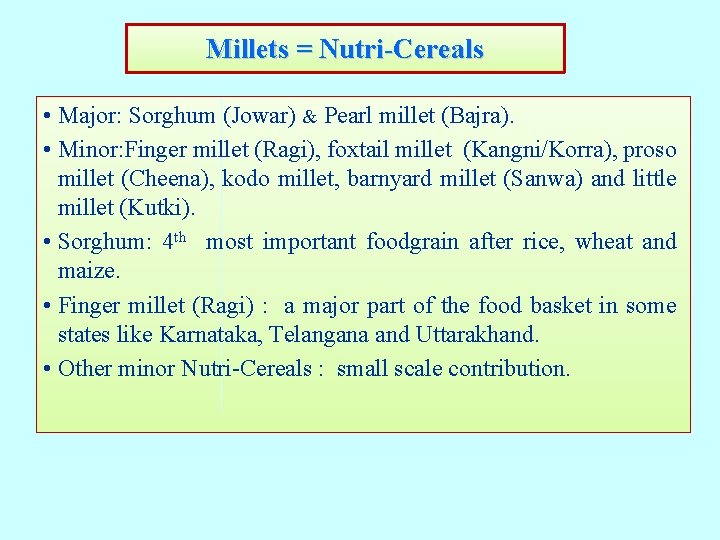
Millets = Nutri-Cereals • Major: Sorghum (Jowar) & Pearl millet (Bajra). • Minor: Finger millet (Ragi), foxtail millet (Kangni/Korra), proso millet (Cheena), kodo millet, barnyard millet (Sanwa) and little millet (Kutki). • Sorghum: 4 th most important foodgrain after rice, wheat and maize. • Finger millet (Ragi) : a major part of the food basket in some states like Karnataka, Telangana and Uttarakhand. • Other minor Nutri-Cereals : small scale contribution.
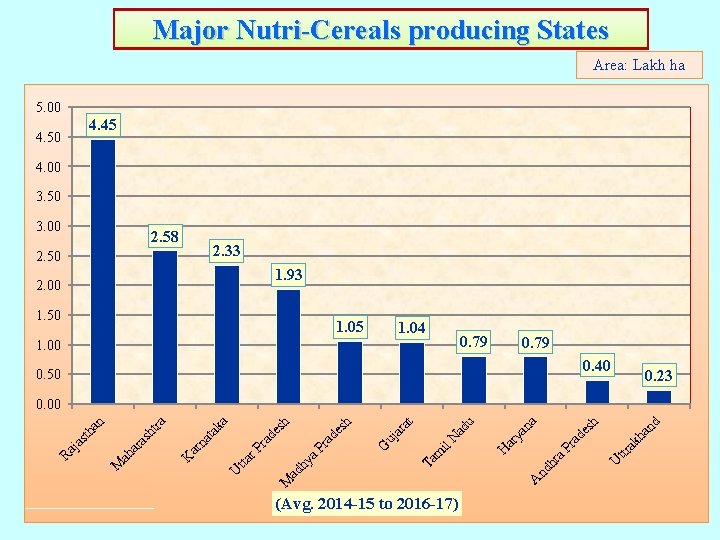
Major Nutri-Cereals producing States Area: Lakh ha 5. 00 4. 45 4. 50 4. 00 3. 50 3. 00 2. 58 2. 33 2. 50 1. 93 2. 00 1. 50 1. 05 1. 04 0. 79 1. 00 0. 79 0. 40 0. 50 0. 23 (Avg. 2014 -15 to 2016 -17) ttr nd hr a U P ra d ak ha nd es h na ar ya H A Ta m il N ad u t uj ar a G es h M ad hy a P de s r P ra tta U ra d h a ak na t ar K ra s ah a M Ra ja sth an ht ra 0. 00
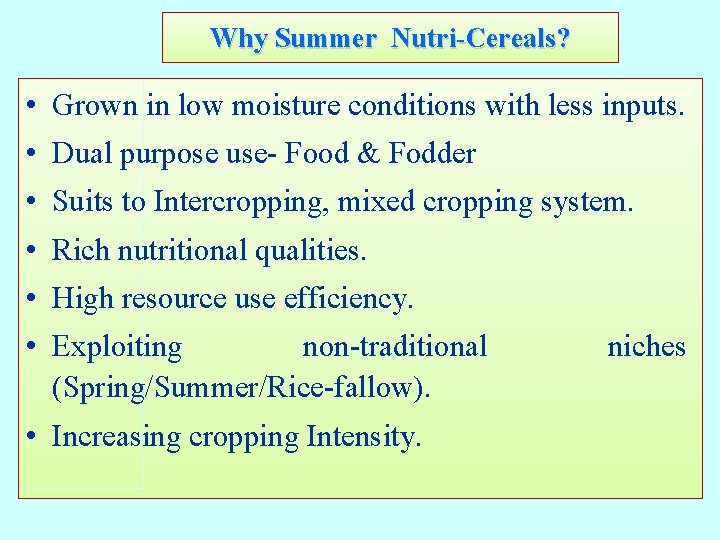
Why Summer Nutri-Cereals? • Grown in low moisture conditions with less inputs. • Dual purpose use- Food & Fodder • Suits to Intercropping, mixed cropping system. • Rich nutritional qualities. • High resource use efficiency. • Exploiting non-traditional (Spring/Summer/Rice-fallow). • Increasing cropping Intensity. niches
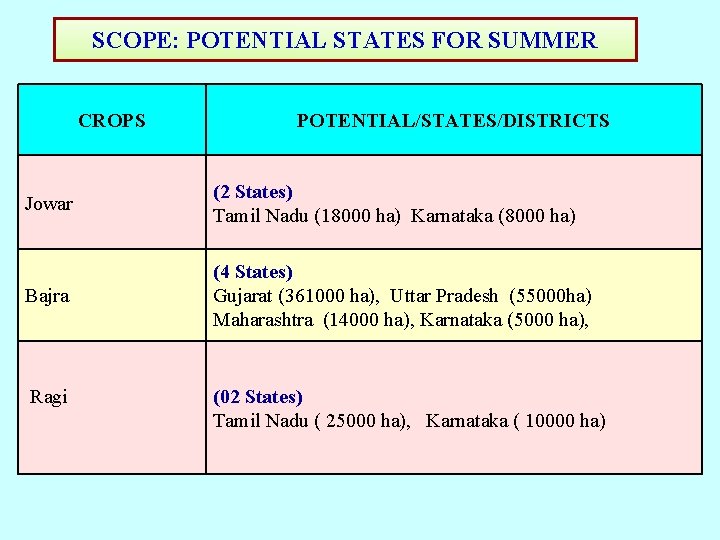
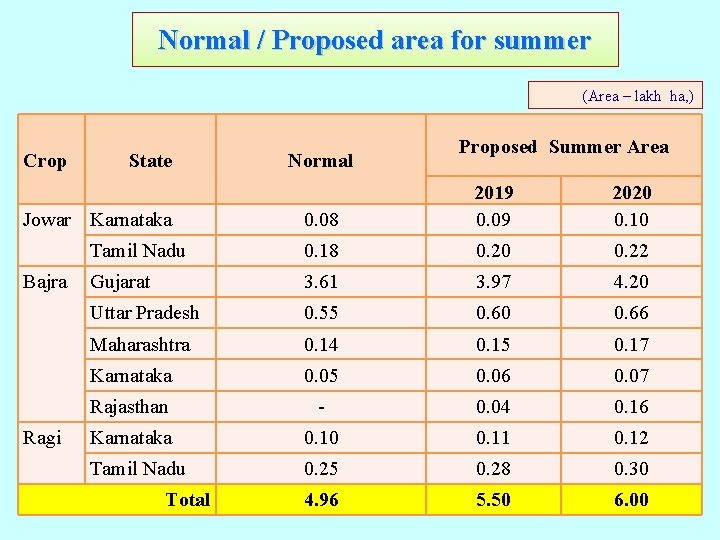
SCOPE: POTENTIAL STATES FOR SUMMER CROPS POTENTIAL/STATES/DISTRICTS Jowar (2 States) Tamil Nadu (18000 ha) Karnataka (8000 ha) Bajra (4 States) Gujarat (361000 ha), Uttar Pradesh (55000 ha) Maharashtra (14000 ha), Karnataka (5000 ha), Ragi (02 States) Tamil Nadu ( 25000 ha), Karnataka ( 10000 ha)
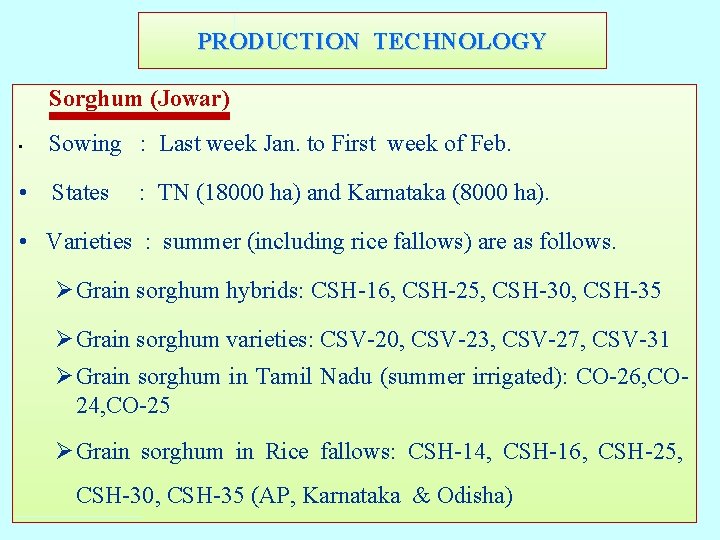
PRODUCTION TECHNOLOGY Sorghum (Jowar) • Sowing : Last week Jan. to First week of Feb. • States : TN (18000 ha) and Karnataka (8000 ha). • Varieties : summer (including rice fallows) are as follows. Ø Grain sorghum hybrids: CSH-16, CSH-25, CSH-30, CSH-35 Ø Grain sorghum varieties: CSV-20, CSV-23, CSV-27, CSV-31 Ø Grain sorghum in Tamil Nadu (summer irrigated): CO-26, CO 24, CO-25 Ø Grain sorghum in Rice fallows: CSH-14, CSH-16, CSH-25, CSH-30, CSH-35 (AP, Karnataka & Odisha)
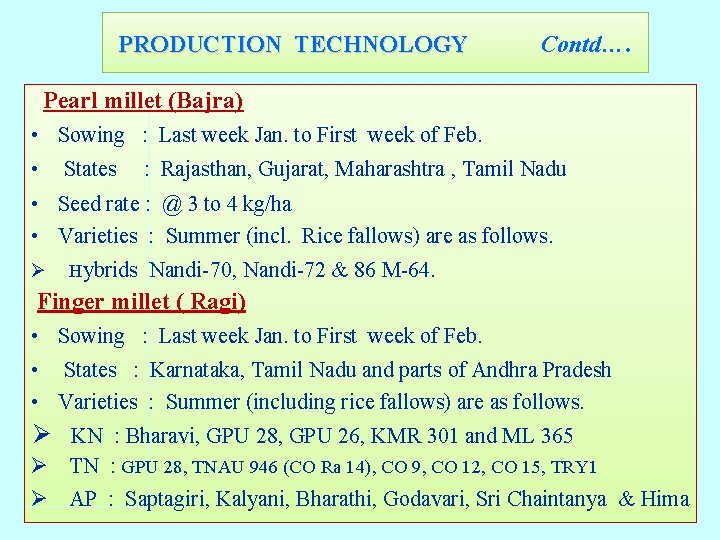
PRODUCTION TECHNOLOGY Contd…. PRODUCTION TECHNOLOGY Pearl millet (Bajra) • Sowing : Last week Jan. to First week of Feb. • States : Rajasthan, Gujarat, Maharashtra , Tamil Nadu • Seed rate : @ 3 to 4 kg/ha • Varieties : Summer (incl. Rice fallows) are as follows. Ø Hybrids Nandi-70, Nandi-72 & 86 M-64. Finger millet ( Ragi) • Sowing : Last week Jan. to First week of Feb. • States : Karnataka, Tamil Nadu and parts of Andhra Pradesh • Varieties : Summer (including rice fallows) are as follows. Ø KN : Bharavi, GPU 28, GPU 26, KMR 301 and ML 365 Ø TN : GPU 28, TNAU 946 (CO Ra 14), CO 9, CO 12, CO 15, TRY 1 Ø AP : Saptagiri, Kalyani, Bharathi, Godavari, Sri Chaintanya & Hima
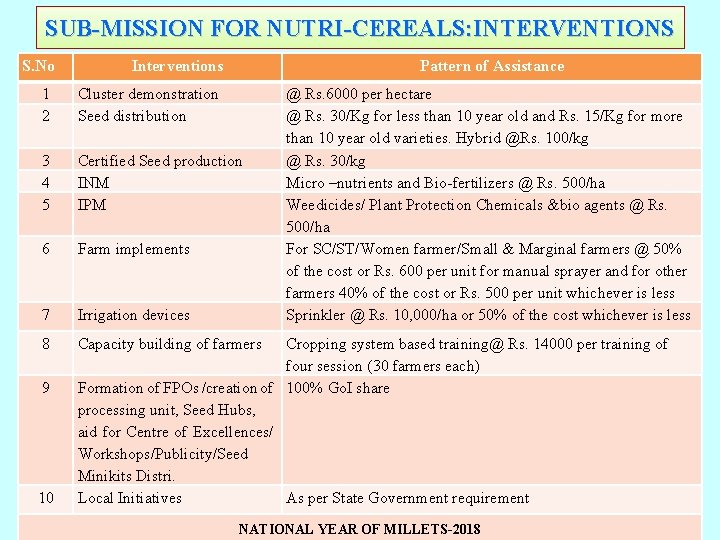
SUB-MISSION FOR NUTRI-CEREALS: INTERVENTIONS S. No Interventions Pattern of Assistance 1 2 Cluster demonstration Seed distribution 3 4 5 Certified Seed production INM IPM 6 Farm implements 7 Irrigation devices 8 Capacity building of farmers 9 10 @ Rs. 6000 per hectare @ Rs. 30/Kg for less than 10 year old and Rs. 15/Kg for more than 10 year old varieties. Hybrid @Rs. 100/kg @ Rs. 30/kg Micro –nutrients and Bio-fertilizers @ Rs. 500/ha Weedicides/ Plant Protection Chemicals &bio agents @ Rs. 500/ha For SC/ST/Women farmer/Small & Marginal farmers @ 50% of the cost or Rs. 600 per unit for manual sprayer and for other farmers 40% of the cost or Rs. 500 per unit whichever is less Sprinkler @ Rs. 10, 000/ha or 50% of the cost whichever is less Cropping system based training@ Rs. 14000 per training of four session (30 farmers each) Formation of FPOs /creation of 100% Go. I share processing unit, Seed Hubs, aid for Centre of Excellences/ Workshops/Publicity/Seed Minikits Distri. Local Initiatives As per State Government requirement NATIONAL YEAR OF MILLETS-2018
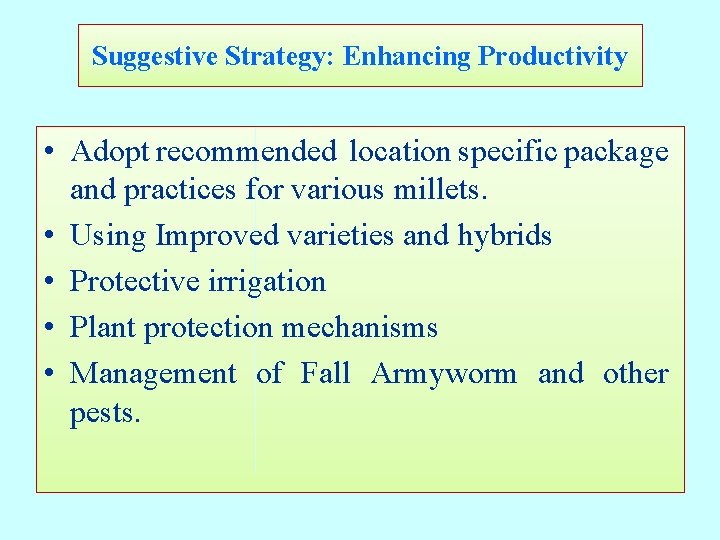
Suggestive Strategy: Enhancing Productivity • Adopt recommended location specific package and practices for various millets. • Using Improved varieties and hybrids • Protective irrigation • Plant protection mechanisms • Management of Fall Armyworm and other pests.
Normal / Proposed area for summer (Area – lakh ha, ) Crop State Ragi Proposed Summer Area 0. 08 2019 0. 09 2020 0. 10 Tamil Nadu 0. 18 0. 20 0. 22 Gujarat 3. 61 3. 97 4. 20 Uttar Pradesh 0. 55 0. 60 0. 66 Maharashtra 0. 14 0. 15 0. 17 Karnataka 0. 05 0. 06 0. 07 Rajasthan - 0. 04 0. 16 Karnataka 0. 10 0. 11 0. 12 Tamil Nadu 0. 25 0. 28 0. 30 4. 96 5. 50 6. 00 Jowar Karnataka Bajra Normal Total
Thanks Dr. Vilas Tonapi: Proposed work Plan 27 2/26/2021
Others Slides
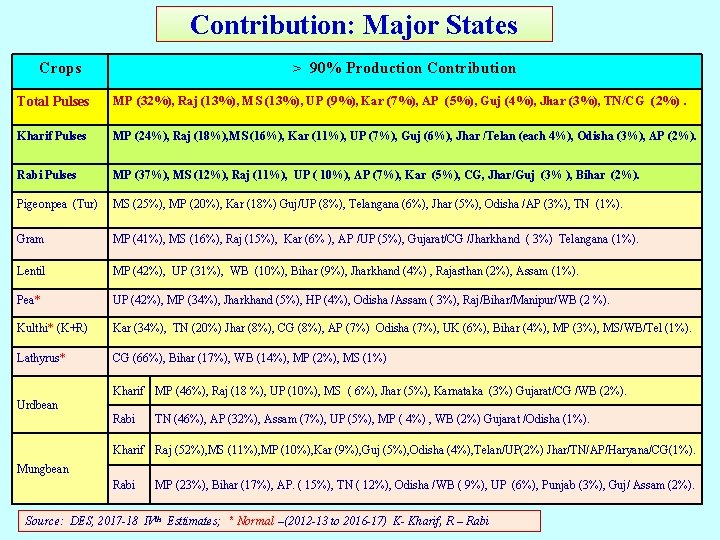
Contribution: Major States Crops > 90% Production Contribution Total Pulses MP (32%), Raj (13%), MS (13%), UP (9%), Kar (7%), AP (5%), Guj (4%), Jhar (3%), TN/CG (2%). Kharif Pulses MP (24%), Raj (18%), MS (16%), Kar (11%), UP (7%), Guj (6%), Jhar /Telan (each 4%), Odisha (3%), AP (2%). Rabi Pulses MP (37%), MS (12%), Raj (11%), UP ( 10%), AP (7%), Kar (5%), CG, Jhar/Guj (3% ), Bihar (2%). Pigeonpea (Tur) MS (25%), MP (20%), Kar (18%) Guj/UP (8%), Telangana (6%), Jhar (5%), Odisha /AP (3%), TN (1%). Gram MP (41%), MS (16%), Raj (15%), Kar (6% ), AP /UP (5%), Gujarat/CG /Jharkhand ( 3%) Telangana (1%). Lentil MP (42%), UP (31%), WB (10%), Bihar (9%), Jharkhand (4%) , Rajasthan (2%), Assam (1%). Pea* UP (42%), MP (34%), Jharkhand (5%), HP (4%), Odisha /Assam ( 3%), Raj/Bihar/Manipur/WB (2 %). Kulthi* (K+R) Kar (34%), TN (20%) Jhar (8%), CG (8%), AP (7%) Odisha (7%), UK (6%), Bihar (4%), MP (3%), MS/WB/Tel (1%). Lathyrus* CG (66%), Bihar (17%), WB (14%), MP (2%), MS (1%) Kharif MP (46%), Raj (18 %), UP (10%), MS ( 6%), Jhar (5%), Karnataka (3%) Gujarat/CG /WB (2%). Urdbean Rabi TN (46%), AP (32%), Assam (7%), UP (5%), MP ( 4%) , WB (2%) Gujarat /Odisha (1%). Kharif Raj (52%), MS (11%), MP (10%), Kar (9%), Guj (5%), Odisha (4%), Telan/UP(2%) Jhar/TN/AP/Haryana/CG(1%). Mungbean Rabi MP (23%), Bihar (17%), AP. ( 15%), TN ( 12%), Odisha /WB ( 9%), UP (6%), Punjab (3%), Guj/ Assam (2%). Source: DES, 2017 -18 IVth Esttimates; * Normal –(2012 -13 to 2016 -17) K- Kharif, R – Rabi
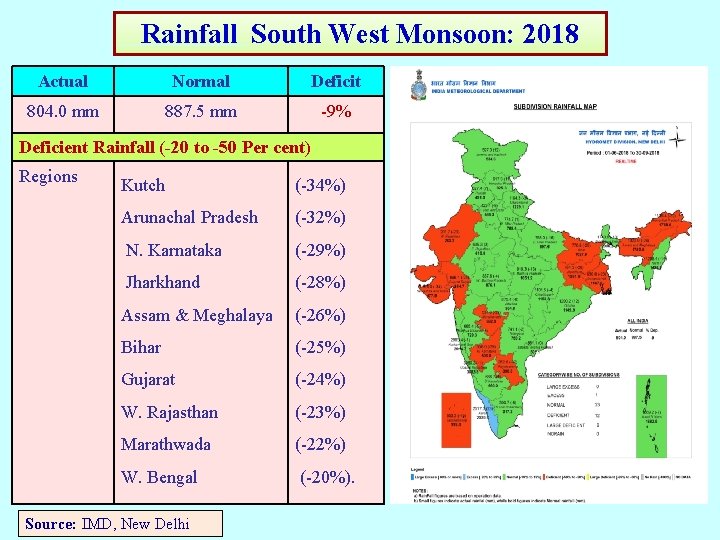
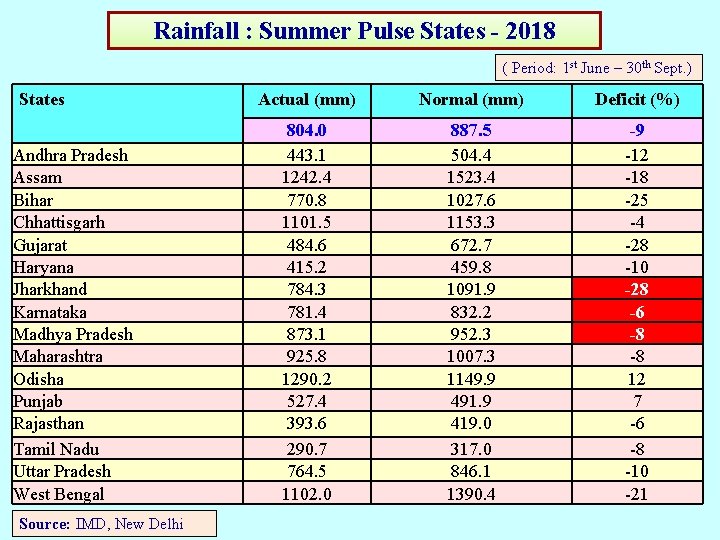
Rainfall South West Monsoon: 2018 Actual Normal Deficit 804. 0 mm 887. 5 mm -9% Deficient Rainfall (-20 to -50 Per cent) Regions Kutch (-34%) Arunachal Pradesh (-32%) N. Karnataka (-29%) Jharkhand (-28%) Assam & Meghalaya (-26%) Bihar (-25%) Gujarat (-24%) W. Rajasthan (-23%) Marathwada (-22%) W. Bengal (-20%). Source: IMD, New Delhi
Rainfall : Summer Pulse States - 2018 ( Period: 1 st June – 30 th Sept. ) States Andhra Pradesh Assam Bihar Chhattisgarh Gujarat Haryana Jharkhand Karnataka Madhya Pradesh Maharashtra Odisha Punjab Rajasthan Tamil Nadu Uttar Pradesh West Bengal Source: IMD, New Delhi Actual (mm) Normal (mm) Deficit (%) 804. 0 443. 1 1242. 4 770. 8 1101. 5 484. 6 415. 2 784. 3 781. 4 873. 1 925. 8 1290. 2 527. 4 393. 6 290. 7 764. 5 1102. 0 887. 5 504. 4 1523. 4 1027. 6 1153. 3 672. 7 459. 8 1091. 9 832. 2 952. 3 1007. 3 1149. 9 491. 9 419. 0 317. 0 846. 1 1390. 4 -9 -12 -18 -25 -4 -28 -10 -28 -6 -8 -8 12 7 -6 -8 -10 -21
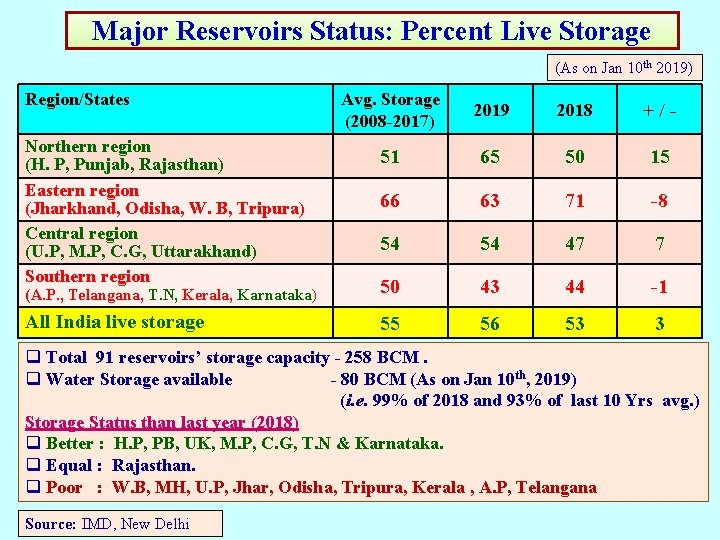
Major Reservoirs Status: Percent Live Storage (As on Jan 10 th 2019) Region/States Avg. Storage (2008 -2017) 2019 2018 + / - 51 65 50 15 66 63 71 -8 54 54 47 7 (A. P. , Telangana, T. N, Kerala, Karnataka) 50 43 44 -1 All India live storage 55 56 53 3 Northern region (H. P, Punjab, Rajasthan) Eastern region (Jharkhand, Odisha, W. B, Tripura) Central region (U. P, M. P, C. G, Uttarakhand) Southern region q Total 91 reservoirs’ storage capacity - 258 BCM. q Water Storage available - 80 BCM (As on Jan 10 th, 2019) (i. e. 99% of 2018 and 93% of last 10 Yrs avg. ) Storage Status than last year (2018) q Better : H. P, PB, UK, M. P, C. G, T. N & Karnataka. q Equal : Rajasthan. q Poor : W. B, MH, U. P, Jhar, Odisha, Tripura, Kerala , A. P, Telangana Source: IMD, New Delhi
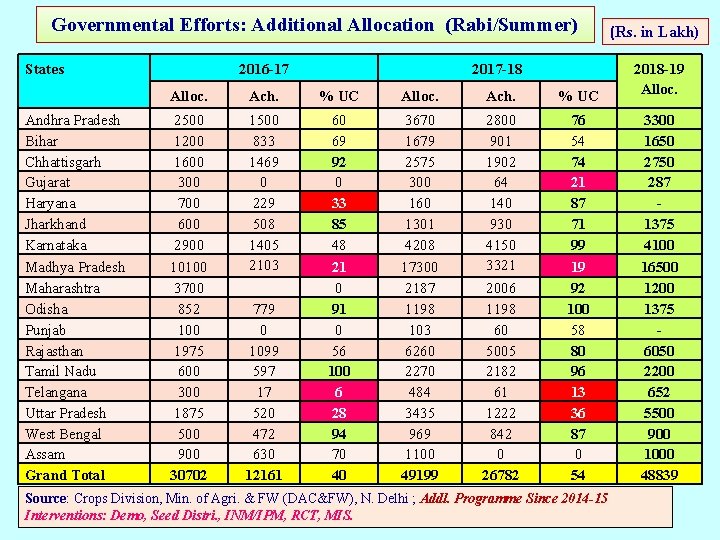
Governmental Efforts: Additional Allocation (Rabi/Summer) States Andhra Pradesh Bihar Chhattisgarh Gujarat Haryana Jharkhand Karnataka Madhya Pradesh Maharashtra Odisha Punjab Rajasthan Tamil Nadu Telangana Uttar Pradesh West Bengal Assam Grand Total 2016 -17 Alloc. Ach. % UC 2018 -19 Alloc. 2500 1200 1600 300 700 600 2900 10100 3700 852 100 1975 600 300 1875 500 900 30702 1500 833 1469 0 229 508 1405 2103 60 69 92 0 33 85 48 21 0 91 0 56 100 6 28 94 70 40 3670 1679 2575 300 160 1301 4208 17300 2187 1198 103 6260 2270 484 3435 969 1100 49199 2800 901 1902 64 140 930 4150 3321 76 54 74 21 87 71 99 19 92 100 58 80 96 13 36 87 0 54 3300 1650 2750 287 - 1375 4100 16500 1200 1375 - 6050 2200 652 5500 900 1000 48839 779 0 1099 597 17 520 472 630 12161 2017 -18 (Rs. in Lakh) 2006 1198 60 5005 2182 61 1222 842 0 26782 Source: Crops Division, Min. of Agri. & FW (DAC&FW), N. Delhi ; Addl. Programme Since 2014 -15 Interventions: Demo, Seed Distri. , INM/IPM, RCT, MIS.
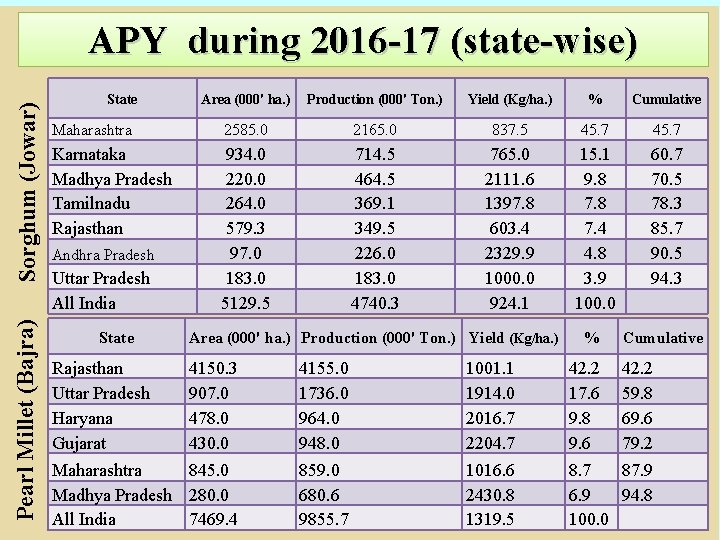
Pearl Millet (Bajra) Sorghum (Jowar) APY during 2016 -17 (state-wise) State Area (000' ha. ) Production (000' Ton. ) Yield (Kg/ha. ) % Cumulative Maharashtra 2585. 0 2165. 0 837. 5 45. 7 Karnataka Madhya Pradesh Tamilnadu Rajasthan 934. 0 220. 0 264. 0 579. 3 97. 0 183. 0 5129. 5 714. 5 464. 5 369. 1 349. 5 226. 0 183. 0 4740. 3 765. 0 2111. 6 1397. 8 603. 4 2329. 9 1000. 0 924. 1 Andhra Pradesh Uttar Pradesh All India State Rajasthan Uttar Pradesh Haryana Gujarat Area (000' ha. ) Production (000' Ton. ) Yield (Kg/ha. ) 15. 1 9. 8 7. 4 4. 8 3. 9 100. 0 % 60. 7 70. 5 78. 3 85. 7 90. 5 94. 3 Cumulative 4150. 3 907. 0 478. 0 430. 0 4155. 0 1736. 0 964. 0 948. 0 1001. 1 1914. 0 2016. 7 2204. 7 42. 2 17. 6 9. 8 9. 6 42. 2 59. 8 69. 6 79. 2 Maharashtra 845. 0 Madhya Pradesh 280. 0 All India 7469. 4 859. 0 680. 6 9855. 7 1016. 6 2430. 8 1319. 5 8. 7 87. 9 6. 9 94. 8 100. 0
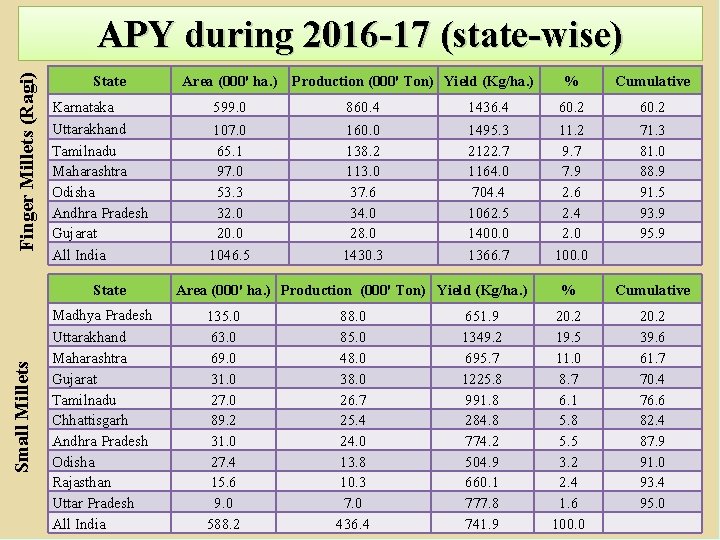
Finger Millets (Ragi) APY during 2016 -17 (state-wise) State Karnataka Uttarakhand Tamilnadu Maharashtra Odisha Andhra Pradesh Gujarat All India Small Millets State Madhya Pradesh Uttarakhand Maharashtra Gujarat Tamilnadu Chhattisgarh Andhra Pradesh Odisha Rajasthan Uttar Pradesh All India Area (000' ha. ) Production (000' Ton) Yield (Kg/ha. ) 599. 0 107. 0 65. 1 97. 0 53. 3 32. 0 20. 0 1046. 5 860. 4 160. 0 138. 2 113. 0 37. 6 34. 0 28. 0 1430. 3 1436. 4 1495. 3 2122. 7 1164. 0 704. 4 1062. 5 1400. 0 1366. 7 Area (000' ha. ) Production (000' Ton) Yield (Kg/ha. ) 135. 0 63. 0 69. 0 31. 0 27. 0 89. 2 31. 0 27. 4 15. 6 9. 0 588. 2 88. 0 85. 0 48. 0 38. 0 26. 7 25. 4 24. 0 13. 8 10. 3 7. 0 436. 4 651. 9 1349. 2 695. 7 1225. 8 991. 8 284. 8 774. 2 504. 9 660. 1 777. 8 741. 9 % Cumulative 60. 2 11. 2 9. 7 7. 9 2. 6 2. 4 2. 0 100. 0 60. 2 71. 3 81. 0 88. 9 91. 5 93. 9 95. 9 % Cumulative 20. 2 19. 5 11. 0 8. 7 6. 1 5. 8 5. 5 3. 2 2. 4 1. 6 100. 0 20. 2 39. 6 61. 7 70. 4 76. 6 82. 4 87. 9 91. 0 93. 4 95. 0
International Overview of Nutri-Cereals 1400 1197 1200 1000 800 907. 58 719. 18000001 794. 11 860. 60 875 1966 -67 600 400 2017 -18 200 0 Area (Lakh ha) Production (Lakh tonnes) Yield (Kg/ha) 36. 76 40 30 1966 -67 20 8. 37 10 2017 -18 0 % Area decrease over 1966 -67 -10 -20 -30 -20. 76 % Production increase over 1966 -67 % Yield increase over 1966 -67
National Overview of Nutri-Cereals 1400 1172 1200 1000 1966 -67 800 600 400 140. 71 200 2017 -18 456 368. 62 168. 11 164. 98 0 Area (Lakh ha) Production (Lakh Tonnes) Yield (kg/ha) 200 157. 09 150 1966 -67 100 50 2017 -18 0 -50 % Area decrease over 1966 - % Production decrease over % Yield Increase over 196667 1966 -67 67 -61. 83 -100 -1. 86
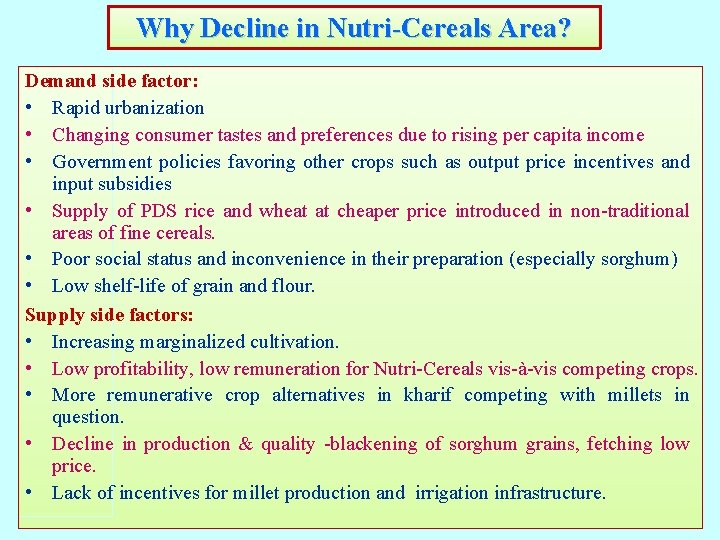
Why Decline in Nutri-Cereals Area? Demand side factor: • Rapid urbanization • Changing consumer tastes and preferences due to rising per capita income • Government policies favoring other crops such as output price incentives and input subsidies • Supply of PDS rice and wheat at cheaper price introduced in non-traditional areas of fine cereals. • Poor social status and inconvenience in their preparation (especially sorghum) • Low shelf-life of grain and flour. Supply side factors: • Increasing marginalized cultivation. • Low profitability, low remuneration for Nutri-Cereals vis-à-vis competing crops. • More remunerative crop alternatives in kharif competing with millets in question. • Decline in production & quality -blackening of sorghum grains, fetching low price. • Lack of incentives for millet production and irrigation infrastructure.
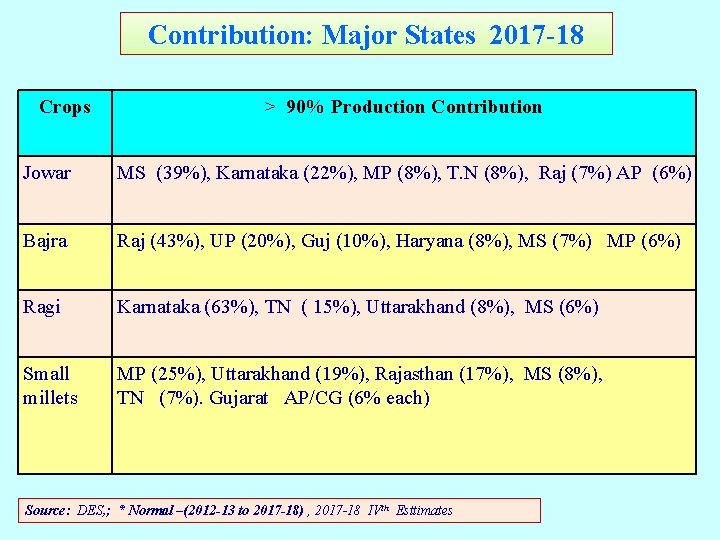
Contribution: Major States 2017 -18 Crops > 90% Production Contribution Jowar MS (39%), Karnataka (22%), MP (8%), T. N (8%), Raj (7%) AP (6%) Bajra Raj (43%), UP (20%), Guj (10%), Haryana (8%), MS (7%) MP (6%) Ragi Karnataka (63%), TN ( 15%), Uttarakhand (8%), MS (6%) Small millets MP (25%), Uttarakhand (19%), Rajasthan (17%), MS (8%), TN (7%). Gujarat AP/CG (6% each) Source: DES, ; * Normal –(2012 -13 to 2017 -18) , 2017 -18 IVth Esttimates
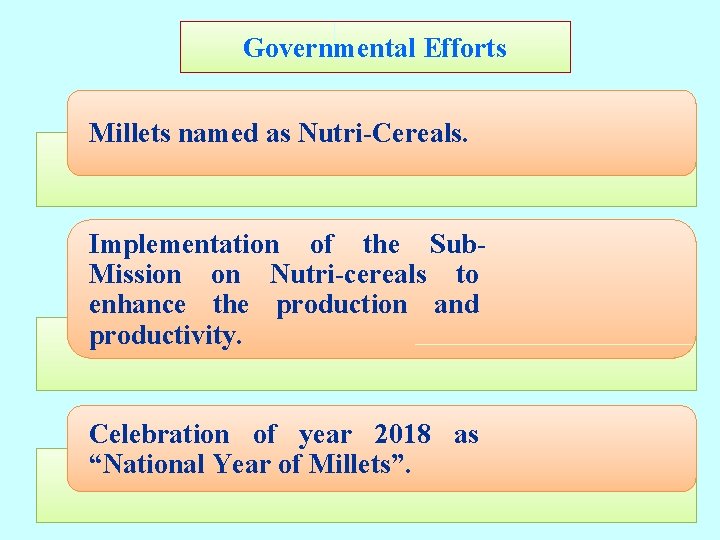
Governmental Efforts Millets named as Nutri-Cereals. Implementation of the Sub. Mission on Nutri-cereals to enhance the production and productivity. Celebration of year 2018 as “National Year of Millets”.
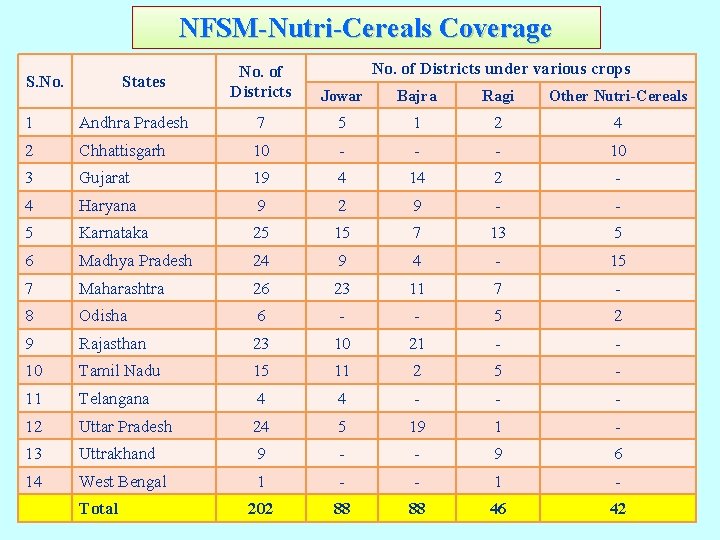
NFSM-Nutri-Cereals Coverage S. No. States No. of Districts under various crops No. of Districts Jowar Bajra Ragi Other Nutri-Cereals 1 Andhra Pradesh 7 5 1 2 4 2 Chhattisgarh 10 - - - 10 3 Gujarat 19 4 14 2 - 4 Haryana 9 2 9 - - 5 Karnataka 25 15 7 13 5 6 Madhya Pradesh 24 9 4 - 15 7 Maharashtra 26 23 11 7 - 8 Odisha 6 - - 5 2 9 Rajasthan 23 10 21 - - 10 Tamil Nadu 15 11 2 5 - 11 Telangana 4 4 - - - 12 Uttar Pradesh 24 5 19 1 - 13 Uttrakhand 9 - - 9 6 14 West Bengal 1 - - 1 - 202 88 88 46 42 Total
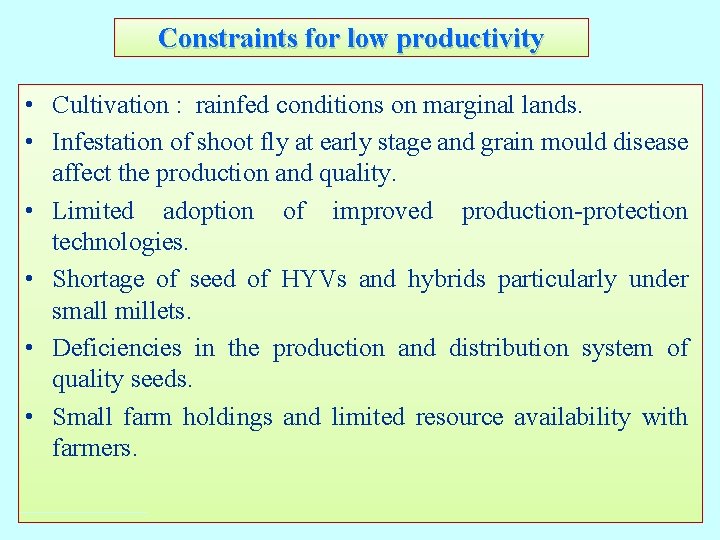
Constraints for low productivity • Cultivation : rainfed conditions on marginal lands. • Infestation of shoot fly at early stage and grain mould disease affect the production and quality. • Limited adoption of improved production-protection technologies. • Shortage of seed of HYVs and hybrids particularly under small millets. • Deficiencies in the production and distribution system of quality seeds. • Small farm holdings and limited resource availability with farmers.
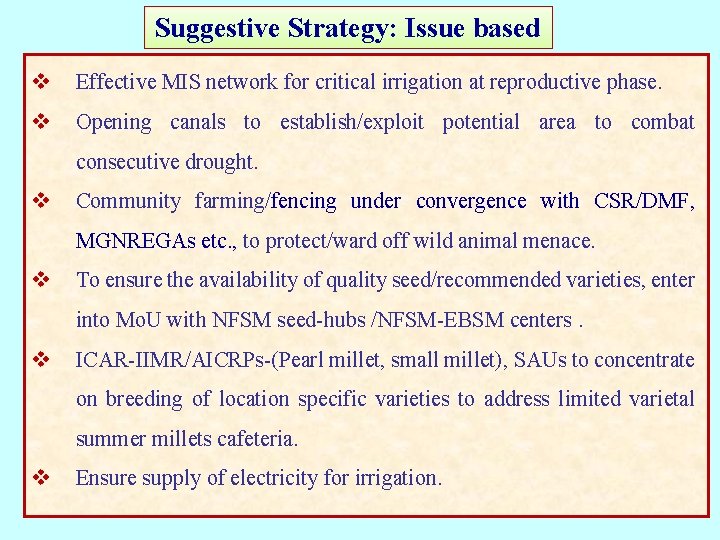
Suggestive Strategy: Issue based v Effective MIS network for critical irrigation at reproductive phase. v Opening canals to establish/exploit potential area to combat consecutive drought. v Community farming/fencing under convergence with CSR/DMF, MGNREGAs etc. , to protect/ward off wild animal menace. v To ensure the availability of quality seed/recommended varieties, enter into Mo. U with NFSM seed-hubs /NFSM-EBSM centers. v ICAR-IIMR/AICRPs-(Pearl millet, small millet), SAUs to concentrate on breeding of location specific varieties to address limited varietal summer millets cafeteria. v Ensure supply of electricity for irrigation.